

Abstract
MicroRNAs (miRNAs) and the Wnt signaling pathway play critical roles in regulating bone development and homeostasis. Our previous study revealed high expression of miR-335-5p in osteoblasts and hypertrophic chondrocytes in mouse embryos and the ability of miR-335-5p to promote osteogenic differentiation by downregulating Wnt antagonist Dickkopf-1 (DKK1). The purpose of this study was to investigate the effects of miR-335-5p constitutive overexpression on bone formation and regeneration in vivo. To that end, we generated a transgenic mouse line specifically over-expressing miR-335-5p in osteoblasts lineage by the osterix promoter and characterized its bone phenotype. Bone histomorphometry and μCT analysis revealed higher bone mass and increased parameters of bone formation in transgenic mice than in wild-type littermates. Increased bone mass in transgenic mice bones also correlated with enhanced expression of osteogenic differentiation markers. Upon osteogenic induction, BMSCs isolated from transgenic mice displayed higher mRNA expression of osteogenic markers than wild-type mice BMSCs cultures. Protein expression of Runx2 and Osx was also upregulated in BMSC cultures of transgenic mice upon osteogenic induction, while that of DKK1 was down-regulated. Most importantly, BMSCs from transgenic mice were able to repair craniofacial bone defects as demonstrated by μCT analysis, H&E staining and OCN immunohistochemistry of newly formed bone in defects treated with BMSCs. Taken together, our results demonstrate constitutive overexpression of miR-335-5p driven by an osterix promoter in the osteoblast lineage induces osteogenic differentiation and bone formation in mice and support the potential application of miR-335-5p-modified BMSCs in craniofacial bone regeneration.
Keywords: miR-335-5p, transgenic mouse, DKK1, WNT, Osteogenic Differentiation, Bone Formation
Introduction
Bone development and remodeling requires tight regulation of gene expression. Mutations in the low-density lipoprotein receptor-related protein 5 (LRP5) leading to osteoporosis (1-2) or osteopetrosis (3), revealed for the first time that Wnt/β-catenin signal pathway was critical for bone development. Gain-of-function or loss-of-function studies further demonstrated this signaling pathway played a key role in lineage decision, proliferation and differentiation of osteoblasts. Thus, at an early stage, β-catenin levels controlled the cell fate of mesenchymal stem cells (MSCs) to become osteoblasts, adipocytes or chondrocytes (4-6). It was also essential for the expression of early osteogenic markers, such as Runt-related transcription factor2 (Runx2) (7), Osterix (Osx) (8) and alkaline phosphatase (ALP) (9). Its activation also promoted osteoblast proliferation (10). At a late stage, downregulation of Wnt/β-catenin signaling is required for terminal differentiation of osteoblasts and expression of osteocalcin (OCN) (11). Hence, Wnt/β-catenin signaling pathway plays critical roles during both bone development and remodeling.
MicroRNAs (miRNAs) are a growing class of small, single-stranded noncoding RNAs which downregulate gene expression through either mRNA degradation or translational inhibition. They exert their effects by partially or fully base pairing with 3′-untranslated region (3′-UTR) of target genes. They are broadly expressed and involved in diverse physiological and pathological processes. The first evidence that miRNA participated in bone metabolism was provided by a study showing that inactivation of Dicer, a protein required to process pre-miRNAs into mature miRNAs, affected osteoblast differentiation (12). Other miRNAs were later shown to be either negative regulators of osteoblast differentiation (13-16), or promote osteoblastogenesis (17-18). Further understanding of the mechanisms through which miRNAs regulate bone metabolism may provide a new strategy to treat bone diseases.
Dickkopf-1 (DKK1) is an antagonist of canonical Wnt signaling pathway. It inhibits Wnt activity through binding to and inactivating signaling from LRP5/6 receptors (19). Downregulation of DKK1 expression has been correlated to increased bone mass (20-21). Our previous study also demonstrated that miR-335-5p decreased DKK1 expression by binding to the 3′-UTR in osteoblasts, activated Wnt signal pathway and promoted osteogenic differentiation (22). In contrast, over-expression of miR-335 inhibited the osteogenic and adipogenic differentiation of MSCs in a different study (23). Overexpression of miR-335-5p was also described to promote chondrogenic differentiation of MSCs (24). The putative role of miR-335-5p in bone metabolism in vivo is however largely unknown.
In this study, we generated a new transgenic mouse line in which miR-335-5p was constitutively overexpressed under the control of Osx promoter in osteoblast lineage and investigated its bone phenotype as well as the regenerative potential of miR-335-5p-modified BMSCs to repair craniofacial bone defects.
Materials and Methods
Generation and identification of transgenic mice
A 319 bp fragment of genomic DNA containing miR-335-5p precursors with two XhoI restriction enzyme sites were amplified by PCR and subcloned downstream of the 2.0 kb osteoblast-specific Osterix promoter in a vector containing luciferase reporter gene. A 4.3 kb fragment containing Osx promoter (2.0 kb, a generous gift from Dr. Hicham Drissi at University of Connecticut Health Center, Farmington, CT),(25) miR-335-5p precursor, luciferase reporter gene and SV40 polyA signal was named as Osx-335/luc and released from the plasmid (pGL3-Osx-miR-335-5p-luc, Supplemental Figure S1) by digestion with two restriction enzymes KpnI and SalI. Then Osx-335/luc was separated by 1% agarose gel, and gel-purified using GENECLEAN® II Kit (MP Biomedicals, Santa Ana, CA, USA) according to the manufacturer's instructions. Transgene microinjection was performed shortly after fertilization of B6D2F1/J mouse eggs at the Tufts Transgenic Facility according to standard techniques (26). Founder mice and offspring were identified by Southern blot analysis and polymerase chain reaction (PCR) using mouse tail genomic DNA. For Southern blots, 10 μg of DNA from each mouse was digested with HindIII and Xba I separated on 1% agarose gel and hybridized by 32P-radiolabeled probe as described in the previous study (26). The probe was the PCR product resulting from amplification of the plasmid (pGL3-Osx-miR-335-5p-luc) with primers amplifying luciferase (Supplemental Table S2). After PCR amplification, the product was separated on 1% agarose gel, gel-purified and radiolabeled with 32P. PCR analysis was also performed to confirm the presence of the transgene using luciferase primers. The transgenic mice were then designated as Osx-335 Tg mice. Mice were maintained by mating Osx-335 Tg mice with Osx-335 Tg mice and identified by PCR. When characterizing the phenotype of this transgenic mouse line, their aged-matched wild-type littermates were used as controls. All the mice were used in accordance with recommendations from the Guide for the Care and Use of Laboratory Animals prepared by the Institute of Laboratory Animal Resources, National Research Council (Department of Health and Human Services Publication NIH 86-23, 1985) and by guidelines established by the Institutional Animal Care and Use Committee at Tufts University (Boston, MA). Mice were maintained under standardized conditions with a 12 h light/12 h dark cycle and were provided food (standard laboratory diet) and water ad libitum.
Tissue preparation
Osx-335 Tg mice and their wild-type littermates (WT) were sacrificed at the ages of 3 days, 2 weeks, 4 weeks and 8 weeks. Their calvaria and femurs were collected. The calvaria specimens were immediately frozen in liquid nitrogen and stored at -80°C for further analysis whereas the femurs were fixed in 4% paraformaldehyde, and dipped in 75% ethanol. After microCT analysis, the femurs were decalcified in 10% EDTA, embedded in paraffin and cut into 6 μm thick tissue sections. Soft tissues, such as lung, liver, kidney and brown adipose tissue, were isolated from mice, immediately frozen in liquid nitrogen and stored at -80°C for further analysis.
Micro-Computed Tomography (μCT) analysis
Trabecular bone distal from the growth plate were isolated from femurs of 4-week-old WT and Osx-335 Tg mice and scanned by μCT (Viva CT-40, SCANCO Medical, Bassersdorf, Switzerland) at 10.5 μm voxel resolution. One hundred and fifty μCT slices, corresponding to 1.575mm region distal from the growth plate, were acquired for analysis. Three-dimensional morphological parameters, including bone volume/tissue volume (BV/TV), trabecular number (Tb.N), trabecular thickness (Tb.Th) and trabecular separation (Tb.Sp) were recorded and calculated.
RNA isolation and RT-PCR analysis
Bone samples and soft tissues stored at -80°C after isolation were ground into a fine powder under liquid nitrogen using a mortar and pestle. Then TRIzol reagent (Life Technologies) was added. Total RNA including miRNA was prepared from tissues with modifications in the manufacturer's instructions, i.e., after phase separation, two volumes of 100% isopropanol were added to the aqueous phase, which was subsequently incubated at -20°C overnight for complete RNA precipitation. The interphase and organic phenol-chloroform phases were saved for further protein extraction. After RNA isolation, reverse transcription assay and quantitative real-time PCR (qRT-PCR) assays were performed respectively with M-MLV Reverse Transcriptase (Affymetrix, Santa Clara, California) and USB®VeriQuest™FastSYBR®GreenqPCR Master Mix with Fluorescein (2×) (Affymetrix) using a Bio-Rad iQ5 thermal cycler. For miRNA expression, poly (A) tailing, cDNA synthesis, and qRT-PCR assays were performed with NCode™ VIVO™ miRNA cDNA Synthesis Kit and EXPRESS SYBR® GreenER™ miRNA qRT-PCR Kits (Life Technologies) respectively according to the manufacturer's instructions. The mRNA expression levels of genes were calculated with the comparative cycle threshold method using GAPDH as a control; while the expression of miR-335-5p was calculated using U6 as a control. Primers used for PCR amplification are listed in Supplemental Table S2.
Western Blot Analysis
Tissue protein extracts were obtained from the interphase and organic phenol-chloroform phase according to the instructions of Trizol reagent. SDS-PAGE and Western blots were performed using Novex® 4-20% Tris-Glycine gels (Life Technologies) and 0.45μm polyvinylidene fluoride membranes (Millipore). Antibodies for Runx2 (1:1000), Osterix (1:1000), Satb2 (1:1000) and β-catenin (1:1000) were purchased from Santa Cruz Biotechnologies. Antibodies for β-actin (1:10000) and Dkk1 (1:400) were from Cell Signaling Technology (Danvers, Massachusetts) and Sigma-Aldrich respectively. The secondary antibodies were horseradish peroxidase-linked goat-anti-rabbit IgG (Santa Cruz Biotechnology, Inc.). Blots were visualized using SuperSignal® West Dura Extended Duration Substrate (Thermo Fisher Scientific, Waltham, Massachusetts).
Bone histomorphometry and Immunohistochemical staining
Femoral bone tissue sections were subjected to hematoxylin and eosin (H&E) staining and Tartrate-resistant acid phosphatase (TRAP) staining using Acid Phosphatase, Leukocyte (TRAP) kit (Sigma-Aldrich) according to the manufacturer's instructions. Digital images were taken with OLYMPUS BX53 microscope and analyzed by software. Bone histomorphometry was performed in the trabecular area of the femoral epiphyses as described previously (27). The percentage of bone surface covered by cuboidal osteoblast (Ob.S/BS, %) and the ratio of osteoblast number to bone surface (Ob.N/BS, N/mm) were obtained from H&E-stained sections at 400× magnification. The percentage of trabecular osteoclast surface to bone surface (Oc.S/BS, %) and the ratio of osteoclast number to bone surface (Oc.N/BS, N/mm) were obtained from the measurements of TRAP-stained sections at 200× magnification.
Immunohistochemical staining was performed using antibodies for luciferase (Luc, 1:200, Thermo Fisher Scientific, Waltham, MA USA), osteocalcin (OCN, 1:200, Santa Cruz Biotechnology, Inc, Dallas, Texas USA) and bone sialoprotein (BSP, 1:200, EMD Millipore, Billerica, MA USA) and AEC kits (Life Technologies, Frederick, MD, USA) according to the manufacturer's instructions. Digital images were taken at 100× magnification in the trabecular area of the femoral epiphyses. The cytoplasm of positive cells was stained red. The average integrated optical density of positive cells was analyzed by Image-Pro Plus software.
In vivo proliferation and differentiation assay of BMSCs
BMSCs were harvested from 6- to 8-week-old Osx-335 Tg mice and their WT littermates. The femora and tibiae were isolated immediately after euthanasia and the soft tissues were removed. Both ends of long bones were excised. DMEM was used to flush marrow from the shaft with a 27-gauge needle. A single cell suspension was obtained and cultured in non-differentiating maintenance media (DMEM supplemented with 20% fetal bovine serum (FBS, Life Technologies, Grand Island, New York), 100IU/ml penicillin and 100μg/ml streptomycin). (28)
BMSCs were seeded at 1×10⁴/well into 96-well culture plates and incubated at 37°C. The number of viable cells was determined by Cell Counting Kit-8 (CCK-8 assay) according to the manufacturer's instructions at 1, 2, 5, 8, 12 days.
To induce osteogenic differentiation, confluent BMSCs were cultured in osteogenic induction media (α-MEM supplemented with 10% FBS, 100IU/ml penicillin and 100μg/ml streptomycin, 10-8 M dexamethasone, 10-2M β-glycerophosphate and 50μg/ml L-ascorbic acid) for 7 and 14 days. To induce chondrogenesis, confluent cells were incubated in chondrogenic induction medium (high glucose DMEM supplemented with 10% FBS, 100IU/ml penicillin and 100μg/ml streptomycin, 10-8 M dexamethasone, 50μg/ml L-ascorbic acid and 10ng/ml transforming growth factor-β3 (TGF-β3, PeproTech) for 14 days. To induce adipogenesis, BMSCs were cultured in adipogenic induction media (α-MEM supplemented with 10% FBS, 100IU/ml penicillin and 100μg/ml streptomycin, 10-8 M dexamethasone and 6ng/ml insulin (SAFC Biosciences) for 14 days. Total RNA was then prepared from BMSCs cultures with TRIzol reagent. Reverse-transcription assay and qRT-PCR assay were performed. Whole protein lysates were prepared with RIPA lysis buffer (Santa Cruz Biotechnology, Inc.) according to the manufacturer's instructions and used to analyze protein expression by Western blot analysis.
In vitro alizarin red staining was performed essentially as previously described (29-30) after BMSCs were maintained in induced medium for 4 weeks. For quantification of mineralization, Alizarin Red-S was extracted with 10% cetylpyridinium chloride and assessed at 562 nm. Accumulation of chondroid-appearing, alcianophilic matrix was used as evidence of BMSC chondrogenic potential and assessed by Alcian blue staining. Intracellular accumulation of neutral lipids was used as an indicator of adipogenesis in vitro and detected by Oil Red staining as described (29).
Scaffold preparation, animal surgery, and analysis of newly formed bone
The silk fibroin scaffold (disk-shaped, 4mm diameter and 2mm thick) were prepared as described previously (31). BMSCs were isolated from 6-week-old WT and Osx-335 Tg mice respectively and cultured in non-differentiating maintenance media. After reaching confluence, the cells were harvested with trypsin/EDTA (0.25% w/v trypsin, 0.02% EDTA) and concentrated into 2×10⁷/mL cell suspensions. The cell suspensions were then seeded onto the scaffold and incubated overnight to enable BMSCs attachment to the scaffold before animal surgery.
Eight-week-old male C57BL/6J mice (body weight 25 ± 2 g) were randomly assigned to two groups. Under general anesthesia, 4 mm-diameter calvarial critical-sized defects were created on each side of the calvarial bone using a dental bur. The bone defects of the control group were repaired using scaffold with WT BMSCs, and the transgenic group was implanted with transgenic BMSCs. Mice were euthanized 12 weeks after surgery.
After euthanasia, the calvarial bones were harvested and fixed in 4% paraformaldehyde. Then the samples were dipped into 75% ethanol and assessed by μCT. Three-dimensional histomorphometric analysis was performed automatically and bone volume/tissue volume (BV/TV) was recorded.
After μCT analysis, the samples were decalcified in 10% EDTA, embedded in paraffin and cut into 6μm thick tissue sections. H&E staining was performed on tissue sections. Digital images were taken with OLYMPUS BX53 microscope. The newly formed bone was quantified in 3 sections of 5 different animals at 200× magnification using Image-Pro Plus software. The ratio of newly formed bone to the total area of the defect (BV/TV) was calculated. Additionally, immunohistochemical staining was performed with antibodies for osteocalcin. Digital images were taken and the average integrated optical density of OCN-positive cells was analyzed by Image-Pro Plus software as described above.
Statistical analysis
Results are shown as the mean ± SD. The expression levels of luciferase in different tissues of transgenic mice were analyzed by one-way ANOVA with Tukey posthoc test. Differences between the transgenic and WT mice were analyzed by t-test. Data were considered significant at p<0.05.
Results
Generation and identification of miR-335-5p transgenic mice
We generated a transgenic mouse line in which miR-335-5p was specifically over-expressed in the osteoblast lineage. After transgene microinjection, founders were identified by Southern blot analysis. One of the founders was then mated with wild-type B6D2F1/J mice and the offspring further evaluated by Southern blot and PCR assays to confirm integration of the Osx-335/luc chimeric gene into the mouse genome (Figure 1A and 1B).
Figure 1. Generation of miR-335-5p transgenic mice (Osx-335 Tg) by targeted over-expression of miR-335-5p in osteoblasts lineage.
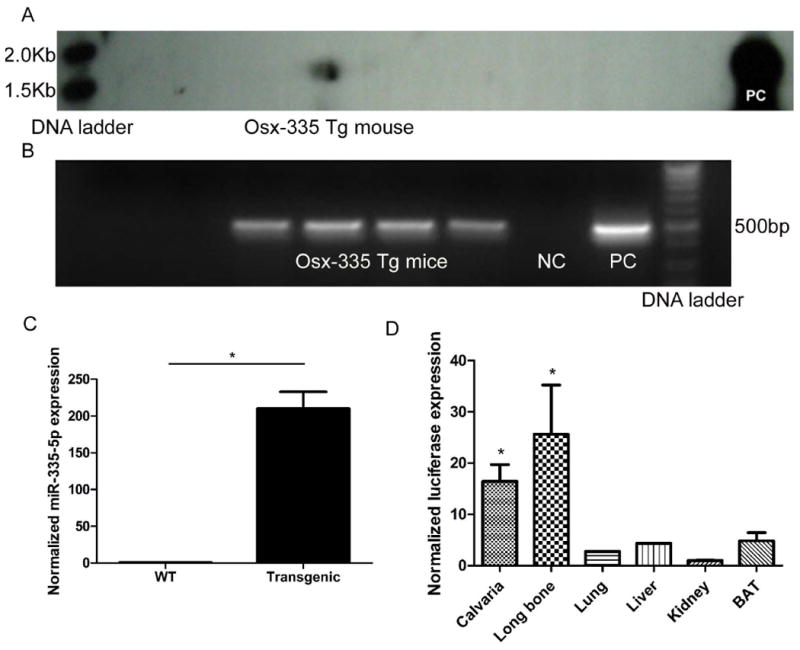
Southern blot analysis (A) and PCR assay (B) confirmed the integration of the Osx-335/luc chimeric gene into the mouse genome. NC: negative control; PC: positive control; (C) Normalized miR-335-5p expression was determined in bone tissues from transgenic mice and their WT littermates using qRT-PCR. miR-335-5p expression was normalized using U6 as a control (n=5 mice) ; (D) Normalized luciferase expression was evaluated in various tissues isolated from transgenic mice using qRT-PCR. GAPDH was used as a control (*: P<0.05, n=5 mice)
The expression level of miR-335-5p in calvaria from 8-week-old Osx-335 Tg mice was found to be significantly higher than that of WT mice (Figure 1C, P<0.05). Furthermore, soft tissues isolated from transgenic mice, such as lung, liver, kidney and brown adipose tissue, showed significantly lower luciferase expression that bone tissues (Figure 1D, P<0.05). Further immunohistochemical evaluation with an anti-luciferase antibody localized luciferase expression in osteoblasts, osteocytes and stromal cells in trabecular bone of transgenic mice. (Supplemental Figure S3).
Targeted over-expression of miR-335-5p in osteoblast lineage resulted in enhanced bone formation in mice
To evaluate the effects on bone metabolism in vivo, distal femur metaphyseal region of 4-week old Osx-335 Tg mice and WT littermates were subjected to μCT analysis. BV/TV (%), Tb.N (mm-1), Tb.Th (mm) parameters were significantly higher in transgenic mice than in WT mice trabecular bone. In contrast, Tb.Sp (mm) was lower in transgenic mice than in WT littermates (Figure 2B, P<0.05), suggesting that targeted over-expression of miR-335-5p in osteoblast lineage could lead to enhanced bone formation. Interestingly, we did not find significant differences between the cortical bone phenotypes of WT and Osx-335 Tg mice (data not shown).
Figure 2. Targeted over-expression of miR-335-5p in osteoblasts lineage resulted in enhanced bone formation in vivo.
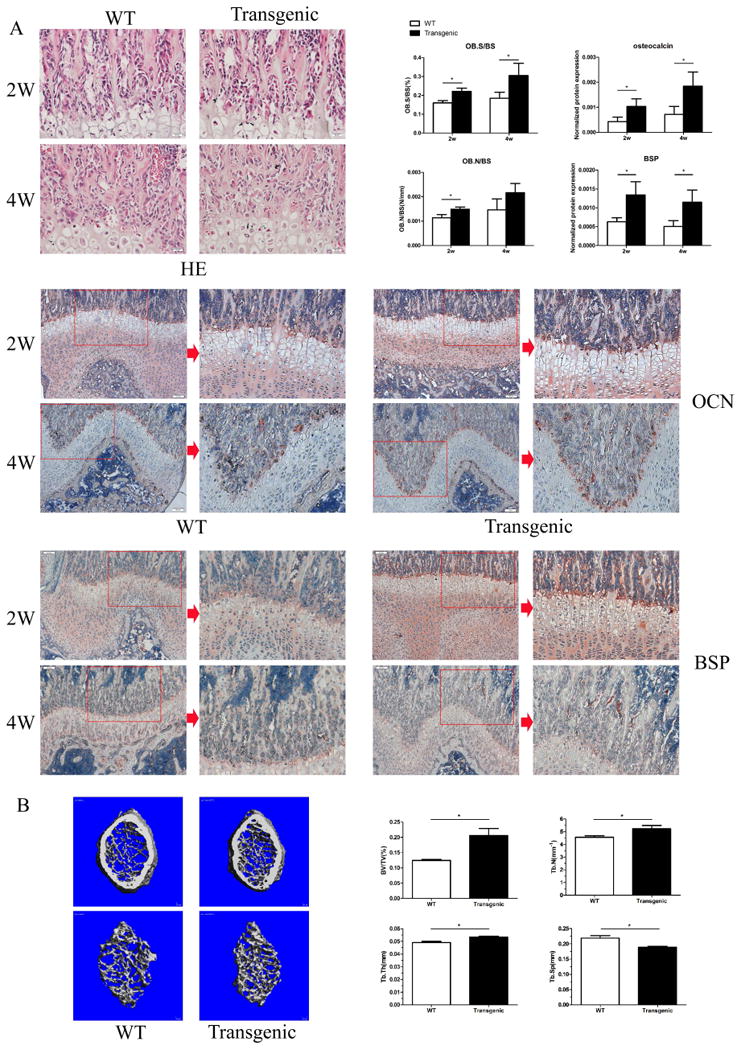
(A) Femoral tissue sections from 2-week-/4-week-old transgenic and WT mice, were subjected to hematoxylin and eosin (H&E) staining as well as immunohistochemical staining with OCN and BSP antibodies. Bone histomorphometry was analyzed after H&E staining (n=4 mice per age group). (B) The μCT analysis was conducted on the trabecular bone distal from the growth plate of femur and BV/TV, TB.N, TB.Th, TB.Sp was calculated (n=4 mice each group).
Bone histomorphometric analysis was then performed with femurs from 2-week- and 4-week-old mice, revealing higher percentage of bone surface covered by cuboidal osteoblast (Ob.S/BS, %) and ratio of osteoblast number to bone surface (Ob.N/BS, N/mm) in 2-week old Osx-335 Tg mice than in their WT littermates. Interestingly, at 4-weeks of age transgenic mice only displayed higher Ob.S/BS (Figure 2A, P<0.05) whereas the other parameters were not significantly different from those of WT littermates. TRAP staining of femoral bone specimens revealed that the percentage of bone surface covered by osteoclasts (OC.S/BS, %) and the ratio of osteoclast number to bone surface (OC.N/BS, N/mm) were not significantly different between transgenic and WT groups (data not shown).
Further, immunohistochemical staining revealed significantly higher expression of bone matrix proteins OCN and BSP in 2-week and 4-week-old transgenic mice than in WT littermates (Figure 2A, P<0.05).
The mRNA and protein expression levels of osteogenic markers were then evaluated in calvarial bone specimens isolated from mice at ages 3 days, 2 weeks and 4 weeks. qRT-PCR experiments revealed increased mRNA expression levels of Runx2, SATB2, BSP, ALP, and Col I in bones of transgenic mice as compared with those of WT littermates at all ages investigated (Figure 3A, P<0.05). Western blot analysis of protein samples isolated from 2-week-old mice demonstrated that the targeted over-expression of miR-335-5p in the osteoblast lineage in transgenic mice led to the downregulation of Dkk1 protein expression in bone. These results correlated with increased expression of β-catenin, the key component of the Wnt signal pathway, and that of osteogenic transcription factors Runx2, Osterix, and SATB2 in Osx-335 Tg mice as compared with wild-type littermates (Figure 3B, P<0.05).
Figure 3. Expression of osteogenic markers was increased in calvarial bone tissues from Osx-335 Tg mice.
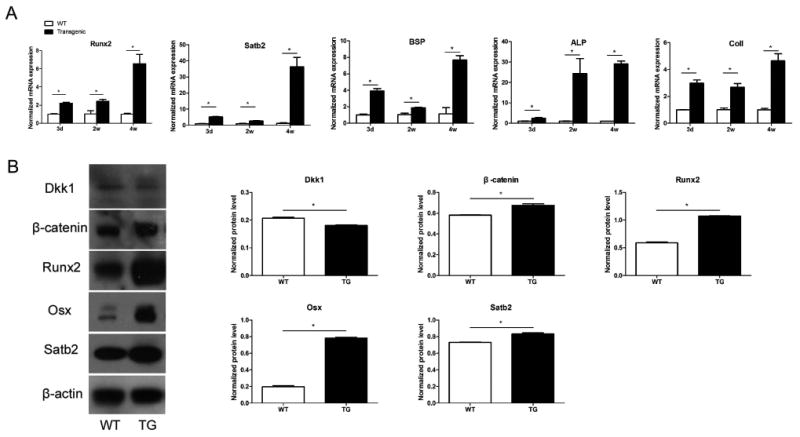
(A) Gene expression of Runx2, Satb2, ALP, BSP, Col I in calvarial bone tissues was analyzed using qRT-PCR (n=4 per age group). (B) Protein levels of DKK1, β-catenin, Runx2, Osx, Satb2 in calvarial bone tissues were evaluated by western blot analysis (*: P<0.05)
BMSCs from Osx-335 Tg mice exhibited decreased proliferation and enhanced osteogenic differentiation
Next, we compared the proliferative and differentiating potential of BMSC isolated from WT and Osx-335 Tg mice. BMSCs isolated from WT mice exhibited a faster growth than those isolated from Osx-335 Tg mice when cultured in non-differentiating maintenance media for up to 12 days (Supplemental Figure S4).
When osteogenic differentiation was induced for 7 and 14 days, mRNA expression levels of various osteogenic markers (Runx2, Satb2, ALP, BSP, OCN and Col) were found significantly higher in BMSCs cultures derived from transgenic mice than in those from WT mice (Figure 4A, P<0.05). Western blot analysis revealed Dkk1 protein levels were decreased whereas Runx2 and Osx expression were increased in BMSCs from transgenic mice (Figure 4B, P<0.05).
Figure 4. Osteogenic induction of BMSCs from transgenic mice led to increased expression of osteogenic markers and decreased DKK1 expression levels.
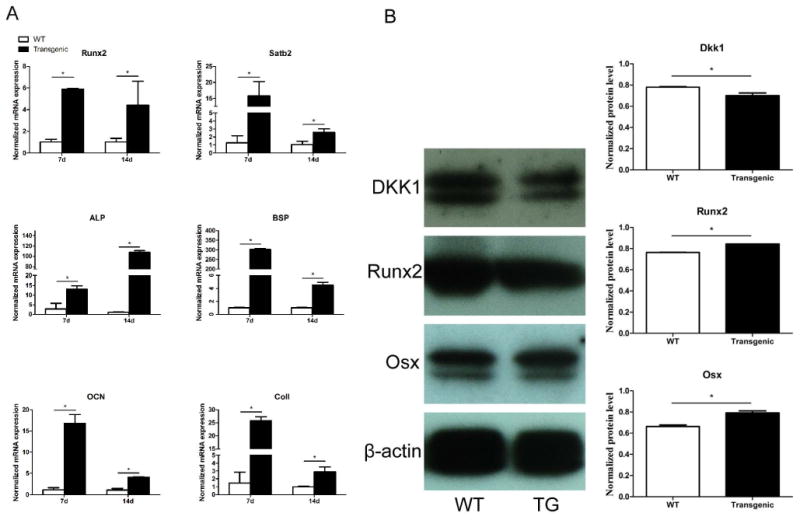
(A) Upon osteogenic induction for 7 and 14 days, qRT-PCR was used to evaluate the gene expression of osteogenic markers (Runx2, Satb2, ALP, BSP, OCN, and Col) in BMSCs from transgenic and WT mice. Expression levels were normalized using the expression of WT specimens at each time point. (B) After osteogenic induction for 14 days, the protein levels of DKK1, Runx2, and Osx in BMSCs from transgenic and WT mice were analyzed by western blotting. (*: P<0.05)
When BMSCs were induced to undergo adipogenesis, mRNA expression of PPAR-α and PPAR-γ differentiation markers were not significantly different between groups (Supplemental Figure S5). However, when BMSCs were induced to undergo chondrogenesis, Sox9 expression was significantly lower in cultures derived from transgenic mice than from the control mice (Supplemental Figure S5).
Compared with wild-type BMSCs, BMSCs cultures derived from transgenic mice showed more abundant mineralized nodules and had significantly higher Alizarin Red-S accumulation at week 4 (Supplemental Figure S6). In contrast, overexpression of miR-335p in BMSCs did not significantly promote chondrogenic or adipogenic lineage commitment (Supplemental Figure S7).
BMSCs from transgenic mice promote calvarial bone regeneration
We then compared the capacity of BMSCs from WT and transgenic mice to regenerate critical-sized defects (4mm in diameter) created on each side of the calvarial bone. According to μCT analysis, the ratio of BV to TV was significantly higher in defects repaired with transgenic BMSCs than in those treated with WT BMSCs (Figure 5A, P<0.05). Histological analysis of repaired defects revealed microRNA-modified BMSCs extensively filled the defect with new bone areas whereas WT BMSCs led to the formation of fibrous connective tissues and small new bone formation areas scattered across the defect. The ratio of newly formed bone to total defect area was significantly higher in the transgenic group that in the WT group (Figure 5B, P<0.05). Further immunohistochemical staining with an OCN antibody demonstrated higher OCN expression level in defects regenerated with transgenic BMSC as compared with WT BMSC (Figure 5C, P<0.05).
Figure 5. BMSCs from transgenic mice promote craniofacial bone regeneration.
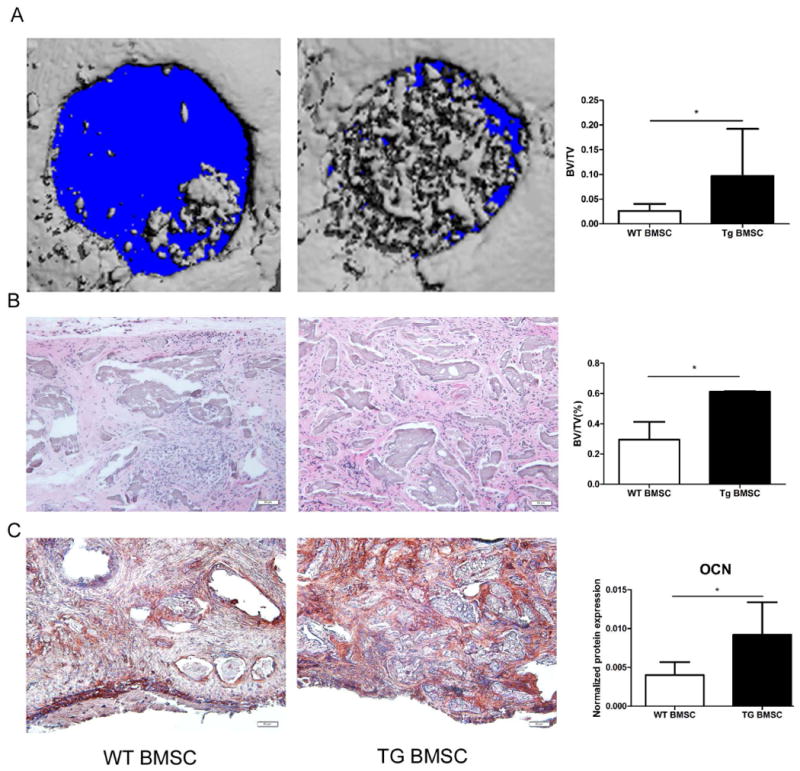
(A) μCT analysis of craniofacial bone defects treated with BMSCs from transgenic and WT mice (n=10 mice each group). (B) H&E staining and (C) Immunohistochemical staining for OCN of craniofacial bone defects. (*: P<0.05, n=5 mice each group).
Discussion
In this study, we investigated whether miR-335-5p could be used as a potential target to promote bone formation and regeneration in vivo by developing a transgenic mouse line, Osx-335 Tg, in which expression of miR-335-5p was targeted into the osteoblast lineage by a 2 kb Osx promoter. Consistent with the successful integration of the transgene, bones of transgenic mice contained an average of 200-fold higher miR-335-5p expression levels than bones from WT littermates. Fusing of the luciferase reporter gene to the miRNA sequence in the transgenic construct enabled us to track the exogenous miR-335-5p expression by determining the luciferase expression in different tissues of transgenic mice. Consistent with the specific over-expression of miR-335-5p in the osteoblast lineage, luciferase activity was barely detectable in soft tissue and greatly upregulated in calvaria and long bones. Furthermore immunohistochemistry analysis localized luciferase staining in cells of the osteoblast lineage in trabecular bone of transgenic mice.
We then evaluated the bone phenotype of 4-week old Osx-335 Tg mice and WT littermates by μCT analysis, and all parameters evaluated pointed to Osx-335 Tg mice having higher bone mass than WT mice. The increased bone mass induced by miR-335-5p overexpression appeared to result partly from higher activity of osteoblasts in Osx-335 Tg than in WT mice and not from reduced osteoclast numbers since bone histomorphometry unmasked higher OB.S/BS values in transgenic mice. Furthermore, TRAP-stainings indicated that the percentage of bone surface covered by osteoclasts (OC.S/BS, %) and the ratio of osteoclast number to bone surface (OC.N/BS, N/mm) were not significantly different between transgenic and WT mouse lines (data not shown). Consistent with increased osteoblast activity, osteogenic markers including Runx2, Osx, Satb2, ALP, BSP, and Col1 were found upregulated in transgenic mice bone samples in qRT-PCR and Western-blot experiments.
Since we previously found miR-335-5p promoted osteogenic differentiation in vitro by activating Wnt/β-catenin signaling pathway through DKK1 downregulation (22), we evaluated whether the protein level of DKK1 and β-catenin in bone tissues were impacted in a similar fashion in vivo. Consistent with our previous in vitro study, DKK1 protein expression was downregulated whereas β-catenin levels were increased in bones of transgenic mice as compared with those of WT mice. These results supported the notion that the high bone mass of Osx-335 Tg mice could be partly resulting from miR-335-5p promoting activation of Wnt/β-catenin signaling pathway through downregulation of its inhibitor DKK1. In agreement with our hypothesis mice heterozygous for DKK1 deletion were reported to display increased bone formation and a high bone mass phenotype (32).
The subtle regulation of Wnt/β-catenin signaling pathway has been shown to be critical for osteoblast differentiation and bone development. Hill et al. studied a mouse embryo with a stabilized form of β-catenin under the control of Prx1-Cre (6). The high β-catenin level at such early stage could prevent mesenchymal cells from entering the prechondro-osteoblast lineage, hence Wnt/β-catenin signal needs to be normally down-regulated at an early stage of differentiation of mesenchymal stem cells. Once the cells become prechondro-osteoblast precursors, high β-catenin level is needed to promote osteogenesis as well as prevent chondrogenesis, as demonstrated by the bone phenotype of mouse embryo in which β-catenin was conditionally depleted under the control of Dermol-Cre (5,33). At a late stage, down-regulation of Wnt/β-catenin signal was shown to be required again to ensure the terminal differentiation of osteoblasts (11). Rodda et al. generated a mouse line in which β-catenin activity was enhanced under the control of Osx. They observed extensive premature mineralization and lack of OCN expression in osteoblasts of mutant mice carrying a conditional β-catenin allele (8). We also used Osx promoter to drive miR-335-5p expression, but identified higher expression of both OCN and BSP in Osx-335 Tg mice than in WT mice. The difference between both studies may be attributed to the different molecular mechanism leading to β-catenin activation. In our study, β-catenin was activated indirectly through down-regulation of its inhibitor DKK1 by miR-335-5p.
To compare the differentiating potential of BMSC isolated from Osx-335 Tg mice and WT mice we first performed ex vivo studies in which cells were induced to differentiate into the osteogenic, chondrogenic and adipogenic lineages. We found osteogenic induction for 7 or 14 days increased expression of osteogenic markers (Runx2, Osx, Satb2, ALP, BSP, OCN, Col I) in the transgenic group, suggesting miR-335-5p-modified BMSCs could promote osteogenic differentiation. As opposed to our study, authors of a different publication reported that miR-335 inhibited human MSC (hMSC) adipogenic and osteogenic differentiation (23) by targeting Runx2 through a series of experiments conducted with hMSCs at early stages of differentiation. In a different study miR-335-5p promoted chondrogenesis and increased Sox9 expression in mouse MSCs during early stages of chondrogenic differentiation with miR-335-5p expression being regulated through two positive feedback loops (24). In addition to promoting osteogenic differentiation in our study, overexpression of miR-335-5p would be expected to inhibit chondrogenic differentiation of MSCs since we found Sox9 expression, a key regulator of chondrogenic differentiation, was decreased in transgenic BMSCs induced to undergo chondrogenesis ex vivo. While BMSCs from transgenic mice generated more abundant mineralized modules than cultures from WT littermates, their ability to induce adipocyte or chondrocyte formation was not significantly different. Because an individual miRNA can bind to and influence many mRNAs (33), it is plausible the different results in different studies can be attributed to overexpression of miRNA in different differentiation stages influencing different mRNAs pools. Since miR-335-5p modified BMSCs isolated from transgenic mice were under the control of the Osx promoter, which targets later stages of differentiation, it is plausible that miR-335-5p overexpression will lead to different effects during early and late differentiation stages. In our study miR-335-5p was specifically over-expressed in cells committed to the osteoblast lineage, whereas in Lin's study (24) miR-335-5p was over-expressed in uncommitted MSCs.
Targeting miRNAs is evolving as a promising therapeutic approach to treat certain diseases. Thus, inhibition of miR-25 was reported to improve cardiac contractility in the failing heart (34). To evaluate the therapeutic potential of miR-335-5p in bone regeneration, we used miR-335-5p-modified BMSC from transgenic and WT mice to repair craniofacial bone defects. Immunohistochemistry with OCN antibodies and μCT analysis revealed over a two-fold higher newly formed bone in defects treated with miRNA-modified BMSCs than with control cells.
In conclusion, our in vivo study using a new transgenic mouse line is the first demonstration of the ability of miR-335-5p to induce osteogenesis and bone formation in vivo. Our findings are also consistent with the ability of miRNA-modified BMSCs to regenerate craniofacial bone defects ex vivo. Although our results are very exciting, further experimentation will be needed to investigate whether miRNA-modified BMSCs could also regenerate long bones since miR-335-5p-modified BMSCs clearly promotes osteogenesis but the ability to impact chondrogenesis is not that clear. Another potential limitation of our study is that increased bone formation in our transgenic model cannot be generalized, and using a different promoter that overexpresses miR-335-5p during early stages of MSCs differentiation, might lead to different results since Wnt signaling is subjected to different regulation during early and late differentiation of MSCs. Despite these limitations, our study supports the therapeutic promise of miR-335-5p to promote osteogenic differentiation, bone formation and craniofacial regeneration in mice.
Supplementary Material
S1. pGL3-Osx-miR-335-5p-luc plasmid map. A 4.3 kb fragment containing Osx promoter, miR-335-5p precursor, luciferase reporter gene and SV40 polyA signal was named as Osx-335/luc and released from the plasmid by digestion with KpnI and SalI.
S2. Table S2. Primers used in PCR and qRT-PCR.
S3: Immunohistochemical evaluation of luciferase expression in femoral bones from WT and transgenic mice. Femoral bones from wild-type (WT) mice (left panel) and transgenic mice (right panel) were evaluated by immunohistochemistry with an anti-luciferase antibody. Luciferase staining (brown signals) was identified in osteoblasts and osteocytes in trabecular bone of transgenic mice. Photographs were taken at 200×.
S4. CCK-8 proliferation analysis of BMSC from WT and transgenic mice. BMSC isolated from WT and transgenic mice were cultured in non-differentiating, maintenance media for up to 12 days and CCK-8 proliferation analysis conducted on days 1, 2, 5, 8 and 12. The optical density was significantly higher in WT BMSC than in transgenic cultures (*: P<0.05)
S5. Gene expression analysis of BMSCs from transgenic and WT mice subjected to induction of either adipogenesis or chondrogenesis. Upon adipogenic induction, gene expression of (A) PPAR-alpha and (B) PPAR-gamma was evaluated in BMSCs cultures derived from transgenic and WT mice using qRT-PCR. (C) BMSCs from transgenic and WT mice were induced to undergo chondrogenic differentiation, and Sox9 expression analysis further determined by qRT-PCR. (*: P<0.05)
S6. Mineralization assays in BMSCs isolated from wild-type mice and transgenic mice. BMSCs were isolated from WT and transgenic mice and were grown in osteoblastic differentiation media for 4 weeks and stained with alizarin red-S. (A) Histochemical staining of mineralization nodules. (B) Quantification of mineralization. *, P<0.05.
S7. BMSCs from transgenic mice did not show increased chondrogenic or adipogenic potential. Transgenic BMSCs and wild-type BMSCs were cultured in chondrogenic induction medium (A) or adipogenic induction medium (B). (A) Alcian blue stainings were performed to demonstrate chondrogenic differentiation at 4 weeks. (B) Oil Red O staining was performed to demonstrate adipogenic differentiation at 4 weeks.
Acknowledgments
This work was supported by R01DE021464 and R01DE025681 through the National Institutes of Health and an Innovation in Oral Care Award through International Association for Dental Research and GlaxoSmithKline Consumer Healthcare, and an Award through International Team of Implantology to JC.
Footnotes
Disclosure Page: The authors state that they have no conflicts of interest.
Authors' Roles: L.Z., Q.T., Conception and design, collection and assembly of data, data analysis and interpretation, manuscript writing; Y.T., X.Z., L.S., Q.H., L.Y., S.M., L.Z., J.T., D.M., Provision of study material, collection and assembly of data; P.V., Data analysis and interpretation, manuscript writing; X.Z., H.D., M.M.D., Provision of study material, Data analysis and interpretation; J.C.: Conception and design, financial support, data analysis and interpretation, manuscript writing. All authors approved the final version of the manuscript.
References
- 1.Gong Y, Slee RB, Fukai N, et al. LDL receptor-related protein 5 (LRP5) affects bone accrual and eye development. Cell. 2001;107(4):513–23. doi: 10.1016/s0092-8674(01)00571-2. [DOI] [PubMed] [Google Scholar]
- 2.Kato M, Patel MS, Levasseur R, et al. Cbfa1-independent decrease in osteoblast proliferation, osteopenia, and persistent embryonic eye vascularization in mice deficient in Lrp5, a Wnt coreceptor. J Cell Biol. 2002;157(2):303–14. doi: 10.1083/jcb.200201089. [DOI] [PMC free article] [PubMed] [Google Scholar]
- 3.Boyden LM, Mao J, Belsky J, et al. High bone density due to a mutation in LDL-receptor-related protein 5. N Engl J Med. 2002;346(20):1513–21. doi: 10.1056/NEJMoa013444. [DOI] [PubMed] [Google Scholar]
- 4.Bennett CN, Longo KA, Wright WS, et al. Regulation of osteoblastogenesis and bone mass by Wnt10b. Proc Natl Acad Sci U S A. 2005;102(9):3324–9. doi: 10.1073/pnas.0408742102. [DOI] [PMC free article] [PubMed] [Google Scholar]
- 5.Day TF, Guo X, Garrett-Beal L, Yang Y. Wnt/beta-catenin signaling in mesenchymal progenitors controls osteoblast and chondrocyte differentiation during vertebrate skeletogenesis. Dev Cell. 2005;8(5):739–50. doi: 10.1016/j.devcel.2005.03.016. [DOI] [PubMed] [Google Scholar]
- 6.Hill TP, Spater D, Taketo MM, Birchmeier W, Hartmann C. Canonical Wnt/beta-catenin signaling prevents osteoblasts from differentiating into chondrocytes. Dev Cell. 2005;8(5):727–38. doi: 10.1016/j.devcel.2005.02.013. [DOI] [PubMed] [Google Scholar]
- 7.Gaur T, Lengner CJ, Hovhannisyan H, et al. Canonical WNT signaling promotes osteogenesis by directly stimulating Runx2 gene expression. J Biol Chem. 2005;280(39):33132–40. doi: 10.1074/jbc.M500608200. [DOI] [PubMed] [Google Scholar]
- 8.Rodda SJ, McMahon AP. Distinct roles for Hedgehog and canonical Wnt signaling in specification, differentiation and maintenance of osteoblast progenitors. Development. 2006;133(16):3231–44. doi: 10.1242/dev.02480. [DOI] [PubMed] [Google Scholar]
- 9.Rawadi G, Vayssiere B, Dunn F, Baron R, Roman-Roman S. BMP-2 controls alkaline phosphatase expression and osteoblast mineralization by a Wnt autocrine loop. J Bone Miner Res. 2003;18(10):1842–53. doi: 10.1359/jbmr.2003.18.10.1842. [DOI] [PubMed] [Google Scholar]
- 10.Zhang C, Cho K, Huang Y, et al. Inhibition of Wnt signaling by the osteoblast-specific transcription factor Osterix. Proc Natl Acad Sci U S A. 2008;105(19):6936–41. doi: 10.1073/pnas.0710831105. [DOI] [PMC free article] [PubMed] [Google Scholar]
- 11.van der Horst G, van der Werf SM, Farih-Sips H, van Bezooijen RL, Lowik CW, Karperien M. Downregulation of Wnt signaling by increased expression of Dickkopf-1 and -2 is a prerequisite for late-stage osteoblast differentiation of KS483 cells. J Bone Miner Res. 2005;20(10):1867–77. doi: 10.1359/JBMR.050614. [DOI] [PubMed] [Google Scholar]
- 12.Gaur T, Hussain S, Mudhasani R, et al. Dicer inactivation in osteoprogenitor cells compromises fetal survival and bone formation, while excision in differentiated osteoblasts increases bone mass in the adult mouse. Dev Biol. 2010;340(1):10–21. doi: 10.1016/j.ydbio.2010.01.008. [DOI] [PMC free article] [PubMed] [Google Scholar]
- 13.Bae Y, Yang T, Zeng HC, et al. miRNA-34c regulates Notch signaling during bone development. Hum Mol Genet. 2012;21(13):2991–3000. doi: 10.1093/hmg/dds129. [DOI] [PMC free article] [PubMed] [Google Scholar]
- 14.Eskildsen T, Taipaleenmaki H, Stenvang J, et al. MicroRNA-138 regulates osteogenic differentiation of human stromal (mesenchymal) stem cells in vivo. Proc Natl Acad Sci U S A. 2011;108(15):6139–44. doi: 10.1073/pnas.1016758108. [DOI] [PMC free article] [PubMed] [Google Scholar]
- 15.Inose H, Ochi H, Kimura A, et al. A microRNA regulatory mechanism of osteoblast differentiation. Proc Natl Acad Sci U S A. 2009;106(49):20794–9. doi: 10.1073/pnas.0909311106. [DOI] [PMC free article] [PubMed] [Google Scholar]
- 16.Kim KM, Park SJ, Jung SH, et al. miR-182 is a negative regulator of osteoblast proliferation, differentiation, and skeletogenesis through targeting FoxO1. J Bone Miner Res. 2012;27(8):1669–79. doi: 10.1002/jbmr.1604. [DOI] [PubMed] [Google Scholar]
- 17.Li H, X H, Liu W, Hu R, Huang B, Tan YF, Liao EY, Xu K, Sheng ZF, Zhou HD, Wu XP, Luo XH. A novel microRNA targeting HDAC5 regulates osteoblast differentiation in mice and contributes to primary osteoporosis in humans. The Journal of Clinical Investigation. 2009;119:3666–77. doi: 10.1172/JCI39832. [DOI] [PMC free article] [PubMed] [Google Scholar]
- 18.Li Z, Hassan MQ, Jafferji M, et al. Biological functions of miR-29b contribute to positive regulation of osteoblast differentiation. J Biol Chem. 2009;284(23):15676–84. doi: 10.1074/jbc.M809787200. [DOI] [PMC free article] [PubMed] [Google Scholar]
- 19.Glinka Andrei, W W, Delius Hajo, Monaghan A Paula, Blumenstock Claudia, Niehrs Christof. Dickkopf-1 is a member of a new family of secreted proteins and functions in head induction. Nature. 1998;391:357–62. doi: 10.1038/34848. [DOI] [PubMed] [Google Scholar]
- 20.MacDonald BT, Adamska M, Meisler MH. Hypomorphic expression of Dkk1 in the doubleridge mouse: dose dependence and compensatory interactions with Lrp6. Development. 2004;131(11):2543–52. doi: 10.1242/dev.01126. [DOI] [PubMed] [Google Scholar]
- 21.MacDonald BT, Joiner DM, Oyserman SM, et al. Bone mass is inversely proportional to Dkk1 levels in mice. Bone. 2007;41(3):331–9. doi: 10.1016/j.bone.2007.05.009. [DOI] [PMC free article] [PubMed] [Google Scholar]
- 22.Zhang J, Tu Q, Bonewald LF, et al. Effects of miR-335-5p in modulating osteogenic differentiation by specifically downregulating Wnt antagonist DKK1. J Bone Miner Res. 2011;26(8):1953–63. doi: 10.1002/jbmr.377. [DOI] [PMC free article] [PubMed] [Google Scholar]
- 23.Tome M, Lopez-Romero P, Albo C, et al. miR-335 orchestrates cell proliferation, migration and differentiation in human mesenchymal stem cells. Cell Death Differ. 2011;18(6):985–95. doi: 10.1038/cdd.2010.167. [DOI] [PMC free article] [PubMed] [Google Scholar]
- 24.Lin X, Wu L, Zhang Z, et al. MiR-335-5p Promotes Chondrogenesis in Mouse Mesenchymal Stem Cells and is Regulated Through Two Positive Feedback Loops. J Bone Miner Res. 2013 doi: 10.1002/jbmr.2163. [DOI] [PubMed] [Google Scholar]
- 25.Tu Q, Zhang J, Dong LQ, et al. Adiponectin inhibits osteoclastogenesis and bone resorption via APPL1-mediated suppression of Akt1. J Biol Chem. 2011;286(14):12542–53. doi: 10.1074/jbc.M110.152405. [DOI] [PMC free article] [PubMed] [Google Scholar]
- 26.Chen J, T H, Jin H, Jiang H, Sodek J. Expression of rat bone sialoprotein promoter in transgenic mice. Journal of bone and mineral research. 1996;11:654–64. doi: 10.1002/jbmr.5650110513. [DOI] [PubMed] [Google Scholar]
- 27.Valverde P, Zhang J, Fix A, et al. Overexpression of bone sialoprotein leads to an uncoupling of bone formation and bone resorption in mice. J Bone Miner Res. 2008;23(11):1775–88. doi: 10.1359/JBMR.080605. [DOI] [PMC free article] [PubMed] [Google Scholar]
- 28.Yu L, Tu Q, Han Q, et al. Adiponectin regulates bone marrow mesenchymal stem cell niche through a unique signal transduction pathway: an approach for treating bone disease in diabetes. Stem Cells. 2015;33(1):240–52. doi: 10.1002/stem.1844. [DOI] [PMC free article] [PubMed] [Google Scholar]
- 29.Tu Q, Valverde P, Chen J. Osterix enhances proliferation and osteogenic potential of bone marrow stromal cells. Biochem Biophys Res Commun. 2006;341(4):1257–65. doi: 10.1016/j.bbrc.2006.01.092. [DOI] [PMC free article] [PubMed] [Google Scholar]
- 30.Tu Q, Zhang J, Paz J, Wade K, Yang P, Chen J. Haploinsufficiency of Runx2 results in bone formation decrease and different BSP expression pattern changes in two transgenic mouse models. J Cell Physiol. 2008;217(1):40–7. doi: 10.1002/jcp.21472. [DOI] [PMC free article] [PubMed] [Google Scholar]
- 31.Ye JH, Xu YJ, Gao J, et al. Critical-size calvarial bone defects healing in a mouse model with silk scaffolds and SATB2-modified iPSCs. Biomaterials. 2011;32(22):5065–76. doi: 10.1016/j.biomaterials.2011.03.053. [DOI] [PMC free article] [PubMed] [Google Scholar]
- 32.Morvan F, Boulukos K, Clement-Lacroix P, et al. Deletion of a single allele of the Dkk1 gene leads to an increase in bone formation and bone mass. J Bone Miner Res. 2006;21(6):934–45. doi: 10.1359/jbmr.060311. [DOI] [PubMed] [Google Scholar]
- 33.Hu H, Hilton MJ, Tu X, Yu K, Ornitz DM, Long F. Sequential roles of Hedgehog and Wnt signaling in osteoblast development. Development. 2005;132(1):49–60. doi: 10.1242/dev.01564. [DOI] [PubMed] [Google Scholar]
- 34.Wahlquist C, Jeong D, Rojas-Munoz A, et al. Inhibition of miR-25 improves cardiac contractility in the failing heart. Nature. 2014;508(7497):531–5. doi: 10.1038/nature13073. [DOI] [PMC free article] [PubMed] [Google Scholar]
Associated Data
This section collects any data citations, data availability statements, or supplementary materials included in this article.
Supplementary Materials
S1. pGL3-Osx-miR-335-5p-luc plasmid map. A 4.3 kb fragment containing Osx promoter, miR-335-5p precursor, luciferase reporter gene and SV40 polyA signal was named as Osx-335/luc and released from the plasmid by digestion with KpnI and SalI.
S2. Table S2. Primers used in PCR and qRT-PCR.
S3: Immunohistochemical evaluation of luciferase expression in femoral bones from WT and transgenic mice. Femoral bones from wild-type (WT) mice (left panel) and transgenic mice (right panel) were evaluated by immunohistochemistry with an anti-luciferase antibody. Luciferase staining (brown signals) was identified in osteoblasts and osteocytes in trabecular bone of transgenic mice. Photographs were taken at 200×.
S4. CCK-8 proliferation analysis of BMSC from WT and transgenic mice. BMSC isolated from WT and transgenic mice were cultured in non-differentiating, maintenance media for up to 12 days and CCK-8 proliferation analysis conducted on days 1, 2, 5, 8 and 12. The optical density was significantly higher in WT BMSC than in transgenic cultures (*: P<0.05)
S5. Gene expression analysis of BMSCs from transgenic and WT mice subjected to induction of either adipogenesis or chondrogenesis. Upon adipogenic induction, gene expression of (A) PPAR-alpha and (B) PPAR-gamma was evaluated in BMSCs cultures derived from transgenic and WT mice using qRT-PCR. (C) BMSCs from transgenic and WT mice were induced to undergo chondrogenic differentiation, and Sox9 expression analysis further determined by qRT-PCR. (*: P<0.05)
S6. Mineralization assays in BMSCs isolated from wild-type mice and transgenic mice. BMSCs were isolated from WT and transgenic mice and were grown in osteoblastic differentiation media for 4 weeks and stained with alizarin red-S. (A) Histochemical staining of mineralization nodules. (B) Quantification of mineralization. *, P<0.05.
S7. BMSCs from transgenic mice did not show increased chondrogenic or adipogenic potential. Transgenic BMSCs and wild-type BMSCs were cultured in chondrogenic induction medium (A) or adipogenic induction medium (B). (A) Alcian blue stainings were performed to demonstrate chondrogenic differentiation at 4 weeks. (B) Oil Red O staining was performed to demonstrate adipogenic differentiation at 4 weeks.