

Abstract
Objective
We modeled the potential impact of novel male contraceptive methods on averting unintended pregnancies in the US, South Africa, and Nigeria.
Study Design
We used an established methodology for calculating the number of couple-years of protection (CYP) provided by a given contraceptive method mix. We compared a “current scenario” (reflecting current use of existing methods in each country) against “future scenarios,” (reflecting whether a male oral pill or a reversible vas occlusion was introduced) in order to estimate the impact on unintended pregnancies averted. Where possible, we based our assumptions on acceptability data from studies on uptake of novel male contraceptive methods.
Results
Assuming only 10% of interested men would take up a novel male method and that users would comprise both switchers (from existing methods) and brand new users of contraception, the model estimated that introducing the male pill or reversible vas occlusion would decrease unintended pregnancies by 3.5% to 5.2% in the US, by 3.2% to 5% in South Africa, and by 30.4% to 38% in Nigeria. Alternative model scenarios are presented assuming uptake as high as 15% and as low as 5% in each location. Model results were sensitive to assumptions regarding novel method uptake and proportion of switchers vs. new users.
Conclusion
Even under conservative assumptions, the introduction of a male pill or temporary vas occlusion could meaningfully contribute to averting unintended pregnancies in a variety of contexts, especially in settings where current use of contraception is low.
Keywords: male contraception, reversible vas occlusion, male pill, CYP, unintended pregnancy, mathematical model
1. Introduction
In 2012, an estimated 40% of pregnancies were unintended, totaling 85 million unintended pregnancies worldwide.[1] Unmet need for contraception (defined as the number of sexually-active, fecund people who wish to limit or postpone births, but are not currently using contraception) varies globally. In 2010, women’s unmet need was estimated at 5.9% in the US and 23.2% in Africa.[2] In three West African countries, estimates for wife-only unmet need (33 to 40%) tended to be greater than husband-only unmet need (15 to 23%). This latter figure represents a sizeable need and suggests that men could be an under-utilized entry point for contraceptive use in couples.[3]
Globally, both women’s and men’s preferences for family size are shrinking, but many exceed their desired family size.[4] Even in countries that tend towards pro-natalist attitudes, desired family size among men is decreasing.[5]
As women bear the physical responsibility of pregnancy and often an unequal share of child-rearing, it is critical that they have access to the existing variety of female-controlled, safe, effective, acceptable, and affordable contraceptive methods. Existing male-controlled methods are limited to condoms, withdrawal, and vasectomy, which are used by approximately 11.6%, 4.6%, and 10.8% of men in the US and by 2.4%, 1.3%, and 0% of men in sub-Saharan Africa, respectively.[6]
Clinical trials using actual products, such as gels or injectables, have assessed the acceptability of novel male contraceptive methods.[7–11] Surveys or qualitative studies have also assessed acceptability of hypothetical products described to participants.[12–14] Clinical trial data suggest certain novel male methods would be acceptable to some users. Of 38 men who completed a trial involving a topical testosterone gel and injection combination, 50% reported being “satisfied or very satisfied” with the regimen and 45% said they would use it if it were commercially available.[7] In a trial evaluating a testosterone injectable, 61% of the 44 participants who completed the 1-year exposure period rated the method as excellent or good and 79% indicated that they would use it if it were available.[10]
Hypothetical acceptability of male contraceptive pills or injections is high in some groups, but shows wide variability. Despite reported skepticism over factors such as safety and efficacy, in one study, hypothetical willingness to try a male pill ranged from 44% (men in Hong Kong) to 83% (White men in Cape Town); and willingness to try an injectable ranged from 32% (men in Edinburgh) to 62% (White men in Cape Town).[13] A survey including 9,000 men aged 18–50 from nine countries found that willingness to try a novel male hormonal contraceptive ranged from a low of 28.5% of men in Indonesia to a high of 71.4% of men in Spain, with daily oral dosing being the preferred route across all countries surveyed.[12] Willingness to use such methods in the US was estimated to be 49.3%. Features likely to impact the acceptability of novel male methods include efficacy, delivery route, timing of onset of effectiveness, side effects, requirements for use (i.e., semen analysis or regular clinic visits), reversibility, female partner perspectives, sociodemographic characteristics of the user, and expense.[12]
Studies have also assessed women’s attitudes towards use of a novel contraceptive method by their male partner.[14–17] In a survey of almost 2,000 women in Scotland, South Africa, and Shanghai, over 70% of participants would be willing to rely on their partner’s use of a hormonal male contraceptive and only 2% of the sample would not trust their partner to use it.[16] A study by Audu et al (2008) in Northeast Nigeria found 54% of 417 women would prefer a male partner to use contraception instead of themselves (though this likely pertained to current male methods).[15]
Given high unintended pregnancy rates and unmet need for contraception in many regions of the world, and promising acceptability data for novel male contraceptive methods, we sought to model the hypothetical impact on unintended pregnancy rates with the introduction of a new, effective, and reversible male contraceptive method.
2. Materials and Methods
We estimated the impact of an effective, reversible male contraceptive on unintended pregnancies averted in three diverse settings: the United States (relatively high contraceptive use, including substantial long-acting and permanent method use), South Africa (relatively high contraceptive use, particularly of injectables), and Nigeria (relatively low contraceptive use). We used Microsoft Excel to build a model comparing annual unintended pregnancies in a “current scenario,” (based on the current contraceptive method mix) against a “future scenario” in which one of two effective, reversible male contraceptive methods was introduced, either a pill, or a reversible vas occlusion procedure. We chose these two methods because many researchers around the world are working to develop various types of male contraceptive pills, and several researchers are working on different approaches to reversible vas occlusion.[18–22] While regulatory approvals are many years away, a male pill and/or a reversible vas occlusion procedure may become real options.
Estimation of unintended pregnancies averted was based on couple years of protection (CYP) calculations following the methodology published by MEASURE Evaluation [23] (see Appendix A for details). By multiplying the total CYP by the proportion of pregnancies that are unintended (0.288 per CYP in our model),[24] we estimated unintended pregnancies averted based on a given method mix. Perry et al (2016) used a similar approach to estimate the public health impact of increased vasectomy uptake in eight low-resource countries.[25] In that work, Perry et al. used National Demographic and Health Survey data from each of the target countries as well as contraceptive commodity cost estimates [26, 27] to calculate the cost per CYP of the nations’ current contraceptive method mix. The analysis then compared the cost effectiveness of the current method mix to a method mix that included a 5% increase in vasectomy use by the year 2020. Additionally, the analysis estimated the increase in the number of averted unintended pregnancies, maternal and infant deaths, unsafe abortions, and case-fatalities due to increase overall CYP of a method mix that included greater vasectomy use.
Table 1 presents the required modeling inputs to establish the “current” scenario, including number of current users (restricted to married or coupled, fecund women aged 15 to 49), current use of modern methods in each geography, annual discontinuation rates for users still in-need of contraception (i.e. trying to avoid pregnancy), and CYP conversion factors for each method (Appendix A). We based in-need discontinuation rates for Nigeria and South Africa on discontinuation rates from DHS data in Kenya, as no discontinuation data were available specific to these countries. The list of contraceptives considered is not exhaustive, but includes most commonly-used methods for which necessary data were available.
Table 1.
Current use, annual discontinuation rates, and CYP conversion factors for the US, South Africa, and Nigeria
| United States | South Africa | Nigeria | |||||
|---|---|---|---|---|---|---|---|
|
|
|||||||
| Women aged 15–49 in marriage or unions (2016)[33] | 37,901,000 | 5,027,000 | 29,284,000 | ||||
|
|
|||||||
| Proportion of infecund women | 15.5%[34] | 32%[35] | 31.3%[36] | ||||
|
|
|||||||
| Fecund women aged 15–49 in marriage or unions (calculated, used in model) | 31,402,735 | 3,418,360 | 20,324,208 | ||||
|
| |||||||
| Short-term methods | % Using [6] | Annual In-Need Discontinuation Rate[37]^ | % Using [6] | Annual In-Need Discontinuation Rate[38]+ ^ | % Using [6] | Annual In-Need Discontinuation Rate[38]+ ^ | Units per CYP[23] |
|
| |||||||
| Female pill | 16% | 0.400 | 11.6% | 0.367 | 2.1% | 0.367 | 15 |
|
| |||||||
| Male condom | 11.6% | 0.844 | 4.9% | 0.479 | 2.5% | 0.479 | 120 |
|
| |||||||
| Injectable | 0% | 0.580 | 30.3% | 0.262 | 3.8% | 0.262 | 4# |
|
| |||||||
| Long-term methods | CYP per procedure[23]~ | ||||||
|
| |||||||
| IUD | 5.1% | NA | 1.1% | NA | 1.3% | NA | 1 |
|
| |||||||
| Implant | 1% | NA | 0.2% | NA | 0.5% | NA | 1 |
|
| |||||||
| Female sterilization | 21.8% | NA | 15.3% | NA | 0.4% | NA | 1 |
|
| |||||||
| Vasectomy | 10.8% | NA | 0.7% | NA | 0% | NA | 1 |
Abbreviations: NA=not applicable; CYP=couple years of protection; IUD=intrauterine device
Based on Depo Provera
Based on in-need discontinuation rates from Kenya DHS data
Long-term methods conservatively assumed to provide only 1 year of protection given the one-year time horizon of the modeling exercise
In-need discontinuation refers to discontinuation occurring among women who continue to be in-need of contraception (i.e. sexually active and seeking to avoid pregnancy)
Calculating the future scenario CYP required data on use of existing and novel methods; discontinuation rates for novel male methods; and CYP conversion factors for novel male methods. We used corollaries from existing female contraceptive methods as proxies to determine discontinuation rates and CYP conversation factors for novel male methods. We assumed that the male pill would have the same discontinuation rate and CYP conversion factor as female pill. For all long-acting or permanent methods (LAPMs) (both existing and the hypothetical reversible vas occlusion method), the years of coverage provided by each method was assumed to be 1, given that our analyses were concerned with the impact on annual unintended pregnancy rates.
No existing corollary or historic uptake data were available as a proxy to estimate the number of novel male method users (or, for the purposes of the CYP methodology, the number of women likely covered by a novel male method). Thus, we estimated the uptake of novel male method users based in part on survey data [12, 13] from key geographies of interest.
Since only a subset of men who express willingness to try a novel method would likely do so, we conservatively assumed the annual number of users for both novel male methods in each country to be 10% of men who expressed a willingness to try one. In the US, 49.3% of men reported willingness to try a new form of male contraception (daily oral pill, monthly injectable, or annual implant).[12] In South Africa, willingness to use a male pill varied from 55% (Black men) to 83% (White men),[13] so we conservatively used the lowest figure (55%). Thus, the number of novel method users was estimated at 4.9% and 5.5% for the US and South Africa, respectively.
According to the 2013 Nigeria national DHS, only 16% of married women have an unmet need for contraception – 12% for spacing and 4% for limiting – despite a low prevalence of contraceptive use.[28] We chose a cap of 3.8% uptake for a novel male method because (a) no country-specific acceptability data were available for Nigeria, and (b) 3.8% is the level of the most-used existing method (female injectable). In the Nigeria analyses, we applied a cap to ensure the uptake of a novel male method did not exceed the current usage of the most prevalent existing method (injectables).
Table 2 presents inputs used in the “future scenarios,” in which the male pill or reversible vas occlusion is introduced. We assumed the projected number of novel male method users would be comprised of some “switchers” (currently covered by existing methods) and some “new users” (not currently using contraception). For each geographic area, switchers were determined based on the proportion of current reversible-method users (i.e. those who could discontinue their current method in favor of a new one), and new users were determined based on the proportion of those not currently using contraception. We proportionally drew switchers in each geographic area from the current users of all reversible methods, so there are slightly fewer users of reversible methods in the inputs for future scenarios (Appendix A).
Table 2.
Modeling inputs for future scenarios
| US % Using [6] |
South Africa % Using [6] |
Nigeria % Using [6] |
|||||||
|---|---|---|---|---|---|---|---|---|---|
| Short-term | |||||||||
| Female pill | 14.8% | 10.8% | 2% | ||||||
| Male condom | 10.8% | 4.6% | 2.4% | ||||||
| Injectable | 0% | 28.3% | 3.7% | ||||||
| Long-term | |||||||||
| IUD | 4.7% | 1% | 1.3% | ||||||
| Implant | 0.9% | 0.2% | 0.5% | ||||||
| Female sterilization | 21.8% | 15.3% | 0.4% | ||||||
| Vasectomy | 10.8% | 0.7% | 0% | ||||||
|
| |||||||||
| Novel male method | % Using | Annual In-Need Discontinuation Rate[37] | CYP conversion factor[23] | % Using | Annual In-Need Discontinuation Rate[38]+ | CYP conversion factor[23] | % Using | Annual In-Need Discontinuation Rate[38]+ | CYP conversion factor[23] |
|
| |||||||||
| Male pill | 0.400 | Units per CYP 15^ | 0.367 | Units per CYP 15^ | 0.367 | Units per CYP 15^ | |||
| Reversible vasectomy | 4.9%~ | NA | CYP per procedure 1.0& | 5.5%+ | NA | CYP per procedure 1.0& | 3.8%$ | NA | CYP per procedure 1.0& |
|
| |||||||||
| Totals for future scenarios | |||||||||
|
| |||||||||
| % switchers | 2.5% | 3.2% | 0.4% | ||||||
| % new users | 2.5% | 2.4% | 3.4% | ||||||
Note: % using all existing contraceptive options are reduced (compared to the “current scenario”) to reflect switching between existing and novel options.
Based on US data from Heinemann, 2005, assuming 10% of those willing to use male methods would become users
Based on South Africa data from Martin, 2000, assuming 10% of those willing to use male methods would become users
Capped at the maximum usage of a current method to maintain face validity
Assumed the same as the female pill (closest corollary)
Long-term methods conservatively assumed to provide only 1 year of protection given the one-year time horizon of the modeling exercise
3. Results
Our model suggests that introduction of the male pill or reversible vas occlusion would avert an additional 3.5% to 5.2% unintended pregnancies in the US, and 3.2% to 5% unintended pregnancies in South Africa, respectively (Table 3). In Nigeria, the estimates would be substantially higher, at 30.4% to 38% more unintended pregnancies averted for the two methods, respectively (Table 3). Such results compare favorably with the real-world decrease in unintended pregnancy rates of 2% achieved in Africa from 2008 to 2012.[1]
Table 3.
Main model results for current and new scenarios
| US | South Africa | Nigeria | |||||||
|---|---|---|---|---|---|---|---|---|---|
| Current Scenario | Male Pill Scenario | Reversible Vas Occlusion Scenario | Current Scenario | Male Pill Scenario | Reversible Vas Occlusion Scenario | Current Scenario | Male Pill Scenario | Reversible Vas Occlusion Scenario | |
| # of unintended pregnancies averted per year | 5,264,035 | 5,450,208 | 5,538,839 | 559,470 | 577,363 | 587,299 | 533,716 | 695,859 | 736,675 |
| % change from current scenario | 3.5% | 5.2% | 3.2% | 5% | 30.4% | 38% | |||
| Absolute change from current scenario | 186,173 | 274,804 | 17,893 | 27,829 | 162,143 | 202,959 | |||
Our model estimates that introducing reversible vas occlusion will avert more unintended pregnancies than a male pill in all countries, even when assuming that reversible vas occlusion would confer only one year of contraception. The differences in the current method mix of each country can largely explain the difference in magnitude of impact by country. In the US and South Africa, introduction of novel male methods would decrease unintended pregnancies, but impact would be mitigated by the high prevalence of other methods already in use. In Nigeria, where current use of contraception is very low, even a 3.8% uptake of a novel male contraceptive method could have a dramatic impact.
Model results were robust to variation in discontinuation rates but were more sensitive to assumptions around male method uptake (Table 4). However, even assuming that only 5% (instead of the model’s 10% assumption) of men who indicated interest in using a novel male method would actually adopt the method, the increase in unintended pregnancies averted still ranges from 1.6% to 2.6% in the US and South Africa, and between 22% to 27.5% in Nigeria. When assuming 15% of men who indicated interest would adopt a novel male method, results for the US and South Africa climb to 7.8% and 7.5%. If all users of novel male methods were assumed to be new users (instead of some new users and some switchers from other methods, as in our main model), more unintended pregnancies would be averted, ranging from a 6.7% increase in the US (male pill scenario) to a 41.7% increase in Nigeria (reversible vas occlusion scenario). Though these scenarios seem unlikely, they help to illustrate the potential upper bound of impact that novel male methods could provide.
Table 4.
Sensitivity analysis: projected change from current scenario in number of unintended pregnancies averted under alternative assumptions
| # | Parameter | Main Model | Alternative assumption | % change from current
scenario |
|||||
|---|---|---|---|---|---|---|---|---|---|
| US | South Africa | Nigeria | |||||||
|
| |||||||||
| Male Pill Scenario | Reversible Vas Occlusion Scenario | Male Pill Scenario | Reversible Vas Occlusion Scenario | Male Pill Scenario | Reversible Vas Occlusion Scenario | ||||
| 1 | In-need discontinuation rates | US: Trussell et al., 2011
[37] South Africa and Nigeria: Assumed to have the same discontinuation rates as observed in Kenya DHS survey data |
All discontinuation rates varied by +20% | 3.6% | 4.9% | 3.3% | 4.7% | 30.8% | 36.7% |
|
| |||||||||
| All discontinuation rates varied by −20% | 3.5% | 5.6% | 3.1% | 5.3% | 30% | 39.4% | |||
|
| |||||||||
| 2 | Proportion of “accepting” men projected to adopt a novel male method | 10% of accepting men
would use a novel male method US: 4.9% South Africa: 5.5% Nigeria: 3.8% (capped at current highest usage) |
5% of accepting men modeled to use
a novel male method US: 2.5% South Africa: 2.8% Nigeria: 2.8% |
1.8% | 2.6% | 1.6% | 2.5% | 22% | 27.5% |
|
| |||||||||
| 15% of accepting men modeled to use
a novel male method US: 7.4% South Africa: 8.3% Nigeria: 3.8% (capped at current highest usage) |
5.3% | 7.8% | 4.8% | 7.5% | 30.4% | 38% | |||
|
| |||||||||
| 3 | New users vs. switchers | Novel male method users comprised of both switchers and new users | Novel male method users comprised of new users only | 6.7% | 8.4% | 7.9% | 9.7% | 34% | 41.7% |
4. Discussion
To our knowledge, this is the first attempt to quantify the potential impact of novel male contraceptive methods on unintended pregnancy across countries. We used a standardized approach to calculate number of unintended pregnancies averted in each country. Where possible, we leveraged existing data for female methods (such as discontinuation rates and units per CYP), and used conservative assumptions for our main model, while exploring variation in sensitivity analyses.
Limitations of this analysis include the need to rely on assumptions (due to the hypothetical nature of the research question) and limitations of available data. Substantial uncertainty exists around hypothesized “uptake” of novel male contraception in each country. Data from acceptability studies conducted in 1995–6 and 2002, respectively, informed our assumptions, but this data may not reflect current attitudes. Furthermore, it remains unclear how precisely these studies can predict actual behavior with the contraceptive methods in our model. We assumed similar acceptability across methods, though real preferences may vary according to various factors described earlier [12] and by administration schedules and formulations.[13] Service delivery and cost coverage may also limit fulfilment of preferences and continuation of use. In a similar way women may be unable to access their preferred contraceptive due to lack of insurance, high co-pays, and/or a myriad of other political, structural, cultural and social barriers.[29, 30] Similarly, without data to inform an alternative approach, our model assumed that current users of reversible methods switch to using novel male methods in equal proportions, which may not reflect real-world nuances of method preference and switching behavior. For example, women may derive non-contraceptive benefits from their current hormonal method and may therefore switch to relying on a novel male method at different rates than, for instance, women who currently rely on male condoms. In the absence of concrete target product profiles, we assumed that novel male methods would have analogous efficacy and discontinuation profiles as current female-controlled options. Finally, our model captures the impact of novel male methods only among married or partnered women, for whom the necessary data on current contraceptive use was available, which likely underestimates the population of contraceptive users and potential impact on averting unintended pregnancies.
The CYP indicator itself was another limitation in our analysis. CYP does not capture the fact that a novel male method could prevent pregnancies in multiple partners per male user. Additionally, CYP indicators reflect the contraceptive effectiveness of a single contraceptive unit (e.g., oral pill packet, male condom, IDU, etc.). In our model, we rely on cross-sectional data to estimate contraceptive use for each method. We then estimate the number of units used in a given year by factoring in discontinuation of short-term methods (pills, condoms and injectables). However, we do not factor in potential discontinuation of long-term non-permanent methods (IUDs and implants) within a 12-month period. Our estimates assume that one long-term non-permanent method procedure contributed one CYP to the contraceptive effectiveness of the method mix. Discontinuation rates of long-acting methods range widely worldwide. A 2011 World Health Organization report suggested an all-cause, 12 month IUD discontinuation rate in fourteen developing countries to range from 9.6% to 37.3%.[31] Discontinuation of long-term non-permanent methods in our model would reduce their estimated contraceptive contribution. However, our model is not sensitive to potential switching that may occur within a year after discontinuation, which may mitigate any reduction in overall CYP of the method mix.
Furthermore, broader contraceptive choice for men may impact dual use of contraception. Dual use could increase, especially among individuals who continue to use condoms for disease prevention, or decrease as contraceptive options for men expand beyond condoms. The CYP indicator cannot capture the implications of such dynamics; a new statistical methodology may be required to fully capture the dynamics of a landscape including novel male methods. Other potential challenges relevant to the success of a novel male method that fall outside the scope of the current analysis include time, development costs, training needs, regulatory hurdles, and the lack of delivery systems that address the reproductive health needs of men. Additional investigations of these factors will be critical.
We intentionally narrow our discussion to the impact of a novel male method on unintended pregnancies averted; but funders and policy-makers must also consider potential ancillary benefits (i.e., increased male reproductive autonomy, potential decreased burden on women to shoulder contraceptive responsibility) and potential risks (potential condom displacement, or potential for reproductive coercion by men who falsely claim to be using male contraception). Additionally, some novel male-methods might require men and their partners to use alternative contraception until sperm counts fall sufficiently low. Other novel oral agents target sperm function or sperm transport rather than sperm production. These methods would not require sperm counts and their onset of action would be more rapid. Effective counseling can shape how men and their partners establish open communication about these risks and how to confirm that the method is working effectively if confirmation were required.
In conclusion, novel male methods could substantially reduce the number of unintended pregnancies in a variety of settings. Among women, research shows that making more methods available increases use.[32] The same may be true for men. The current analysis is limited due to data gaps and the dearth of statistical models capable of capturing male and female participation in contraception. These projections warrant additional research into (1) the potential role of male contraception; and (2) the development of new male contraceptives.
Implications.
Novel male contraceptives could play a meaningful role in averting unintended pregnancies in a variety of contexts. The potential impact is especially great in settings where current use of contraception is low and if novel methods can attract new contraceptive users.
Acknowledgments
Funding
The research was supported in part by infrastructure grants for population research from the Eunice Kennedy Shriver National Institute of Child Health and Human Development of the National Institutes of Health: P2C HD047879 (JT) and R24HD04284 (ARAA). The Male Contraception Initiative is supported in operational funding in part by DKT International.
Appendix A - Calculation of CYP
Overview of Approach
The estimated contraceptive potential offered by a specific contraceptive method mix directly informed our estimation of the number of unintended pregnancies averted in our models. To estimate the contraceptive potential of a population’s contraceptive method mix, we took into account estimated size of a population, the use prevalence of each contraceptive method (i.e., population-specific contraceptive prevalence rates [CPRs]) in that population’s method mix (with total population as the denominator), the estimated, annual, method-specific discontinuation rates, and the estimated couple-years of protection (CYP) provided by a single unit of effective contraception.
CYP provides an estimate of the contraceptive protection offered by a single unit of a given contraceptive method. For example, a single Depo Provera injection provides roughly three months or 0.25 years of contraceptive protection. Likewise, a single Implanon implant is estimated to provide a couple with 2.5 years of contraceptive protection.[23] A contraceptive method’s “CYP conversion factor” is the number, or fraction, of years of contraceptive protection offered by a single contraceptive unit.
We estimated the total CYP of a method mix by calculating the number of contraceptive units used by a population based on population size, population and method-specific contraceptive prevalence rates, and estimated discontinuation rates for short-term methods. We then multiplied the total number of units used annually by the method-specific CYP conversion factor. We then summed the CYP for each method to obtain a total CYP figure for the specific method mix. Then, we multiplied the total CYP of a method mix by the estimated number of unintended pregnancies averted per CYP[24] to estimate the total number of unintended pregnancies averted by the method mix.
Figure A.1 illustrates the calculations involved in estimating the cumulative CYP of a method mix.
Step-by-Step Calculations
Described below is a detailed description of the calculations used in our paper. Additionally, Table A.1 presents an example of the calculations (using US data) with equations explained in green font in the heading rows. For the purposes of our calculations, we defined the data inputs required as follows:
Total population of contraceptive users – The total number of married or in-union, fecund women aged 15–49
Contraceptive prevalence: This value represents the percent of married or in-union women in the total population using a given method of contraception. In the case of future scenarios, we proportionally drew the number of switchers to novel male contraceptive methods from the current users of all reversible methods. (See Equation A.1 and Assumptions section.) Note that “users” in all cases refers to the population of married or partnered, fecund women aged 15 to 49 years.
Annual in-need discontinuation rate: Short-term methods are subject to discontinuation throughout a given year. To account for this, the coverage provided by a give contraceptive method factors in the method-specific discontinuation rates. Discontinuation rates were selected to reflect only those who discontinued and remained in-need of contraception.
Annual continuation rate – Calculated as “1 – annual discontinuation rate”
-
CYP conversion factor
-
○
Units per CYP – For all short-acting modern methods, including pills, condoms, injectables, monthly rings/patches, and LAM the conversion factor represents the number of units (e.g. the number of 28-day pill packs or condoms) necessary to provide contraceptive coverage for a year.
-
○
CYP per procedure – For all long-acting methods, including IUDs, implantables, and sterilization, the conversion factor represents the number of years of contraceptive coverage provided by a single device or procedure. We assumed that CYPs per procedure for all long-acting or permanent methods to be 1 in light of the one-year time horizon of the current analysis.
-
○
Table A.1.
CYP Calculation Example for US Setting
| A | B | C | D | E | F | G | H | I | J | K | L |
|---|---|---|---|---|---|---|---|---|---|---|---|
| Short-term Method |
Total Population of Users [33] (fecund married or in union women 15 to 40) <Input> |
Contraceptive Prevalence [6] (married or in union women 15 to 49) <Input> |
Total Users Col B × Col C |
Annual Discontinuation Rate <Input> |
Annual Continuation Rate 1 − Col E |
Est. # of Units Used by Discontinuers Col D × Col E × (1/2) × Col I |
Est. # of Units Used by Continuers Col D × Col F × Col I |
Units
per CYP <Input> |
Method- specific CYP (Col G + Col H) × 1/Col I |
CYP
of Method Mix Total sum of Col J |
#
of Unintended Pregnancies Averted by Method Mix Col K × 0.288 |
| Female pill | 16% | 5,024,438 | 0.4 | 0.6 | 15,073,313 | 45,219,938 | 15 | 4,019,550 | |||
| Male condom | 11.6% | 3,642,717 | 0.844 | 0.156 | 184,467,202 | 68,191,667 | 120 | 2,105,491 | |||
| Injectable | 0% | – | 0.58 | 0.42 | – | – | 4 | – | |||
|
|
|
||||||||||
| Long-term Method | 31,402,735 | % of Users <Input> | Est. Total Number of New Users per year Col B × Col C | Annual Discontinuation Rate | Annual Continuation Rate | Est. # of Discontinuers | Est. # of Continuers | CYP per Procedure <Input> | Method-specific CYP Col D × Col I | 18,277,899 | 5,264,035 |
|
|
|
||||||||||
| IUD | 5.1% | 1,601,539 | 1 | 1,601,539 | |||||||
| Implant | 1% | 314,027 | 1 | 314,027 | |||||||
| Female sterilization | 21.8% | 6,845,796 | 1 | 6,845,796 | |||||||
| Vasectomy | 10.8% | 3,391,495 | 1 | 3,391,495 | |||||||
Equation A.1. Calculation of potential users of novel methods
Estimating Contraceptive Users by Method
We first estimated the number of individuals using each method of contraception. To do this, we multiplied the total number of married or in-union women by the method-specific contraceptive prevalence for married or in-union women (Figure A.1 and Table A.1, Column D).
CYP of Short-term Methods
To estimate the number of contraceptive units used by STM users in a given year, we multiplied the number of method-specific users by the method-specific discontinuation rates. We assumed “discontinuers”, on average, to use only half of the annual units of contraception; or, in other words, discontinuation would happen, on average, at the mid-year point (Figure A.1 and Table A.1, Column G). For example, a full year of coverage with Depo-Provera would constitute four injections, so discontinuers, on average, would receive only two injections in that time frame (see Assumptions section). We assumed that the remaining STM users (i.e. those who do not discontinue in a given year [“continuers”]) used all of the units necessary for a full year of protection (Figure A.1 and Table A.1, Column H).
We added total number of contraceptive units for discontinuers and continuers and multiplied the sum by the CYP conversion factor to estimate the method-specific CYP of each STM (Figure A.1 and Table A.1, Column J).
CYP of Long-acting and Permanent Methods
To estimate the CYP of long-acting and permanent methods (LAPM), we multiplied the number of each LAPM users by a method-specific CYP conversion factor (Figure A.1 and Table A.1, Column J). For the purposes of our calculations, which sought to quantify CYP within a one-year time period, we assumed that all CYP conversion factors for long-term methods would be equal to 1.0, the maximum amount of contraceptive coverage that can be conferred in a one-year time period (see Assumptions section).
Total CYP of Method Mix
The total CYP of a given method mix was estimated by summing the method-specific CYPs for all STMs and LAPMs (Figure A.1 and Table A.1, Column K).
Number of Unintended Pregnancies Averted by Method Mix
To estimate the number of unintended pregnancies averted by a given method mix, the total CYP of the method mix was multiplied by the estimated number of unintended pregnancies averted per CYP, a value of 0.288 based on a publication by Darroch and Singh (2011) [24] (Figure A.1).
Assumptions
Calculation of novel male method users: In future scenarios in which novel male methods have been introduced, the number of novel male method users were assumed to comprise a certain proportion of brand new users (i.e. those who were not currently using any modern method of contraception) and switchers (i.e. those who switched from their current modern method of contraception to a novel male method). We proportionally drew the number of switchers from the current numbers of users of reversible methods. This assumption implies that users of all current reversible methods would be equally as like to switch to a novel male method. This may not reflect reality, as numerous factors (including, but not limited to, mode of administration, hormonal vs. non-hormonal, beneficial side-effects, and considerations of cost and convenience) influence a user’s decision to continue or switch contraceptive methods. Therefore, it is unlikely that equal proportions of users from all current reversible methods would switch to a single novel male method. However, without better data to inform inputs and to avoid introducing additional assumptions, we made this simplifying assumption.
Discontinuation: We assumed that those who discontinue a short-term method in a given year to consume half the contraceptive units required to confer a year’s worth of coverage. In other words, we assumed that discontinuation would occur at the mid-way point in a given year. This assumed that discontinuations that occur early (after only a few months of use) and late (after nearly a year of use) in the year are evenly distributed.
CYP per procedure for long-acting/permanent methods: A single unit of a long-acting or permanent method (e.g. one IUD, one vasectomy procedure) can confer multiple years of contraceptive coverage. Because our aim was to estimate the number of unintended pregnancies averted by different method mixes in a one-year period, we assumed that all CYP conversion factors for long-term methods would be equal to 1.0, the maximum amount of contraceptive coverage that can be conferred in a one-year time period. This ensured that our calculations would not assign more than one year’s worth of contraceptive protection per contraceptive user.
Limitations
The CYP calculation methodology is limited in its ability to quantify the impact of male methods on unintended pregnancies averted, given that CYP calculations and CYP conversion factors only account for female physiology and fertility, without consideration of male physiology. In other words, even when considering male methods such as vasectomy in CYP calculations, such methods only account for the amount of protection they provide to the female partner. We are not aware of any existing methodology that takes into account the physiology of male fertility and have therefore continued to use the same convention for calculating CYP of novel male methods. In scenarios introducing novel male methods, the “number of users” of novel male methods is the number of women protected by their partner’s use of a novel male method.
The focus of our calculations on a one-year snapshot of CYP required that we assume that LAPMs confer at most one year of contraceptive protection. This fails to fully capture the potential impact of LAPMs on averting unintended pregnancies over a long-term basis.
Furthermore, the CYP indicator cannot capture the fact that a novel male method could prevent pregnancies in multiple partners per male user. Furthermore, with broader contraceptive choice for men, dual use of contraception may increase, especially among young, un-partnered individuals. A new statistical methodology may be required to fully capture the dynamics of such a landscape.
Figure A.1. Calculation of total couple years of protection for a method mix.
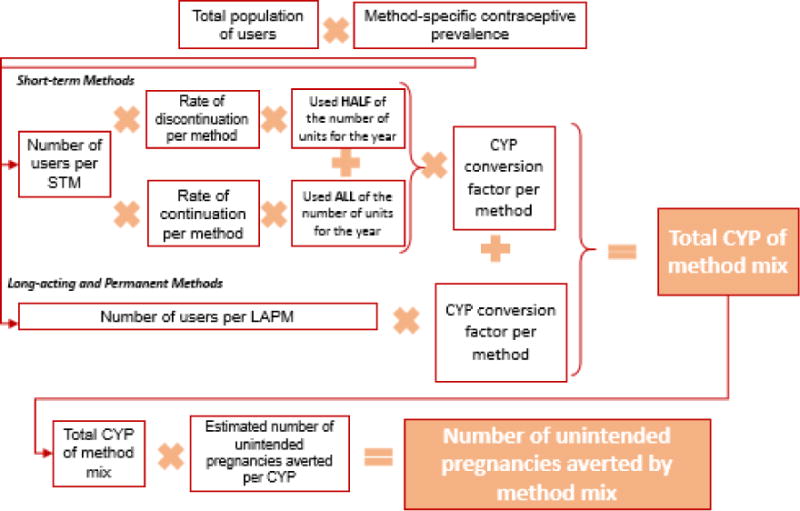
Abbreviations: STM=short-term method (includes all modern short-term contraceptive methods available), CYP=couple years of protection, LAPM=long-acting or permanent method
Footnotes
Publisher's Disclaimer: This is a PDF file of an unedited manuscript that has been accepted for publication. As a service to our customers we are providing this early version of the manuscript. The manuscript will undergo copyediting, typesetting, and review of the resulting proof before it is published in its final citable form. Please note that during the production process errors may be discovered which could affect the content, and all legal disclaimers that apply to the journal pertain.
References
- 1.Sedgh G, Singh S, Hussain R. Intended and Unintended Pregnancies Worldwide in 2012 and Recent Trends. Stud Fam Plann. 2014;45(3):301–314. doi: 10.1111/j.1728-4465.2014.00393.x. [DOI] [PMC free article] [PubMed] [Google Scholar]
- 2.Alkema L, Kantorova V, Menozzi C, Biddlecom A. National, regional, and global rates and trends in contraceptive prevalence and unmet need for family planning between 1990 and 2015: a systematic and comprehensive analysis. Lancet. 2013;381(9878):1642–1652. doi: 10.1016/S0140-6736(12)62204-1. [DOI] [PubMed] [Google Scholar]
- 3.Pearson E, Becker S. Couples’ Unmet Need for Family Planning in Three West African Countries. Stud Fam Plann. 2014;45(3):339–359. doi: 10.1111/j.1728-4465.2014.00395.x. [DOI] [PMC free article] [PubMed] [Google Scholar]
- 4.van Lith L, Yahner M, Bakamjian L. Women’s growing desire to limit births in sub-Saharan Africa: meeting the challenge. Glob Health Sci Pract. 2013;1(1):97–107. doi: 10.9745/GHSP-D-12-00036. [DOI] [PMC free article] [PubMed] [Google Scholar]
- 5.Westoff C, Bietsch K, Koffman D. (DHS Analytical Studies No. 34).Indicators of Trends in Fertility in SubSaharan Africa. 2013 [Google Scholar]
- 6.United Nations. Trends in Contraceptive Use Worldwide 2015. United Nations, Department of Economic and Social Affairs, Population Division; 2015. [Google Scholar]
- 7.Amory J, Page S, Anawalt B, Matsumoto A, Bremner W. Acceptability of a combination testosterone gel and depomedroxyprogesterone acetate male contraceptive regimen. Contraception. 2007;75(3):218–223. doi: 10.1016/j.contraception.2006.11.003. [DOI] [PubMed] [Google Scholar]
- 8.Ringheim K. Wither methods for men? Emerging gender issues in contraception. Reprod Health Matters. 1996;4(7):79. [Google Scholar]
- 9.Solomon H, Yount K, Mbizvo M. ‘A shot of his own’: The acceptability of a male hormonal contraceptive in Indonesia. Cult Health Sex. 2007;9(1):1–14. doi: 10.1080/13691050600902573. [DOI] [PubMed] [Google Scholar]
- 10.Meriggiola M, Cerpolini S, Bremner W, Mbizvo M, Vogelsong K, Martorana G, et al. Acceptability of an injectable male contraceptive regimen of norethisterone enanthate and testosterone undecanoate for men. Hum Reprod. 2006;21(8):2033–2040. doi: 10.1093/humrep/del094. [DOI] [PubMed] [Google Scholar]
- 11.Gu Y, Wang X, Xu D, Peng L, Cheng L, Huang M, et al. A multicenter contraceptive efficacy study of injectable testosterone undecanoate in healthy Chinese men. J Clin Endocrinol Metab. 2003;88(2):562–8. doi: 10.1210/jc.2002-020447. [DOI] [PubMed] [Google Scholar]
- 12.Heinemann K, Saad F, Wiesemes M, White S, Heinemann L. Attitudes toward male fertility control: results of a multinational survey on four continents. Hum Reprod. 2005;20(2):549–56. doi: 10.1093/humrep/deh574. [DOI] [PubMed] [Google Scholar]
- 13.Martin C, Anderson R, Cheng L, Ho P, van der Spuy Z, Smith K, et al. Potential impact of hormonal male contraception: cross-cultural implications for development of novel preparations. Hum Reprod. 2000;15(3):637–645. doi: 10.1093/humrep/15.3.637. [DOI] [PubMed] [Google Scholar]
- 14.Eberhardt J, van Wersch A, Meikle N. Attitudes towards the male contraceptive pill in men and women in casual and stable sexual relationships. J Fam Plann Reprod Health Care. 2009;35(3):161–165. doi: 10.1783/147118909788707986. [DOI] [PubMed] [Google Scholar]
- 15.Audu B, El-Nafaty A, Bako B, Melah G, Mairiga A, Kullima A. Attitude of Nigerian women to contraceptive use by men. J Obstet Gynaecol. 2008;28(6):621–5. doi: 10.1080/01443610802283530. [DOI] [PubMed] [Google Scholar]
- 16.Glasier A, Anakwe R, Everington D, Martin C, van der Spuy Z, Cheng L, et al. Would women trust their partner to use a male pill? Hum Reprod. 2000;15(3):646–649. doi: 10.1093/humrep/15.3.646. [DOI] [PubMed] [Google Scholar]
- 17.Campo-Engelstein L. Raging hormones, domestic incompetence, and contraceptive indifference: narratives contributing to the perception that women do not trust men to use contraception. Cult Health Sex. 2013;15(3):283–95. doi: 10.1080/13691058.2012.752106. [DOI] [PubMed] [Google Scholar]
- 18.Amory JK. Male contraception. Fertil Steril. 2016;106(6):1303–1309. doi: 10.1016/j.fertnstert.2016.08.036. [DOI] [PMC free article] [PubMed] [Google Scholar]
- 19.Colagross-Schouten A, Lemoy MJ, Keesler RI, Lissner E, VandeVoort CA. The contraceptive efficacy of intravas injection of Vasalgel for adult male rhesus monkeys. Basic Clin Androl. 2017;27:4. doi: 10.1186/s12610-017-0048-9. [DOI] [PMC free article] [PubMed] [Google Scholar]
- 20.Parsemus Foundation. Vasalgel, a multi-year contraceptive 2017. 2017 Jul 27; Available from: https://www.parsemus.org/projects/vasalgel/
- 21.Contraline. Contraline. Available from: http://contraline.com/
- 22.Male Contraceptive Initiative. Prospective Male Contraceptives. 2017 Jul 27; Available from: https://www.malecontraceptive.org/
- 23.The RESPOND Project. New Developments in the Calculation and Use of CYP and Their Implications for Evaluation of Family Planning Programs-Meeting Highlights. The RESPOND Project/EngenderHealth; New York: 2011. [Google Scholar]
- 24.Darroch J, Singh S. Estimating Unintended Pregnancies Averted from Couple-Years of Protection (CYP) Guttmacher Institute; 2001. [Google Scholar]
- 25.Perry B, Packer C, Chin-Quee D, Zan T, Shattuck D. Promoting Vasectomy Services in Kenya. FHI 360 and The Population Council, the Evidence Project; Durham, NC and Washington, DC: 2016. [Google Scholar]
- 26.Tumlinson K, Steiner MJ, Rademacher KH, Olawo A, Solomon M, Bratt J. The promise of affordable implants: is cost recovery possible in Kenya? Contraception. 2011;83(1):88–93. doi: 10.1016/j.contraception.2010.06.016. [DOI] [PubMed] [Google Scholar]
- 27.Rademacher KH, Solomon M, Brett T, Bratt JH, Pascual C, Njunguru J, et al. Expanding Access to a New, More Affordable Levonorgestrel Intrauterine System in Kenya: Service Delivery Costs Compared With Other Contraceptive Methods and Perspectives of Key Opinion Leaders. Glob Health Sci Pract. 2016;4(Suppl 2):S83–93. doi: 10.9745/GHSP-D-15-00327. [DOI] [PMC free article] [PubMed] [Google Scholar]
- 28.National Population Commission(NPC) [Nigeria] and ICF International. Nigeria Demographic and Health Survey 2013. NPC and ICF International; Abuja, Nigeria and Rockville, Maryland, USA: 2014. [Google Scholar]
- 29.Goyal V, Canfield C, Aiken ARA, Dermish A, Potter JE. Post-Abortion Contraceptive Use and Continuation when Long-Acting Reversible Contraception is Free. Obstet Gynecol. 2017;129(4):655–662. doi: 10.1097/AOG.0000000000001926. [DOI] [PMC free article] [PubMed] [Google Scholar]
- 30.Potter JE, Hopkins K, Aiken AR, Hubert C, Stevenson AJ, White K, et al. Unmet demand for highly effective postpartum contraception in Texas. Contraception. 2014;90(5):488–95. doi: 10.1016/j.contraception.2014.06.039. [DOI] [PMC free article] [PubMed] [Google Scholar]
- 31.Ali MM, Sadler RK, Cleland J, Ngo TD, Shah IH. Long-term contraceptive protection, discontinuation and switching behaviour: intrauterine device (IUD) use dynamics in 14 developing countries. World Health Organization and Marie Stopes International; London: 2001. [Google Scholar]
- 32.Ross J, Stover J. Use of modern contraception increases when more methods become available: analysis of evidence from 1982–2009. Glob Health Sci Pract. 2013;1(2):203–212. doi: 10.9745/GHSP-D-13-00010. [DOI] [PMC free article] [PubMed] [Google Scholar]
- 33.United Nations. Estimates and Projections of the Number of Women Aged 15–49 Who Are Married or in a Union: 2016 Revision. United Nations, Department of Economic and Social Affairs, Population Division; New York: 2016. [Google Scholar]
- 34.Thoma M, McLain A, Louis J, King R, Trumble A, Sundaram R, et al. Prevalence of infertility in the United States as estimated by the current duration approach and a traditional constructed approach. Fertil Steril. 2013;99(5):1324–1331. doi: 10.1016/j.fertnstert.2012.11.037. [DOI] [PMC free article] [PubMed] [Google Scholar]
- 35.Bello B, Kielkowski D, Heederik D, Wilson K. Time-to-pregnancy and pregnancy outcomes in a South African population. BMC Public Health. 2010;10:565. doi: 10.1186/1471-2458-10-565. [DOI] [PMC free article] [PubMed] [Google Scholar]
- 36.Polis CB, Cox CM, Tuncalp O, McLain AC, Thoma ME. Estimating infertility prevalence in low-to-middle-income countries: an application of a current duration approach to Demographic and Health Survey data. Hum Reprod. 2017:1–11. doi: 10.1093/humrep/dex025. [DOI] [PMC free article] [PubMed] [Google Scholar]
- 37.Trussell J, Guthrie K. Choosing a contraceptive: efficacy, safety, and personal considerations. In: Hatcher R, et al., editors. Contraceptive Technology: Twentieth Revised Edition. New York, NY: Ardent Media; 2011. pp. 45–74. [Google Scholar]
- 38.Bradley S, Schwandt H, Khan S. Levels, Trends, and Reasons for Contraceptive Discontinuation. ICF MAcro; Claverton, Maryland: 2009. (DHS Analytical Studies No. 20). [Google Scholar]