

Abstract
Reynolds shear stress (RSS) has served as a metric for the effect of turbulence on hemolysis. Forstrom (1969) and Sallam (1984) determined the RSS threshold for hemolysis to be 50,000 dyne/cm2 and 4,000 dyne/cm2, respectively, using a turbulent jet. Despite the order of magnitude discrepancy, Sallam’s threshold has been frequently cited for hemolytic potential in blood pumps. We recreated Sallam’s apparatus (SA) to resolve this discrepancy and provide additional data to be used in developing a more accurate hemolysis model. Hemolysis was measured over a large range of Reynolds numbers (Re) (Re=1,000 – 80,000). Washed bovine red blood cells (RBCs) were injected into the free jet of phosphate buffered saline, and hemolysis was quantified using a percent hemolysis, Hp=h (100-HCT)/Hb, where, h [mg/dl] is free hemoglobin and Hb [mg/dl] is total hemoglobin. RSS was calculated using two-dimensional laser Doppler velocimetry. RSS of ≥30,000 dyne/cm2 corresponding to Re of ≥60,000 appeared to cause hemolysis (p<0.05). This RSS is an order of magnitude greater than the RSS threshold that Sallam suggested, and it is similar to Forstrom’s RSS threshold. This study resolved a long-standing uncertainty regarding the critical values of RSS for hemolysis, and may provide a foundation for a more accurate hemolysis model.
Keywords: hemolysis, Reynolds Shear Stress, turbulence jet, laser doppler velocimetry, Kolmogorov scale
Introduction
Over the years there have been numerous studies that point to the significant contribution of turbulence on hemolysis.1–3 These studies focused on the Reynolds shear stress (RSS) as a metric for the effect of turbulence on hemolysis. However, there is poor agreement on the threshold RSS level for red blood cell (RBC) damage in turbulent flow with values of 2,500 to 50,000 dyne/cm2 reported.3–10 The RSS threshold levels of red blood cell damage at given exposure times from selected literature are shown in Table 1. Note that the threshold values vary by an order of magnitude, but exposure time is generally the same order of magnitude except for Sutera and Mehrjardi.6
Table 1.
Reynolds shear stress threshold reported by various studies.
| Author | RSS Threshold, ×103 | Exposure Time | Blood | Experiment Type | Stress Measurement | Year | |
|---|---|---|---|---|---|---|---|
| [dyne/cm2] | [sec] | ||||||
| Blackshear et al4 | 30 | – | Canine | Turbulent Jet |
|
1966 | |
| Forstrom5 | 50 | 10−6 | Human | Turbulent Jet |
|
1969 | |
| Sutera and Mehrjardi6 | 2.5 | 240 | Human | Concentric Cylinder Viscometer | Determined from direct measurements of torque | 1975 | |
| Sallam and Hwang7 | 4 | 10−5 | Human | Turbulent Jet | 1-D LDA | 1984 | |
| Tamagawa et al8 | 18 | 10−6 – 10−5 | Bovine | Pipe Orifice | Low Re k-ε model | 1996 | |
| Grigioni et al9 | 6 | – | Human | Re-evaluation of Sallam’s work | 3-D stress analysis | 1999 | |
| Lu et al10 | 8 | – | Human | Re-evaluation of Sallam’s work | 2 component LDA to determine major principle RSS | 2001 | |
| Yen et al3 | 5.17 | 10−5 | Porcine | Turbulent Jet | 2-D PIV | 2014 |
Blackshear4 and Forstrom5 used an equation, developed by Schlichting, that predicts RSS based upon mean jet exit velocity.11 They used different experimental constants (i.e., 0.03 and 0.017, see Stress Measurement in Table 1) likely due to the difference in fragility of human and canine erythrocytes.12 Using a turbulent jet with canine and human blood, Blackshear4 and Forstrom5 reported the hemolytic RSS threshold to be 30,000 dyne/cm2 and 50,000 dyne/cm2, respectively.
Sallam used one-dimensional (1D) laser Doppler anemometry (LDA) to determine RSS7 and determined the RSS threshold for hemolysis to be 4,000 dyne/cm2. It is of note, however, that 1D LDA has been shown to cause an underestimation due to experimental method and tensor-invariance.13 Grigioni et al9 and Lu et al10 both reevaluated Sallam’s RSS calculations without performing any hemolysis experiments. Grigioni et al9 also worked under the false belief that Sallam had used two-dimensional (2D) LDA as opposed to a single component LDA. Yen et al3 used 2D particle image velocimetry (PIV) to determine the RSS in a turbulent jet and showed a hemolytic RSS threshold of 5,170 dyne/cm2.
Despite the threshold values varying by an order of magnitude, Sallam’s threshold of 4,000 dyne/cm2 has been cited most frequently in the evaluation of hemolytic potential in blood pumps14–16 and prosthetic blood-contacting mechanical devices.9,17,18 Note that Sallam elaborated on explaining the earlier discrepancy on a RSS threshold level especially emphasizing Forstrom’s5 and Blackshear’s4 potential overestimation in their RSS levels for hemolysis.19
Hemolysis in Blood Pumps
The recently published 7th annual report of the Interagency Registry for Mechanically Assisted Circulatory Support (INTERMACS) showed that, although the overall adverse events are significantly lower in the most recent era (2012 – 2014), increasing event rates were observed for hemolysis, stroke, renal dysfunction, and respiratory failure, with hemolysis being the second of those four increasing adverse events.20 While the effect of turbulent flow on the physical mechanism of hemolysis still remains unanswered, understanding the precise range of hemolytic RSS as an initial stage to develop a better hemolysis model is crucial.
The goal of this study is to resolve the discrepancy of the threshold RSS level for RBC damage in turbulent flow and provide additional data to be used in developing a more accurate hemolysis model. This work also evaluates the relationship between RSS and hemolysis as a continuous function, as the term threshold value is poorly defined.21
Materials and Methods
Sallam Apparatus (SA)
A recreated version of the SA, shown in Figure 1, was used to carry out the hemolysis experiments over a large range of Re, as shown in Table 2. The Re is defined as follows:
| (1) |
where Ue is the jet exit velocity, de is the jet exit diameter (3 mm), and ν is the kinematic viscosity of the fluid. The fixture has dimensions of 51 mm × 51 mm × 254 mm and is made from acrylic and stainless steel. The jet entrance, where phosphate buffered saline (PBS) enters the fixture, has a diameter of 3 mm. A beveled 17G needle is used for the infusion of washed bovine RBCs into the fixture. An aspirator with a 1mm diameter opening is used to collect samples at a non-dimensional downstream distance of x/de=6.5 and y/re=1.2, where re is the jet exit radius (1.5 mm). Two syringe pumps were used to maintain constant flow rates for blood infusion (Harvard Apparatus, Holliston, MA) and sample collection (New Era Pump Systems, Inc., Farmingdale, NY). Sallam’s original design was modified for these experiments by the addition of a support beam for the aspirator, which was necessary to eliminate vibration and movement at high Re. In addition, a hydrophone was added on the top surface of the chamber in order to monitor the presence of cavitation in the jet.
Figure 1.

(A) SA experimental setup. (B) a schematic representation of SA chamber with jet exit nozzle, Ⓐ, blood injection needle, Ⓑ, and sample aspirator, Ⓒ. (C) Blood entering the free jet with the aspirator at a non-dimensional downstream distance of x/de=6.5 and radial distance of y/re=1.2 (a dotted box), where de is the jet exit diameter (3 mm) and re is the jet exit radius (1.5 mm). No RBCs or fluid are recirculated in this one-pass system.
Table 2.
In vitro SA submerged free jet testing conditions (jet exit diameter, de = 3 mm).
| Condition | Re (×103) | Ue [m/s] |
|---|---|---|
| 1 | 1 | 0.33 |
| 2 | 1.5 | 0.50 |
| 3 | 2 | 0.67 |
| 4 | 5 | 1.67 |
| 5 | 20 | 6.67 |
| 6 | 32 | 10.67 |
| 7 | 40 | 13.33 |
| 8 | 50 | 16.67 |
| 9 | 60 | 20.00 |
| 10 | 70 | 23.33 |
| 11 | 80 | 26.67 |
| 12 | 90 | 30.00 |
| 13 | 100 | 33.33 |
| 14 | 110 | 36.67 |
| 15 | 117 | 39.00 |
Blood Sample Preparation
Whole bovine blood was collected by LAMPIRE Biological Laboratories (LAMPIRE Biological Laboratories, Inc., Pipersville, PA) in CPDA-1 collection bags, and delivered overnight in a freezer-packet cold box. An additional 1.5 mL of Heparin (10,000 USP units/mL) and 1 mL of Tobramycin (40 mg/mL) were added to each unit of blood to ensure no clotting during testing. Washed RBCs were obtained by centrifuging the whole blood at 1,000 × g for 10 minutes and replacing the plasma with PBS. Washed bovine RBCs were resuspended in PBS to achieve a hematocrit of 50%. All blood samples were used within two days after the date of harvest.
Hemolysis Methods
At each given Re, washed RBCs resuspended in PBS were injected into the free jet of PBS through a beveled 17G needle at a flow rate of 54 mL/min. Once blood began to enter the chamber, 10 mL of waste was drawn over 10 seconds, followed by 20 mL of sample drawn over 3.5 seconds.
Lysed Sample Collection
Samples were collected through an aspirator located at x/de=6.5, y/re=1.2 at a rate of 60 mL/min. The sampling location of x/de=6.5, y/re=1.2, which is believed to be a peak hemolytic location, was selected based on the study of Sallam and Hwang.7 A hydrophone and high speed video detected cavitation at Re = 80,000, however, the pressure was raised to 2.37 atm and the cavitation signal disappeared. Either a stainless steel Dayton gear pump (W. W. Grainger, Inc., Lake Forest, IL) or a plastic centrifugal pump (MD-70RZ(T), Iwaki America, Holliston, MA) was used to circulate PBS through the flow loop connecting a 40L tank with the fixture.
Measure of Hemolysis
The free and total hemoglobin analysis was performed using Harboe’s spectrophotometric technique.22 For free hemoglobin measure, the 2 mL tubes were centrifuged for 10 minutes at 1,000 × g. For each experiment, four 300 μL samples were placed in a 96 well plate for analysis. Initial samples were further diluted by adding an equal amount of PBS to the samples. For total hemoglobin determination, 0.5 mL of sample was added to 2 mL of deionized water. The mixture then sat for at least 10 minutes followed by centrifugation at 1,500 × g for 30 minutes to separate out cell membranes. After centrifugation, 100 μL of sample was added to 15 mL PBS. Free hemoglobin and total hemoglobin were measured using a spectrophotometer (BioTek Instruments, Inc., Winooski, VT) and characterized using Harboe’s equation shown in Eq. (2):
| (2) |
where A380, A415, and A450 are the light absorbance at wavelengths of 380 nm, 415 nm, and 450 nm, respectively.22 To measure hematocrit on each sample of 50 μL, an automated hematology analyzer (Sysmex KX-21N, Sysmex America, Inc., Lincolnshire, IL) employing a dynamic focusing (DC) detection method was used to measure hematocrit. Finally, hemolysis was quantified using a percent hemolysis parameter, Hp shown in Eq. (3):
| (3) |
where h [mg/dl] is free hemoglobin in suspending medium, HCT [%] is hematocrit, and Hb [mg/dl] is the total concentration of hemoglobin when all RBCs in the sample have been lysed.23
Statistical Analysis
All values reported in the table and plotted in the figures are expressed as mean ± standard deviation. Statistical significance was assessed using the Student’s t-test. Significance level was set as p<0.05.
Laser Doppler Velocimetry (LDV)
We manufactured an acrylic model of the SA for use in LDV experiments to determine the Reynolds normal and shear stresses. Since it is known that the measure of a non-dimensionalized RSS is constant over Re (i.e., RSS for the jet is linearly dependent on Re), LDV data for the Reynolds stresses was collected only at Re = 20,000.7,10 Specifics of the LDV system can be found in Taylor et al.24
Experimental Conditions
A fluid composed of 37% H2O/63% NaI by weight was used to match the refractive index of acrylic (n = 1.49). The fluid had a kinematic viscosity (ν) of 1.45 cSt at 25°C and a density of 1891 kg/m3. A heat exchanger was used in the flow loop to ensure the fluid remained at 25°C for the duration of the experiment, and a centrifugal pump (Cole-Parmer, Vernon Hills, IL) was used to produce a steady flow rate of 4.1 L/min. This yielded an average nozzle exit velocity (Ue) of 9.67 m/s and a nozzle Re of 20,000.
Data Collection
Despite examining the hemolysis only at x/de = 6.5 and y/re = 1.2, we mapped the entire flow field in our LDV experiment for a rigorous comparison to Sallam’s study. As illustrated in Figure 2, coincident axial and radial velocities were collected at 7 downstream locations, i.e., x/de = 1, 2, 3, 4.5, 5.5, 6.5, and 8.5. Coincidence was established using a 100% gate scale setting. At each downstream location, velocity data were collected at 14 radial locations, starting at the center of the jet and moving radially, i.e., y/re from 0 to 1.73 in increments of 0.2 mm (i.e., y = 0 – 2.6 mm). The probe volume was an ellipsoid with major and minor axes of 275 and 35 μm, respectively, with the minor axes in the axial and radial directions. Ten thousand 2D velocity measurements were made at each spatial location.
Figure 2.

Schematics of LDV sampling locations: there are 14 radial locations (y/re) at each axial location (x/de).
Data Filtering
The LDV data was filtered following the procedure of Baldwin et al13 with an in-house MATLAB code, using an elliptical filter of 4 standard deviations to remove outliers from the data set. A value of four standard deviations was chosen as this value removed approximately 1% of the data set.
Reynolds Shear Stress (RSS)
A custom MATLAB code with 2D LDV data was used to calculate RSS and principal RSS at x/de = 6.5, y/re = 1.2. Note that the Reynolds shear stresses are not invariant to coordinate rotation, thus, it is important to calculate the principal RSS, which is potentially greater than those calculated in the coordinate system used for this experiment. Briefly, the velocity fluctuations u′ and v′ are defined as the deviations of instantaneous velocities u and v, respectively, from their average values as shown in Eqs. (4) and (5).
| (4) |
| (5) |
The RSS and principal RSS shown in Eq. (6) and Eq. (7), respectively, were normalized by Ue2, and fluid density, ρ, which is the same procedure that Sallam used,
| (6) |
| (7) |
where, is Reynolds shear stress and and are Reynolds normal stresses, calculated using Eqs. (8) – (10).
| (8) |
| (9) |
| (10) |
Results
Hemolysis Results for SA
Hemolysis results are shown in Table 3. The Hp calculated with the results shown in Table 3 over Re is also shown in Figure 3. Based on the data presented in Figure 3, hemolysis in the SA was not obvious at Re of up to 50,000, however, the inception of hemolysis appeared at Re = 60,000 (p = 0.004) and increased exponentially with Re in our experimental conditions.
Table 3.
Hemolysis results over Re for SA.
| Re | h [mg/dl] | Hb [g/dl] | HCT [%] | No. of Samples |
|---|---|---|---|---|
| 1,000 | 0.879±0.261 | 0.199±0.043 | 0.460±0.117 | 10 |
| 1,500 | 0.805±0.169 | 0.203±0.051 | 0.500±0.125 | 10 |
| 2,000 | 0.920±0.218 | 0.227±0.028 | 0.550±0.085 | 10 |
| 5,000 | 0.909±0.198 | 0.202±0.021 | 0.630±0.067 | 10 |
| 20,000 | 0.703±0.730 | 0.145±0.087 | 0.434±0.254 | 44 |
| 32,000 | 0.211±0.072 | 0.068±0.021 | 0.211±0.070 | 27 |
| 40,000 | 0.619±0.632 | 0.116±0.066 | 0.357±0.198 | 30 |
| 50,000 | 0.181±0.060 | 0.050±0.016 | 0.167±0.055 | 27 |
| 60,000 | 0.272±0.223 | 0.039±0.009 | 0.127±0.052 | 30 |
| 70,000 | 0.424±0.231 | 0.034±0.012 | 0.113±0.034 | 16 |
| 80,000 | 0.228±0.164 | 0.026±0.006 | 0.097±0.018 | 30 |
| 90,000 | 0.315±0.153 | 0.022±0.007 | 0.100±0.000 | 20 |
| 100,000 | 0.304±0.123 | 0.018±0.004 | 0.097±0.017 | 34 |
| 110,000 | 0.465±0.158 | 0.018±0.006 | 0.090±0.031 | 20 |
| 117,000 | 0.661±0.179 | 0.015±0.003 | 0.096±0.020 | 24 |
Figure 3.

Hemolysis over Re ranging from 1,000 – 117,000 for the SA. The shaded area represents the incipient hemolysis starting from Re = 60,000 (* p < 0.05).
RSS from LDV
The entire map of normalized principal RSS (i.e., RSSmax) and RSS at x/de from 1 – 8.5 and y/re from 0 – 1.73 for Re = 20,000 is shown in Figure 4. From the LDV, the maximum normalized value of principal RSS and RSS at x/de = 6.5, y/re = 1.2 were found as 96 and 75, respectively, and these can be converted into 4,270 dyne/cm2 and 3,336 dyne/cm2 with a given density of 1,000 kg/m3 and jet exit velocity of 6.67 m/s at Re = 20,000 used in our hemolysis testing. While understanding the principal RSS (or RSSmax) being greater than RSS by 30%, we used the normalized RSS value of 75 to calculate the RSS values for rest of the Re conditions shown in Table 2. The RSS over Re is shown in Figure 5.
Figure 4.

(A) Normalized principal Reynolds shear stress (RSSmax) and (B) Normalized Reynolds shear stress (RSS) at Re = 20,000 calculated from the 2D LDV data. The normalized RSSmax and RSS at x/de = 6.5, y/re = 1.2 were 96 and 75, respectively, and these correspond to 4,270 dyne/cm2 and 3,330 dyne/cm2, respectively.
Figure 5.
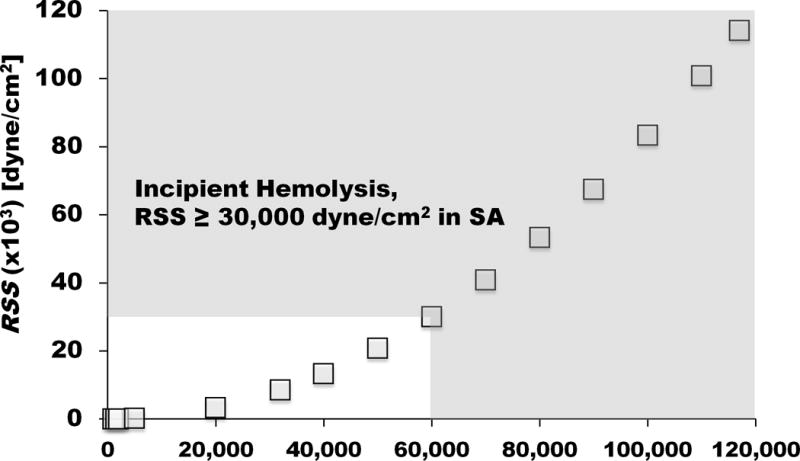
The RSS values over Re ranging from 1,000 – 117,000 were calculated based on the 2D LDV at Re = 20,000. The shaded area represents the range of RSS causing hemolysis in the SA.
Based on the results shown in Figure 3 and Figure 5, it should be reasonable to conclude that the inception of hemolysis occurs at RSS equal to or greater than 30,000 dyne/cm2. The inception of hemolysis and RSS can be represented as shown in Figure 6. In our study, hemolysis was not apparent at RSS less than 30,000 dyne/cm2, however, once the RSS passed 30,000 dyne/cm2, hemolysis increased in a nonlinear fashion with increasing RSS.
Figure 6.

Hemolysis increases in a nonlinear fashion with RSS. A threshold RSS was not apparent from our study. The shaded area represents the inception of hemolysis. Hemolysis was not apparent at RSS less than 30,000 dyne/cm2, however, once RSS passed 30,000 dyne/cm2, hemolysis increased in a nonlinear fashion with increase in RSS (*p < 0.05)
Discussion
We recreated Sallam’s turbulence jet apparatus to investigate the hemolytic RSS values. In our study, a RSS of 30,000 dyne/cm2 was found to be hemolytic, which is an order of magnitude greater than the threshold value of 4,000 dyne/cm2 reported by Sallam.7
Other groups have tried to resolve the discrepancy on the hemolytic RSS values. Grigioni et al9 applied 3D stress analysis to Sallam’s original 1D LDA measurements and found that the principal RSS causing the inception of hemolysis should be at least 6,000 dyne/cm2. Lu et al10 reinvestigated Sallam’s study by using 2D LDA under similar conditions and found, based on the principal RSS, that the hemolytic threshold should actually be greater than 8,000 dyne/cm2. Note that no blood testing was involved in the studies of Grigioni et al9 and Lu et al10, and they never provided a definitive number for “threshold” RSS values.
Yen et al3 suggested a hemolytic RSS threshold of 5,170 dyne/cm2 from their in-vitro study with the porcine blood. However, the spatial resolution of 190 μm with 1000 frames of the particle image velocimetry (PIV) may not be sufficient to capture the smaller turbulent eddies in the flow fields that might have played an important role in causing hemolysis. Liu et al25 concluded that the smallest turbulent length scale - which offers a more reliable estimate of the effects of turbulence on blood cell damage - was three times the size of a red blood cell (i.e., ~30 μm) and five times the size of platelets. It is known that when the Reynolds number is sufficiently high, the Kolmogorov (smallest) scale eddies can be roughly the size of the red blood cell (RBC) and blood damage is possible.26 For this study, we characterized the fluctuating flow fields by using a LDV system with an ellipsoidal probe volume with major and minor axes of 275 μm and 35 μm, respectively. Having radial resolution of 35 μm is considered to be much more accurate in capturing small eddies, if not the smallest, affecting blood cell damages. Ten thousand 2D velocity measurements were made at each spatial location, yielding a higher accuracy in measuring RSS values.
It is interesting to note from the study of Lu et al10 that they found the normalized maximum RSS and principal normalized RSS of 75 and 93, respectively, at x/de = 6, y/re = 1.2 that are similar to what we found at x/de = 6.5, y/re = 1.2 in our study (Figure 4). They found no significant effects on the flow field characteristics including the principal RSS from their three different Reynolds numbers. This confirms that our RSS values derived by using the normalized RSS of 75 (or RSSmax of 96) at Re = 20,000 for other Re conditions should be acceptable.
Note that washed RBCs resuspended in PBS were injected into the free jet of PBS. According to Kameneva et al27 and Sumpelmann et al28, the fragility of RBCs increases approximately by 3 – 4 times when RBCs are suspended in saline as opposed to plasma, thus, the critical value of RSS found in the present study may increase by the same factor if it were suspended in plasma. Nevertheless, an order of magnitude underestimation of the critical RSS suggested by Sallam7 is still noticeable from this comparative study.
Remarks on Reynolds Stress
In fact, Reynolds stress (often used interchangeably with turbulence stress) is not a physical stress3 and only results from the use of the of the Re-averaged Navier-Stokes (RANS) equation.29,30 Under certain conditions there is a correlation between hemolysis and RSS but that correlation does not imply causation. Taskin et al31 demonstrated that hemolysis index measurements and predictions over different flow rate conditions with different sets of power law constants showed up to two order of magnitude differences in a custom hemolyzer and up to three order of magnitude differences in the CentriMag pump. Along with Ozturk et al32, there is strong evidence that the Kolmogorov scale eddies and the attendant dissipation are a better measure of the effects of turbulence on hemolysis and should be included in any advanced model of hemolysis.3,33,34 We are currently testing our recently developed physics-based hemolysis model by employing the energy dissipation.
Study Limitations and Future Study
Note that the present study used bovine RBCs and Sallam7 used human RBCs. Jikuya et al35 found that the mechanical fragility of bovine and ovine RBCs was 0.5 and 1.8 times as large as human RBCs, respectively. Thus, the RSS threshold that the present study found may be lesser with human RBCs at given conditions, but it is not an order of magnitude difference. We used the centrifugation that Sallam used for a fair comparison, however, the centrifugation used in Ziegler et al36, for example, may affect the RSS threshold found in the present study. Note that this study used only one peak location (i.e., x/de = 6.5, y/re = 1.2) for assessing hemolysis due to turbulence. A second point somewhere else within the turbulent jet is warranted for further validation of the study.
Summary
This study investigated the threshold of 4,000 dyne/cm2 for hemolytic RSS suggested by Sallam and Hwang7 by characterizing the flow fields under a wide range of Reynolds numbers. In our study, a RSS of 30,000 dyne/cm2 was found to be hemolytic, which is an order of magnitude greater than the RSS threshold of 4,000 dyne/cm2 reported by Sallam.7 The RSS threshold found in our study is consistent with the values reported by Blackshear4 and Forstrom5 of 30,000 dyne/cm2 and 50,000 dyne/cm2, respectively. Since the estimation of the critical value of mechanical destruction on RBC damage in terms of both shear stress and exposure time is central, understanding the definite hemolytic RSS value should be an important step in the study of hemolysis. Our experimental results are significant because they have resolved a long-standing discrepancy regarding the critical values of RSS for hemolysis, and may provide a foundation for a more accurate hemolysis model.
Footnotes
Disclosures: None
References
- 1.Baldwin JT, Deutsch S, Geselowitz DB, Tarbell JM. LDA measurements of mean velocity and Reynolds stress fields within an artificial heart ventricle. J Biomech Eng. 1994;116(2):190–200. doi: 10.1115/1.2895719. [DOI] [PubMed] [Google Scholar]
- 2.Antiga L, Steinman DA. Rethinking turbulence in blood. Biorheology. 2009;46(2):77–81. doi: 10.3233/BIR-2009-0538. doi: 21373313756676J7 [pii] 10.3233/BIR-2009-0538. [DOI] [PubMed] [Google Scholar]
- 3.Yen JH, Chen SF, Chern MK, Lu PC. The effect of turbulent viscous shear stress on red blood cell hemolysis. J Artif Organs. 2014;17(2):178–85. doi: 10.1007/s10047-014-0755-3. [DOI] [PubMed] [Google Scholar]
- 4.Blackshear PL, Jr, Dorman FD, Steinbach JH, Maybach EJ, Singh A, Collingham RE. Shear, wall interaction and hemolysis. Trans Am Soc Artif Intern Organs. 1966;12:113–20. [PubMed] [Google Scholar]
- 5.Forstrom RJ. A New Measure of Erythrocyte Membrane Strength - The Jet Fragility Test. Minneapolis: University of Minnesota; 1969. [Google Scholar]
- 6.Sutera SP, Mehrjardi MH. Deformation and fragmentation of human red blood cells in turbulent shear flow. Biophysical journal. 1975;15(1):1–10. doi: 10.1016/S0006-3495(75)85787-0. doi: S0006-3495(75)85787-0 [pii] 10.1016/S0006-3495(75)85787-0. [DOI] [PMC free article] [PubMed] [Google Scholar]
- 7.Sallam AM, Hwang NH. Human red blood cell hemolysis in a turbulent shear flow: contribution of Reynolds shear stresses. Biorheology. 1984;21(6):783–97. doi: 10.3233/bir-1984-21605. [DOI] [PubMed] [Google Scholar]
- 8.Tamagawa M, Akamatsu T, Saitoh K. Prediction of hemolysis in turbulent shear orifice flow. Artificial organs. 1996;20(6):553–9. [PubMed] [Google Scholar]
- 9.Grigioni M, Daniele C, D’Avenio G, Barbaro V. A discussion on the threshold limit for hemolysis related to Reynolds shear stress. Journal of biomechanics. 1999;32(10):1107–12. doi: 10.1016/s0021-9290(99)00063-9. doi: S0021929099000639 [pii] [DOI] [PubMed] [Google Scholar]
- 10.Lu PC, Lai HC, Liu JS. A reevaluation and discussion on the threshold limit for hemolysis in a turbulent shear flow. Journal of biomechanics. 2001;34(10):1361–4. doi: 10.1016/s0021-9290(01)00084-7. doi: S0021929001000847 [pii] [DOI] [PubMed] [Google Scholar]
- 11.Schlichting H, Gersten K. Boundary-layer theory. Berlin; New York: Springer; 2000. 8th rev and enl ed ed. [Google Scholar]
- 12.Matsuzawa T, Ikarashi Y. Haemolysis of various mammalian erythrocytes in sodium chloride, glucose and phosphate-buffer solutions. Lab Anim. 1979;13(4):329–31. doi: 10.1258/002367779780943297. [DOI] [PubMed] [Google Scholar]
- 13.Baldwin JT, Deutsch S, Petrie HL, Tarbell JM. Determination of principal reynolds stresses in pulsatile flows after elliptical filtering of discrete velocity measurements. Journal of biomechanical engineering. 1993;115(4A):396–403. doi: 10.1115/1.2895503. [DOI] [PubMed] [Google Scholar]
- 14.Untaroiu A, Wood HG, Allaire PE, et al. Computational design and experimental testing of a novel axial flow LVAD. ASAIO J. 2005;51(6):702–10. doi: 10.1097/01.mat.0000186126.21106.27. doi: 00002480-200511000-00019 -00019 [pii] [DOI] [PubMed] [Google Scholar]
- 15.Deutsch S, Tarbell JM, Manning KB, Rosenberg G, Fontaine AA. Experimental fluid mechanics of pulsatile artificial blood pumps. Annu Rev Fluid Mech. 2006;38:65–86. [Google Scholar]
- 16.Yang N, Deutsch S, Paterson EG, Manning KB. Comparative Study of Continuous and Pulsatile Left Ventricular Assist Devices on Hemodynamics of a Pediatric End-to-Side Anastomotic Graft. Cardiovasc Eng Technol. 2010;1(1) doi: 10.1007/s13239-010-0006-6. [DOI] [PMC free article] [PubMed] [Google Scholar]
- 17.Kameneva MV, Burgreen GW, Kono K, Repko B, Antaki JF, Umezu M. Effects of turbulent stresses upon mechanical hemolysis: experimental and computational analysis. ASAIO J. 2004;50(5):418–23. doi: 10.1097/01.mat.0000136512.36370.b5. [DOI] [PMC free article] [PubMed] [Google Scholar]
- 18.Zhang P, Yeo JH, Qian P, Hwang NH. Shear stress investigation across mechanical heart valve. ASAIO J. 2007;53(5):530–6. doi: 10.1097/MAT.0b013e318157c093. doi: 10.1097/MAT.0b013e318157c093 00002480-200709000-00002 [pii] [DOI] [PubMed] [Google Scholar]
- 19.Sallam AM. An Investigation of the Effect of Reynolds Shear Stress on Red Blood Cell Hemolysis. Houston, TX: University of Houston; 1982. [Google Scholar]
- 20.Kirklin JK, Naftel DC, Pagani FD, et al. Seventh INTERMACS annual report: 15,000 patients and counting. J Heart Lung Transplant. 2015;34(12):1495–504. doi: 10.1016/j.healun.2015.10.003. doi: S1053-2498(15)01450-3 [pii] 10.1016/j.healun.2015.10.003. [DOI] [PubMed] [Google Scholar]
- 21.Arwatz G, Smits AJ. A viscoelastic model of shear-induced hemolysis in laminar flow. Biorheology. 2013;50(1–2):45–55. doi: 10.3233/BIR-130626. doi: M066312V963M14WN [pii] 0.3233/BIR-130626. [DOI] [PubMed] [Google Scholar]
- 22.Harboe M. A method for determination of hemoglobin in plasma by near-ultraviolet spectrophotometry. Scand J Clin Lab Invest. 1959;11:66–70. doi: 10.3109/00365515909060410. [DOI] [PubMed] [Google Scholar]
- 23.Sowemimo-Coker SO. Red blood cell hemolysis during processing. Transfus Med Rev. 2002;16(1):46–60. doi: 10.1053/tmrv.2002.29404. doi: S0887-7963(02)80006-2 [pii] 10.1053/tmrv.2002.29404. [DOI] [PubMed] [Google Scholar]
- 24.Taylor JO, Good BC, Paterno AV, et al. Analysis of Transitional and Turbulent Flow Through the FDA Benchmark Nozzle Model Using Laser Doppler Velocimetry. Cardiovasc Eng Technol. 2016;7(3):191–209. doi: 10.1007/s13239-016-0270-1. doi: 10.1007/s13239-016-0270-1 10.1007/s13239-016-0270-1 [pii] [DOI] [PubMed] [Google Scholar]
- 25.Liu JS, Lu PC, Chu SH. Turbulence characteristics downstream of bileaflet aortic valve prostheses. Journal of biomechanical engineering. 2000;122(2):118–24. doi: 10.1115/1.429643. [DOI] [PubMed] [Google Scholar]
- 26.Dooley PN, Quinlan NJ. Effect of eddy length scale on mechanical loading of blood cells in turbulent flow. Ann Biomed Eng. 2009;37(12):2449–58. doi: 10.1007/s10439-009-9789-8. [DOI] [PubMed] [Google Scholar]
- 27.Kameneva MV, Antaki JF, Yeleswarapu KK, Watach MJ, Griffith BP, Borovetz HS. Plasma protective effect on red blood cells exposed to mechanical stress. ASAIO J. 1997;43(5):M571–5. [PubMed] [Google Scholar]
- 28.Sumpelmann R, Schurholz T, Marx G, Zander R. Protective effects of plasma replacement fluids on erythrocytes exposed to mechanical stress. Anaesthesia. 2000;55(10):976–9. doi: 10.1046/j.1365-2044.2000.01531.x. doi: ana1531 [pii] [DOI] [PubMed] [Google Scholar]
- 29.Tennekes H, Lumley JL. A first course in turbulence. Cambridge, Mass: MIT Press; 1972. [Google Scholar]
- 30.Schlichting H, Gersten K. Boundary-layer theory. Berlin; New York: Springer; 2000. 8th revised and enlarged edition ed. [Google Scholar]
- 31.Taskin ME, Fraser KH, Zhang T, Wu C, Griffith BP, Wu ZJ. Evaluation of Eulerian and Lagrangian models for hemolysis estimation. ASAIO journal. 2012;58(4):363–72. doi: 10.1097/MAT.0b013e318254833b. [DOI] [PubMed] [Google Scholar]
- 32.Ozturk M, O’Rear EA, Papavassiliou DV. Hemolysis Related to Turbulent Eddy Size Distributions Using Comparisons of Experiments to Computations. Artificial organs. 2015;39(12):E227–39. doi: 10.1111/aor.12572. [DOI] [PubMed] [Google Scholar]
- 33.Jones SA. A relationship between Reynolds stresses and viscous dissipation: implications to red cell damage. Annals of biomedical engineering. 1995;23(1):21–8. doi: 10.1007/BF02368297. [DOI] [PubMed] [Google Scholar]
- 34.Morshed KN, Bark D, Jr, Forleo M, Dasi LP. Theory to predict shear stress on cells in turbulent blood flow. PLoS One. 2014;9(8):e105357. doi: 10.1371/journal.pone.0105357. doi: 10.1371/journal.pone.0105357 ONE-D-14-01063 [pii] [DOI] [PMC free article] [PubMed] [Google Scholar]
- 35.Jikuya T, Tsutsui T, Shigeta O, Sankai Y, Mitsui T. Species differences in erythrocyte mechanical fragility: comparison of human, bovine, and ovine cells. ASAIO J. 1998;44(5):M452–5. [PubMed] [Google Scholar]
- 36.Ziegler LA, Olia SE, Kameneva MV. Red Blood Cell Mechanical Fragility Test for Clinical Research Applications. Artif Organs. 2016 doi: 10.1111/aor.12826. [DOI] [PMC free article] [PubMed] [Google Scholar]