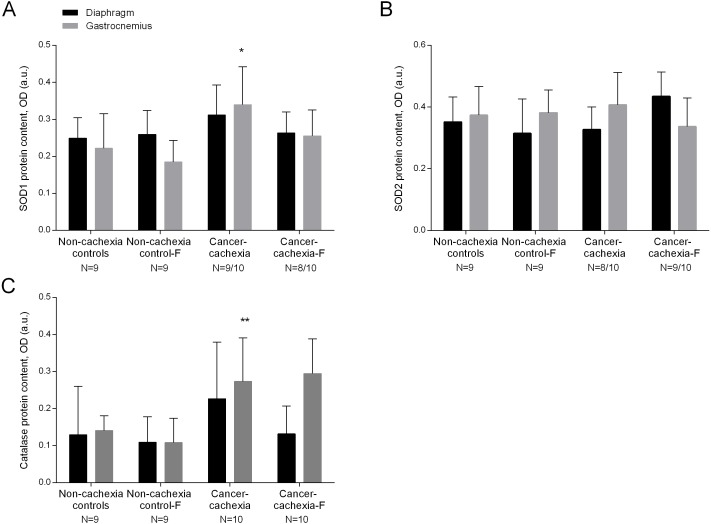
Figure 2. Levels of antioxidants in the diaphragm and gastrocnemius muscles.
(A) Mean values and standard deviation of SOD1 protein content in diaphragm (black bars) and gastrocnemius (grey bars) muscles as measured by optical densities in arbitrary units (OD, a.u.). Definition of abbreviations: SOD, superoxide dismutase; F, formoterol. Statistical significance is represented as follow: * p ≤ 0.05 between non-cachexia controls and cancer-cachexia rats. (B) Mean values and standard deviation of SOD2 protein content in diaphragm (black bars) and gastrocnemius (grey bars) muscles as measured by optical densities in arbitrary units (OD, a.u.). Definition of abbreviations: SOD, superoxide dismutase; F, formoterol. (C) Mean values and standard deviation of catalase protein content in diaphragm (black bars) and gastrocnemius (grey bars) muscles as measured by optical densities in arbitrary units (OD, a.u.). Definition of abbreviations: F, formoterol. Statistical significance is represented as follow: ** p ≤ 0.01 between non-cachexia controls and cancer-cachexia rats.

