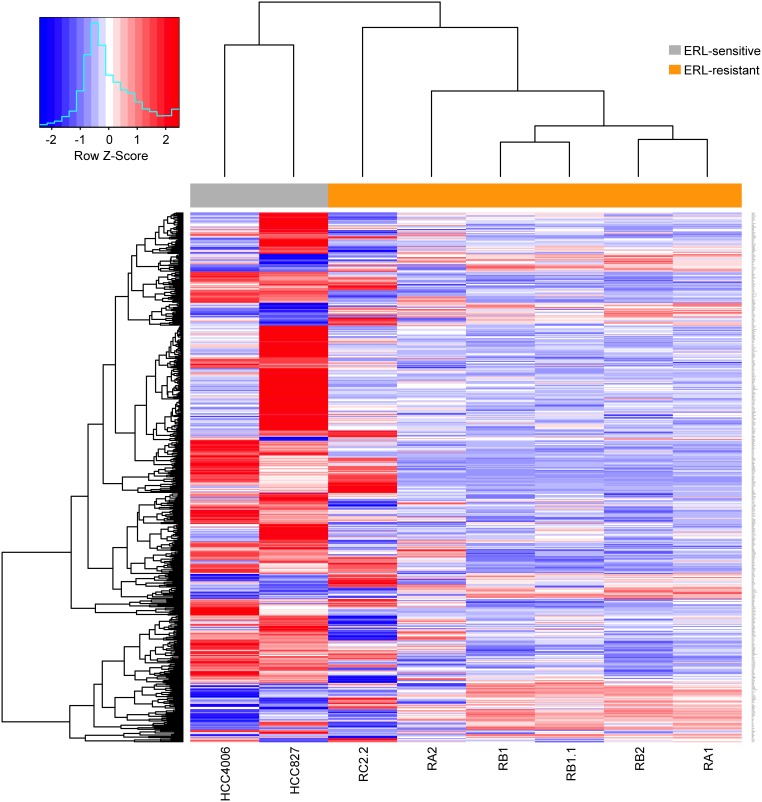
Figure 6. Differentially expressed genes in erlotinib-resistant NSCLC cell lines.
Hierarchical biclustering heatmap of expression levels for genes scored as differentially expressed in at least 5/6 comparisons of erlotinib-resistant derived cell lines to their erlotinib-sensitive parental cell lines. Data are row-scaled and rendered on a blue (lower expression) to red (higher expression) scale.

