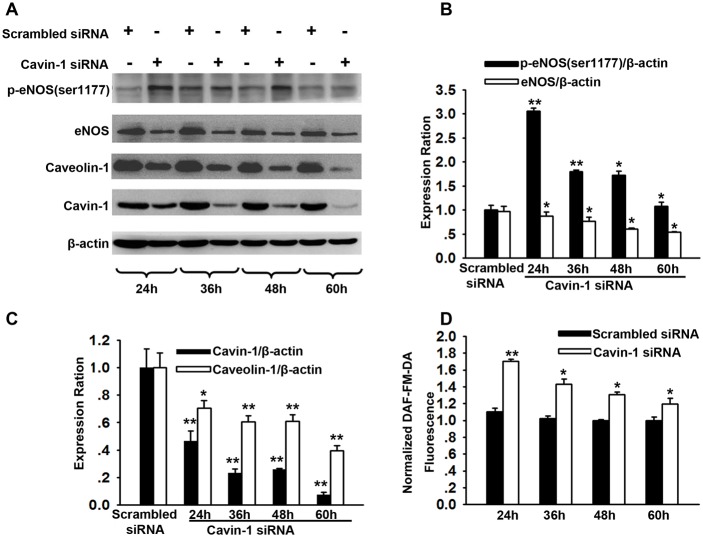
Figure 2. Time course for caveolin-1 and eNOS expression after cavin-1 siRNA transfection.
Cells were transfected with cavin-1 siRNA or scrambled siRNA (20 nM) for 24-60 h. (A) The representative western blots image shows the expressions of eNOS, caveolin-1 and cavin-1 at indicated time after siRNA transfection. (B, C) The protein levels of eNOS (B), caveolin-1 (C) and cavin-1 (C) were evaluated by immunoblotting. * P <0.05 or **P <0.01 vs. Scrambled siRNA, n=4. (D) Cavin-1 siRNA enhanced NO production in HUVECs. HUVECs were transfected with cavin-1 siRNA or scrambled siRNA for indicated time and then loaded with DAF-FM-DA dye. After washing with PBS, fluorescence was measured. * P <0.05 or **P <0.01 vs. Scrambled siRNA, n=4.

