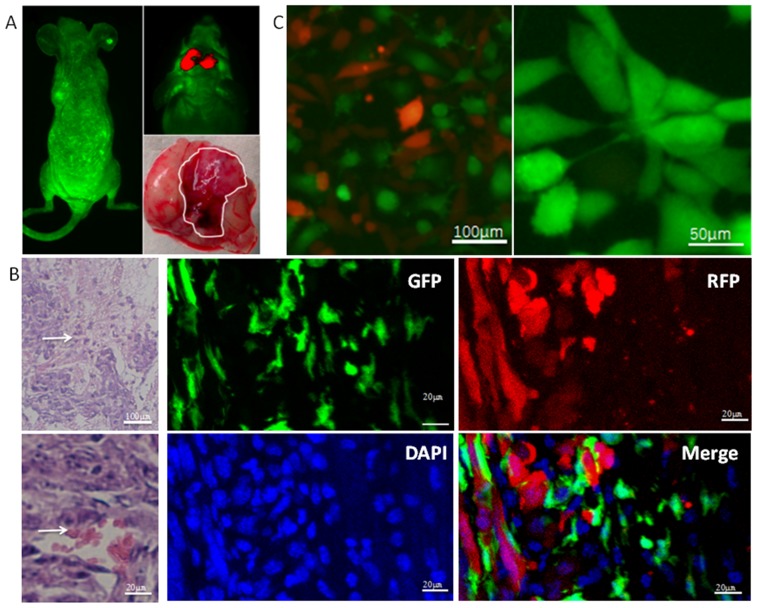
Figure 1. Characterization of SU3-RFP GSC and EGFP-BMSC interactions in intracranial xenograft tumors.
(A) Top left shows live fluorescence image of a irradiated mouse transplanted with bone marrow derived GFP+ cells. The light green fluorescence is seen all over whole body. Top right shows SU3-RFP derived intracranial tumor (red). Bottom right shows the whole brain with the white trace showing tumor derived from SU3-RFP cells. (B) Top left shows H&E stained SU3-RFP derived intracranial tumor sections with densely arranged tumor cells interspersed with blood vessels (white arrow). Bottom left image shows red blood cells in the vessel lumen (white arrow) of SU3-RFP derived intracranial tumor sections. Right images show laser scanning confocal microscopic images of the SU3-RFP derived intracranial tumor sections showing exogenous bone marrow cells (green) interacting with SU3-RFP tumor cells (red) in the tumor parenchyma (bar: 20μm). (C) Fluorescence images (left) of primary culture of SU3-RFP xenograft tumor tissue derived cells showing both SU3-RFP cells (red) and bone marrow-derived GFP+ cells (green; bar: 100μm). Fluorescence images (Right) showing highly proliferating GFP+ cells with high proliferative ability that were derived from a single cell by micro-pipetting techniques (bar: 50μm).

