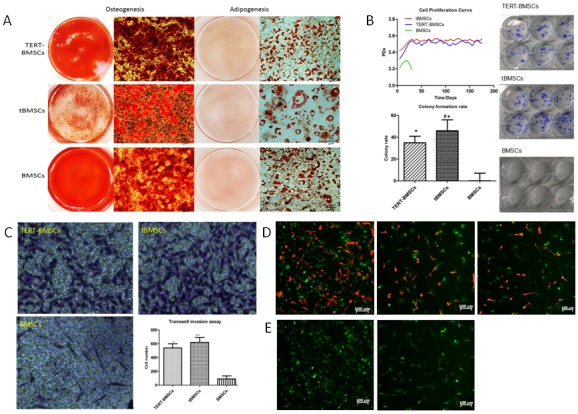
Figure 3. In vitro characterization of TERT-BMSCs, t-BMSCs and normal BMSCs in vitro.

(A) Representative images of Alizarin Red S and Oil Red O staining of TERT-BMSCs, tBMSCs, and BMSCs differentiated into osteocytes (left) and adipocytes (right) respectively. (bar: 20μm). (B) Growth curves of TERT-BMSCs, tBMSCs and normal BMSCs show that both TERT- and tBMSCs show increased proliferation demonstrated by population doubling (PD). However, PD values for normal BMSCs gradually decreases after 5 generations. (Right) Colony formation assay shows that TERT-BMSCs form lower number of colonies than tBMSCs, but higher than normal BMSCs. Note: * denotes p<0.05 when TERT-BMSCs/tBMSCs are compared with BMSCs (top left); # denotes p<0.05 when TERT-BMSCs and tBMSCs are compared (lower left). (C) Representative images showing results of the Transwell invasion assay. As shown by crystal violet staining of fixed BMSCs that invade the matrigel in all 3 groups, TERT-BMSCs show less invasiveness than tBMSCs (* p<0.05), but higher invasiveness than normal BMSCs (# p<0.05). (D) Representative fluorescent images showing results of the in vitro co-culture of SU3-RFP cells with BMSC-derived cells at a ratio of 1:5. At two weeks, both SU3-RFP and tBMSC cell numbers increase significantly (left). Both SU3-RFP and TERT-BMSCs show mild increase in cell density when co-cultured (middle). SU3-RFP cells and BMSCs co-cultured for two weeks show low cell density, though SU3-RFP keep actively growing (right). (E) Representative fluorescent images showing results of the in vitro indirect co-culture of BMSC-derived cells with (left) or without (right) SU3-RFP culture medium (bar 100μm). As shown, BMSCs proliferate faster with supernatant of SU3-RFP culture medium (left) as indicated by higher numbers, thereby suggesting paracrine mechanism.
