

Abstract
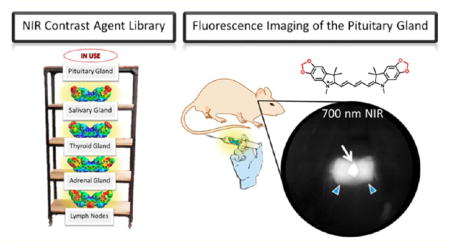
Our initial efforts to prepare tissue-specific near-infrared (NIR) fluorescent compounds generated successful correlation between physicochemical properties and global uptake in major organs after systemic circulation and biodistribution. Herein, we focus on the effects on biodistribution based on modulating electronic influencing moieties from donating to withdrawing moieties at both the heterocyclic site and through meso-substitution of pentamethine cyanine fluorophores. These selected modifications harnessed innate biodistribution pathways through the structure-inherent targeting, resulting in effective imaging of the adrenal glands, pituitary gland, lymph nodes, pancreas, and thyroid and salivary glands. These native-tissue contrast agents will arm surgeons with a powerful and versatile arsenal for intraoperative NIR imaging in real time.
Graphical Abstract
INTRODUCTION
During endocrine surgeries and intricate surgical resections, surgeons mostly rely on their naked eye and experience during often-lengthy procedures to avoid sensitive glands and tissues.1–3 Neglecting to carefully navigate the surgical field can lead to poor patient prognosis even morbidity.4–11 Endocrine and exocrine tissues regulate the body’s hormone levels, and any perturbation, especially transection, can jeopardize the patient’s ability to recover after surgery and maintain proper hormone levels.12–15 The important task of avoiding sensitive tissues is often difficult as these small and imperative glands are often obscured by blood and surrounding tissues. Surgeons require an imaging modality that can allow them to visualize these tissues during cancer resection surgeries to improve the surgical success rate, lower overall fatalities, and advance patient prognoses.
Near-infrared (NIR) fluorescence-guided resection of cancerous tissues has demonstrated significant promise with increasing advancements being reported over the recent years.15–27 Unfortunately, research efforts have been overwhelmingly concentrated on developing cancer-specific NIR-fluorophores with optimal optical, physicochemical, and targeting properties. This only satisfies one-half of the main objective: the ability to simultaneously image the surgical field with both a disease-targeted fluorophore and a native-tissue-targeted fluorophore of distinct wavelengths that can both be simultaneously and separately detected for direct dual-target imaging in real time.
Significant advancements have been made to develop NIR-fluorescent compounds that target sensitive endogenous tissue and help surgeons avoid these hormonal glands in real time without changing the overall look of the surgical field. The class of NIR-fluorescent cyanine dyes has shown excellent promise in the area of NIR-fluorescence image-guided surgery for in vivo tumor targeting. Cyanine chromophores are broadly defined by having two nitrogen-containing heterocycles that are connected through an electron-deficient polymethine bridge with a delocalized monocation conjugated between both nitrogen atoms. The wavelengths associated with these compounds are heavily dependent on the length of the polymethine bridge and the terminal heterocyclic moieties. Polymethine cyanines are chemically stable NIR-fluorescent compounds, and we have investigated the pentamethine class of compounds previously16,20 and herein for laying the groundwork for endogenous tissue targeting. The heptamethine cyanine class (~800 nm fluorescence) has been more extensively explored for disease targeting through the development of zwitterionic decorated heptamethine cyanines linked with a propinoic acid and conjugated with a small cyclic peptide (cRGD-ZW800–1).10,21,22 The longer NIR wavelengths (i.e., 800 nm) are more easily detected against the background and usually reserved to detect occult cancerous metastasis due to the minimal autofluorescence. We plan to further exploit the 700 nm channel (pentamethine cyanines) for native tissue imaging for dual channel intraoperative imaging.
Toward achieving this goal, we have continued to harness the structure-inherent tissue affinity to determine the innate biodistribution and targeting by modulating overall molecular characteristics such as hydrophobicity (determined through log D calculations), total polar surface area, molecular size/weight, and the electronic contributions (electron-donating/-withdrawing characteristics).15,24,26 The compounds synthesized and analyzed herein vary by their heterocyclic moieties (electron donating or withdrawing) and various halogenation at the central carbon atom of the polymethine chain which alters the net dipole, volume, polarization, and even the overall shape of the compounds. We expect these selected modifications to offer biological perturbation toward understanding the molecular characteristics for targeting specific tissues. Correlating these molecular descriptors with in vivo biodistribution is expected to result in a clinically significant paradigm in the quest of translating NIR-targeted contrast agents into the clinic, and every analyzed compound offers another evidentiary piece to the puzzle.
RESULTS AND DISCUSSION
Synthesis of Pentamethine Fluorophores
Since it has been previously reported that halogenated hydrocarbons localize in higher concentration within endocrine and exocrine glands compared to their nonhalogenated counterparts,16 we decided to probe the effect of halogenation on pentamethine cyanines for endocrine and exocrine tissue targeting. For a direct comparison, we synthesized electron-donating counterparts that could offer insight into how potential electronic factors present in the compounds may influence biodistribution. We selected methoxy and methylene-dioxy heterocyclic groups for a direct comparison to the halogenated counterparts and fully expected perturbation in the biological distribution profile, but we could not predict the results of these modifications. Understanding the effects that altering physicochemical properties imparts on the distribution adds important fundamental knowledge about future targeting ability for this and many other classes of imaging agents.
We have developed several optimized synthetic routes for maximizing the structural diversity in the pentamethine cyanine pharmacophore. The compounds with neutral effects and electron-withdrawing groups are synthesized starting with the corresponding phenyl hydrazine salts being refluxed in the presence of 3-methyl-2-butanone in acidic conditions. This reaction furnishes the indolenines 2–5 in excellent yield. We then alkylated the obtained oil using iodomethane in acetonitrile, which yields the cationic salt 6–10 bearing an acidic methylene proton. We also separately react aniline with a warm ethanolic solution of either mucochloric or mucobromic acid to obtain the pentamethine precursor 12 or 13, with 11 being commercially obtained. These two compounds are individually combined in the presence of acetic anhydride and either triethylamine (fluorine-containing compounds) or sodium acetate and are heated to afford the brilliant blue pentamethine fluorophores Schemes 1 and 2.
Scheme 1.

Synthesis of 700 nm Emitting Pentamethine Cyanines Featuring Neutral (X = H) and Electron-Withdrawing (X = F, Cl, Br, CF3) Moieties
Scheme 2.

Synthesis of 700 nm Emitting Pentamethine Cyanines Featuring Electron-Donating Methoxy Groups
The electron-donating containing methoxy-substituted compounds are prepared through an identical synthetic route; however, the final step requires a longer reaction time at a slightly elevated temperature, due to the methoxy group electron-donating effects which increases the pKa of the methylene proton resulting in reduced reactivity of the methylene carbon. We also designed a complementary set of compounds bearing heterocyclic-donating groups features the methylene dioxy ring shown in compounds 36–38. These compounds are prepared using an alternate synthetic strategy beginning with the acidic bromination of 3-methyl-2-butanone followed by SN1 replacement of the tertiary bromine by the methylene dioxyaniline compound. Upon heating in the presence of acid catalyst, para-toluenesulfonic acid, the compound forms the cyclic methylene dioxy 2,3,3-trimethy-lindolenine ring through a largely unexplored Bischler–Möhlau method that can be alkylated using aforementioned conditions for the formation of compound 35. The final methylene dioxy compounds 36–38 were synthesized using similar chemistry as the methoxy group (Scheme 3).
Scheme 3.

Synthesis of 700 nm Emitting Pentamethine Cyanines Featuring Electron-Donating Methylene Dioxy Substitution on the Phenyl Rings
Optical and Physicochemical Properties
The optical properties, shown in Table 1, were performed in several solvents to determine the in vivo success for the fluorophores. We can see that the compounds with hydrogen, chlorine, bromide, and methoxy groups (14–25, 31–33) exhibit sharp and NIR absorbance bands with very high molar absorptivity all being >100,000 M−1 cm−1 which suggests that these fluorophores will satisfactorily absorb NIR wavelengths in vivo and will be compatible with the intraoperative imaging system. As expected, the methylenedioxy compounds exhibited slightly lower molar absorptivity due to a broadening of the absorption profile which results from a more widely dispersed energy sublevels. Similarly, the trifluoromethyl substituted compounds are very poor at absorbing light at their wavelength of maximum absorbance, as indicated by their low molar absorptivity values in Table 1. We attribute this to the high-electron-withdrawing characteristics of the trifluoromethyl groups which lowers the overall probability of electron movement across the methine bridge connecting the aza-heterocycles. The in vivo success of these compounds also depends of the quantum yield and more importantly the molecular brightness (determined as the product of extinction coefficient and quantum yield) of the compounds in serum; therefore, we examined the quantum yield of these fluorophores in fetal bovine serum (FBS). Compounds 14–28, 31–33 exhibit high quantum yield values in serum which is very appealing. All of the synthesized compounds have sufficiently high molecular brightness values in serum, with many compounds exhibiting molecular brightness values of >20,000. We observed an overall trend for the majority of compounds that as the size of the central halogen increases, the molecular brightness decreases. When analyzing the minimized three-dimensional structures, we see that the meso-halogenation perturbs the trans-pseudoalkene angles and the elongated structure of the fluorophore which actually shortens the overall length and perturbs the conjugated bridge by requiring the compound to bend to accommodate this central substitution. This is an interesting finding since upon first glance, it seems that adding larger groups to the middle of the compound would result in an elongation of the compound simply because it would force the neighboring hydrogen atoms apart. Another potential explanation for the decrease in molecular brightness is the heavy atom effect that can effectively stabilize the triplet state, allowing for a higher probability for competing decay processes of the excited state (i.e., phosphorescence or energy transfer) compared to the nonhalogenated fluorophores.
Table 1.
Optical Properties of 700 nm Emitting NIR Fluorophoresa
| ID | DMSO |
λabs (nm)
|
extinction coefficient (ε, M−1cm−1)
|
λem (nm)
|
Stokes shift
|
QY (Φ, %)
|
MB (ε × Φ)
|
|||||||||
|---|---|---|---|---|---|---|---|---|---|---|---|---|---|---|---|---|
| EtOH | PBS | FBS | DMSO | EtOH | PBS | FBS | EtOH | FBS | EtOH | FBS | EtOH | FBS | EtOH | FBS | ||
| 14 | 647 | 645 | 640 | 649 | 212,500 | 248,200 | 218,800 | 184,500 | 660 | 662 | 15 | 13 | 32.7 | 31.0 | 81,161 | 57,195 |
| 15 | 645 | 644 | 642 | 638 | 235,300 | 207,800 | 171,000 | 168,800 | 659 | 665 | 15 | 27 | 29.2 | 28.8 | 60,677 | 48,614 |
| 16 | 645 | 641 | 638 | 634 | 257,330 | 253,200 | 204,400 | 211,700 | 657 | 660 | 16 | 26 | 30.1 | 43.6 | 76,213 | 92,301 |
| 17 | 645 | 641 | 638 | 649 | 216,700 | 225,800 | 196,500 | 164,400 | 663 | 662 | 22 | 13 | 31.6 | 35.2 | 71,352 | 58,868 |
| 18 | 646 | 643 | 638 | 638 | 210,900 | 233,700 | 193,400 | 193,400 | 658 | 660 | 15 | 22 | 16.5 | 15.3 | 38,561 | 29,590 |
| 19 | 642 | 641 | 635 | 644 | 173,200 | 210,500 | 170,900 | 145,800 | 658 | 658 | 17 | 14 | 16.3 | 11.9 | 34,312 | 17,350 |
| 20 | 652 | 649 | 645 | 660 | 183,400 | 204,200 | 174,200 | 136,000 | 658 | 669 | 19 | 9 | 41.5 | 57.5 | 84,743 | 78,200 |
| 21 | 653 | 652 | 647 | 658 | 192,800 | 207,800 | 140,200 | 136,000 | 664 | 666 | 14 | 8 | 18.3 | 28.5 | 38,027 | 38,760 |
| 22 | 650 | 648 | 643 | 655 | 233,100 | 250,600 | 185,000 | 153,700 | 665 | 663 | 17 | 12 | 15.4 | 17.4 | 38,592 | 26,744 |
| 23 | 653 | 650 | 653 | 662 | 181,200 | 174,500 | 144,800 | 141,100 | 670 | 671 | 20 | 9 | 42.4 | 57.0 | 73,988 | 80,427 |
| 24 | 655 | 653 | 660 | 648 | 140,200 | 189,600 | 121,500 | 119,700 | 667 | 671 | 14 | 23 | 20.8 | 23.0 | 39,437 | 27,531 |
| 25 | 643 | 641 | 635 | 644 | 169,000 | 169,600 | 166,900 | 159,600 | 657 | 663 | 16 | 21 | 15.5 | 11.8 | 26,288 | 18,833 |
| 26 | 642 | 638 | 636 | 648 | 41,200 | 45,200 | 28,700 | 30,600 | 656 | 654 | 18 | 6 | 58.7 | 89.2 | 26,532 | 27,295 |
| 27 | 644 | 640 | 638 | 649 | 72,000 | 114,900 | 56,300 | 19,500 | 656 | 655 | 16 | 6 | 20.5 | 47.4 | 23,555 | 9243 |
| 28 | 641 | 638 | 635 | 644 | 32,400 | 49,700 | 19,600 | 8400 | 653 | 651 | 15 | 7 | 21.1 | 29.0 | 10,487 | 2,436 |
| 31 | 671 | 668 | 658 | 674 | 152,300 | 205,000 | 133,600 | 135,000 | 696 | 696 | 28 | 22 | 9.6 | 11.9 | 19,680 | 16,070 |
| 32 | 672 | 671 | 658 | 676 | 148,100 | 210,000 | 135,900 | 162,000 | 694 | 692 | 23 | 16 | 3.9 | 9.7 | 8190 | 15,710 |
| 33 | 669 | 669 | 655 | 676 | 94,200 | 154,000 | 82,100 | 109,000 | 689 | 688 | 20 | 12 | 5.1 | 9.7 | 7218 | 10,570 |
| 36 | 691 | 690 | 680 | 698 | 107,200 | 108,100 | 89,200 | 85,900 | 705 | 716 | 15 | 18 | 4.7 | 6.5 | 5081 | 5584 |
| 37 | 689 | 690 | 678 | 693 | 147,200 | 156,600 | 127,100 | 117,800 | 716 | 712 | 26 | 19 | 3.0 | 4.2 | 4698 | 4948 |
| 38 | 687 | 687 | 675 | 691 | 154,900 | 165,800 | 135,700 | 125,000 | 715 | 716 | 28 | 25 | 2.9 | 3.1 | 4808 | 3875 |
All measurments were performed in DMSO, ethanol (EtOH), PBS, and FBS, pH = 7.4 at 37 °C.
Abbreviations: λabs, wavelength of maximum absorbance; λem, wavelength of maximum emission; QY, quantum yield; and MB, molecular brightness.
Photostability studies were performed on a select number of contrast agents to observe their performance when continuously irradiated and can be seen in Figure 1. The selected compounds featuring a hydrogen atom at the meso position of the polymethine bridge showed little decomposition after being exposed to light for 48 h, however, when chlorine or bromine replace the hydrogen, there is noticeable degradation of up to 35% of the original absorbance. Only a minimal 4% absorbance was lost for each of the first compounds in each set; furthermore, these data help conclude that these compounds would be applicable for long-duration surgical resections with the ability to absorb and fluoresce NIR-light for high-contrast imaging with a half-life of >48h for the entire set studied. The studies were compared to the same concentration of dyes kept in dark containers, but the same distance from the lamp to determine if thermal degradation contributed as well. We found an absence in measurable degradation for the samples kept in the dark which leads us to conclude that heat from the lamp imparts a negligible effect and the absorbance decrease comes from irradiation.
Figure 1.
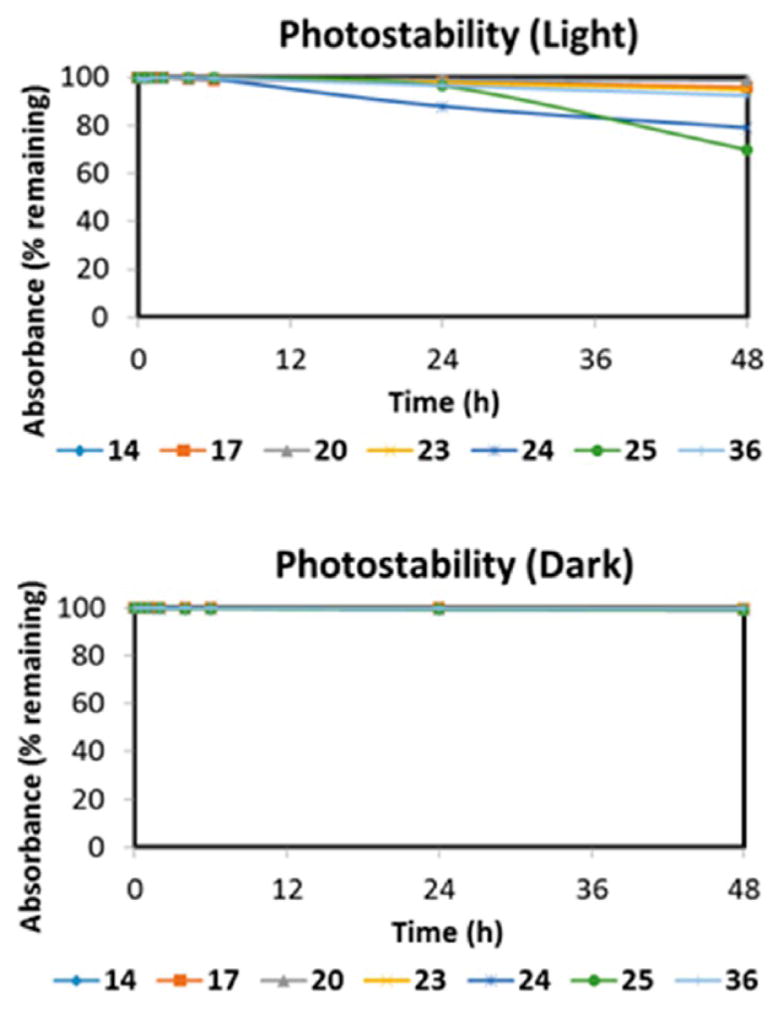
Photodegradation profile in light and dark conditions of a select subset of NIR fluorescent contrast agents. The absorbance values for the individual fluorophores were measured (at the wavelength of maximum absorption) at different intervals to determine the percent absorption remaining.
Structure-Inherent Targeting Ability of NIR Fluorophores
As native tissue targeting remains predominantly understudied, we focused our attention to the salivary, thyroid, pituitary, adrenal glands, lymph nodes, and pancreas. As these tissues facilitate the regulation of human hormone levels, they are important for long-term health and should be carefully avoided during surgical resection in surrounding areas.
After in vivo studies, we found compounds that exhibited high SBR in targeted tissues (high is designated as a ratio of target signal to surrounding tissue being >2.0). Without surface or subcellular receptors readily available for the particular native tissues, it has been difficult to infer mechanistic insight of how these fluorophores localize within their respective tissues. However, we have found several key structural components that help facilitate structure-inherent biodistribution and localization in important tissues, including the salivary, thyroid, pituitary, adrenal glands, lymph nodes, and pancreas.
In surgical resections such as thyroidectomies, it is crucial to remove the entire thyroid gland while maintaining complete integrity of the parathyroid gland. Selective thyroid gland imaging is paramount in the ability to avoid partial thyroid resection or accidental parathyroid transection which can cause several abnormal human conditions such as hypocalcemia.
The common clinical indications of salivary gland imaging are pain and swelling. Imaging is useful in identifying the masses of salivary glands and also in differentiating them from the masses/pathologies of adjacent cervical spaces. In proven cases of salivary gland tumors, imaging helps in delineating the extent of the lesion and invasion of adjacent cervical spaces. Cancerous tissues in this area can grow quickly, and surgical resection of the diseased tissue is needed while sparing excision of the exocrine salivary glands themselves.
Toward finding the thyroid and salivary glands targeting by using NIR fluorophores, we evaluated the imaging capability of these compounds in thyroid and salivary glands. Table 3 shows the thyroid and salivary glands targeting for the entire set of compounds. The targeting of these two tissues seemed to parallel each other, suggesting a biological connection between these two tissues, though despite an extensive literature review, an explanation for this remains unclear. Among the entire set of prepared compounds, we found that central halogenation reduced the targeting efficacy into these glands. Surprisingly, the parent set of compounds (14–16) all targeted the salivary gland with superior SBR. From our data, we can see overall that the salivary glands are sensitive to the central halogenation but remain tolerant to the heterocyclic halogen incorporation. Compounds 20–25 exhibit the halogen trend we observed. With the heterocyclic halogen substitution, the salivary gland targeting remains high; however, when the central halogen is incorporated within the same compounds, we have a severely diminished targeted ability (i.e., from compound 20 with SBR of >5 to compounds 21 and 22 with SBR of 1–2). Specifically compounds 17–25 shown in Figures 2 and 3 exemplify this trend. Compounds 17, 20, and 23 do not feature halogens at the central carbon of the polymethine chain and exhibit the most effective thyroid and salivary gland localization. As the halogen incorporation increases, the thyroid and salivary gland localization is forfeited in deference to nonspecific accumulation and high liver uptake due to hepatobiliary clearance arising from the increase in hydrophobicity.
Table 3.
Targeting Properties and Biodistribution of 700 nm Emitting NIR Fluorophores for Specific Organs/Tissues at 4 h Post-Injectiona
| ID | targeted tissues
|
biodistribution
|
||||||||||
|---|---|---|---|---|---|---|---|---|---|---|---|---|
| AG | Pa | PG | SG | TG | LN | Li | Ki | He | Lu | Sp | Bo | |
| 14 | − | +++ | ++ | +++ | ++ | ++ | − | +++ | + | − | − | ++ |
| 15 | − | +++ | + | +++ | + | + | + | +++ | − | − | − | + |
| 16 | + | ++ | − | +++ | + | + | + | +++ | − | − | − | + |
| 17 | − | +++ | ++ | +++ | +++ | ++ | − | +++ | − | + | − | + |
| 18 | + | ++ | + | ++ | ++ | ++ | ++ | +++ | − | + | − | − |
| 19 | − | + | − | + | + | − | ++ | +++ | − | + | − | − |
| 20 | ++ | +++ | +++ | +++ | +++ | +++ | − | +++ | + | ++ | − | ++ |
| 21 | + | + | + | ++ | + | − | +++ | ++ | − | − | − | − |
| 22 | + | + | − | + | + | − | +++ | ++ | − | + | − | − |
| 23 | + | +++ | +++ | +++ | +++ | +++ | ++ | +++ | + | ++ | − | ++ |
| 24 | + | + | + | ++ | + | + | +++ | ++ | − | + | − | + |
| 25 | + | + | − | + | + | − | +++ | ++ | − | + | − | − |
| 26 | − | ++ | +++ | ++ | ++ | − | +++ | ++ | − | − | − | − |
| 27 | − | + | + | + | − | ++ | +++ | ++ | − | − | − | − |
| 28 | + | + | − | + | − | − | +++ | + | − | − | − | − |
| 31 | ++ | +++ | ++ | +++ | ++ | ++ | + | +++ | + | + | − | + |
| 32 | ++ | ++ | ++ | ++ | ++ | +++ | +++ | +++ | − | − | − | − |
| 33 | + | + | ++ | ++ | + | +++ | +++ | +++ | − | + | + | − |
| 36 | ++ | +++ | +++ | ++ | + | + | ++ | +++ | + | + | − | − |
| 37 | ++ | +++ | ++ | ++ | ++ | + | +++ | ++ | − | − | − | − |
| 38 | ++ | +++ | ++ | ++ | ++ | + | +++ | ++ | − | − | − | − |
Abbreviations used are AG, adrenal gland; Pa, pancreas; PG, pituitary gland; TG, thyroid gland; SG, salivary gland; Li, liver; Ki, kidneys; He, heart; Lu, lungs; Sp, spleen; Bo, bone; LN, lymph node. The SBR of each organ/tissue relative to the abdominal wall was quantified and labeled as −, 1–2; +, 2–3; ++, 3–5; and +++, >5.
Figure 2.

Compounds 20–22, targeting to salivary glands and thyroid glands, and biodistribution of resected organs in CD-1 mice. Ten nmol of each fluorophore was injected intravenously into 25 g CD-1 mice 4 h prior to imaging and resection. Abbreviations used are Du, duodenum; He, heart; In, intestine; Ki, kidneys; Li, liver; Lu, lungs; Mu, muscle; Pa, pancreas; SG, salivary gland, Sp, spleen. Arrows indicate the targeted gland.
Figure 3.

Compounds 23–25, targeting to salivary glands and thyroid glands, and biodistribution of resected organs in CD-1 mice. Ten nmol of each fluorophore was injected intravenously into 25 g CD-1 mice 4 h prior to imaging and resection. Abbreviations used are Du, duodenum; He, heart; In, intestine; Ki, kidneys; Li, liver; Lu, lungs; Mu, muscle; Pa, pancreas; SG, salivary gland, Sp, spleen. Arrowheads indicate the targeted gland.
As one of the important endocrine glands, the pituitary gland (dubbed the master gland) is responsible for controlling the hormonal release of signaling chemicals throughout the body. Transecting this precious gland during surgery causes lasting side effects from hormone dysregulation with imbalances perpetuating during the lifetime of the patent. Tumors associated with the pituitary gland can interfere with signaling the release of many hormones such as thyroid-stimulating hormone which directly influences metabolic activity, energy levels, growth hormones, and the nervous system. Efforts to remove pituitary gland tumors must critically and clearly image the native tissue to prevent accidental damage. We found excellent pituitary gland targeting with the trifluoromethyl compounds 26–28 (Figure 4). The trifluoromethyl substitutions increase the dipole of the compound considerably (Table 2) which we anticipated to elicit a drastic biological response compared to the alternate halogenated counterparts. Indeed, the vast change in electronic dipole from 1 to 4 debye (other compounds) to >7.5 debye in the trifluoromethyl substituted compounds (which also corresponds to an increase in polarizability) lowered the target recognition to some endocrine tissues; however, the thyroid gland targeting remained elevated when the central position was halogen-free.
Figure 4.

Compounds 26–28, targeting to thyroid glands and pituitary gland, and biodistribution of resected organs in CD-1 mice. Ten nmol of each fluorophore was injected intravenously into 25 g CD-1 mice 4 h prior to imaging and resection. Abbreviations used are Du, duodenum; He, heart; In, intestine; Ki, kidneys; Li, liver; LN, lymph node; Lu, lungs; Mu, muscle; Pa, pancreas; SG, salivary gland, Sp, spleen. Arrows indicate the targeted gland. For pituitary glands, arrowheads indicate the anterior portion and arrows for posterior pituitary.
Table 2.
in Silico Physicochemical Properties of 700 nm Emitting NIR Fluorophores (log D, TPSA, and H-bond acceptors) Calculated Using Marvin and JChem Calculator Pluginsa
| ID | physicochemical properties
|
|||||||
|---|---|---|---|---|---|---|---|---|
| MW (g/mol) | log D (pH = 7.4) | TPSA | H-bond acceptors | length (A) | volume (Å3) | dipole (debye) | polarizability | |
| 14 | 383.548 | 3.56 | 6.25 | 1 | 18.665 | 445.51 | 1.95 | 76.14 |
| 15 | 417.994 | 3.79 | 6.25 | 1 | 18.530 | 458.45 | 0.89 | 77.21 |
| 16 | 462.445 | 3.96 | 6.25 | 1 | 18.453 | 462.96 | 0.79 | 77.55 |
| 17 | 419.529 | 3.84 | 6.25 | 2 | 18.684 | 455.28 | 4.23 | 76.95 |
| 18 | 453.974 | 4.08 | 6.25 | 3 | 18.536 | 468.22 | 3.32 | 78.02 |
| 19 | 498.425 | 4.24 | 6.25 | 3 | 18.475 | 472.73 | 3.26 | 78.36 |
| 20 | 452.439 | 4.77 | 6.25 | 2 | 18.674 | 472.01 | 3.55 | 78.30 |
| 21 | 486.884 | 5.00 | 6.25 | 3 | 18.539 | 484.95 | 2.58 | 79.37 |
| 22 | 531.335 | 5.17 | 6.25 | 3 | 18.464 | 489.45 | 2.52 | 79.71 |
| 23 | 541.341 | 5.09 | 6.25 | 2 | 18.665 | 481.25 | 3.74 | 79.05 |
| 24 | 575.786 | 5.33 | 6.25 | 3 | 18.517 | 494.19 | 2.79 | 80.12 |
| 25 | 620.237 | 5.50 | 6.25 | 3 | 18.340 | 498.70 | 2.73 | 80.40 |
| 26 | 519.544 | 5.31 | 6.25 | 6 | 20.188 | 511.26 | 8.04 | 81.47 |
| 27 | 553.989 | 5.55 | 6.25 | 7 | 19.547 | 524.14 | 7.58 | 82.54 |
| 28 | 598.440 | 5.70 | 6.25 | 7 | 19.406 | 528.65 | 7.62 | 82.88 |
| 31 | 443.600 | 3.24 | 24.71 | 2 | 20.631 | 500.23 | 4.10 | 80.61 |
| 32 | 478.045 | 3.48 | 24.71 | 3 | 20.527 | 513.28 | 3.04 | 81.68 |
| 33 | 522.496 | 3.64 | 24.71 | 3 | 20.142 | 517.72 | 2.89 | 82.02 |
| 36 | 471.577 | 2.80 | 43.17 | 4 | 21.203 | 496.69 | 2.69 | 80.33 |
| 37 | 506.019 | 3.04 | 43.17 | 5 | 20.847 | 509.64 | 1.77 | 81.39 |
| 38 | 550.473 | 3.21 | 43.17 | 5 | 20.680 | 514.15 | 1.72 | 81.74 |
Log D = partition coefficient at pH 7.4, TPSA = total polar surface area, while molecular parameters (length, volume dipole, and polarizability) were calculated using Spartan Wavefunction (V10) DFT starting with the minimized structural conformation of the lowest energy.
Lymph nodes are widely distributed and are responsible for immune system function and can indicate an abnormal physiological condition. For example, an increase in size may indicate leukemia due to increased trafficking of lymphocytes from the blood into the lymph nodes. Additionally, thorough examination of the lymph nodes is crucial for the staging of cancer as tumor metastases normally first localize in sentinel lymph nodes. For surgical avoidance and the frequent necessity to biopsy, a NIR imaging technique to visualize this tissue is highly important. In the developed set of compounds, we noticed effective targeting of the lymph node by the methoxy derivatives 31–33 which is surprising in the context of the methylene dioxy compounds 36–38 exhibiting low lymph node targeting. Interestingly we see an inverse effect of the previous set of compounds where the meso halogenation increases the imaging signal as compared to the surrounding tissue in the lymph node with 32 and 33 having a SBR of >5 as indicated by the +++ in Table 3. Figure 5 shows two successful examples of nodal imaging in the inguinal and lumbar nodes with compound 33 exhibiting excellent targeting characteristics.
Figure 5.

Compounds 31–33, targeting to inguinal and lumbar lymph nodes, and biodistribution of resected organs in CD-1 mice. Ten nmol of each fluorophore was injected intravenously into 25 g CD-1 mice 4 h prior to imaging and resection. Abbreviations used are Bl, bladder; Du, duodenum; He, heart; In, intestine; Ki, kidneys; Li, liver; LN, lymph node; Lu, lungs; Mu, muscle; Pa, pancreas; Sp, spleen. Arrows indicate the targeted gland.
The adrenal glands, located above the kidney, produce essential and nonessential hormones that primarily control the body’s metabolism, blood pressure, and stress response. In Figure 6, we observed that the methylene dioxy compounds 36–38 exhibited adrenal gland targeting characteristics (++, SBR 3–5) that also seemed to be tolerant to the addition of meso-halogens. It seems that the log D values predominantly govern the localization of these compounds as the five compounds (31, 32, 36–38) with the lowest log D were the most effective at targeting this tissue, with the methylene dioxy compounds 36–38 prevailing as the best contrast agents for the adrenal gland across the series. This finding is also true in their pancreas targeting ability, as all three compounds within this set exhibit excellent SBR in pancreatic tissue. Interestingly, the small change from methoxy 31–33 to the locked ring structure of 36–38 alters the targeting ability of the compound (i.e., comparing 33 and 38). This finding also corroborates our previous results that pancreatic targeting requires low comparative log D values. Indeed the highest pancreas targeting characteristics are from compounds exhibiting comparatively low log D values (i.e., compounds 36–38, log D 2.80–3.21). Additionally, the central halogenation seems to lower pancreas-targeting substantially, except for the methylene dioxy set of compounds. It is very interesting that independent halogenation (either central or terminal heterocycles) does not seem to greatly perturb the pancreatic tissue uptake, except for when the trifluoromethyl group is incorporated. Halogenating both positions, however, has a detrimental effect on the compound-pancreas localization. For example, compounds 15, 16, 17, 20, and 23 are all effective at pancreas targeting, and only have halogens at either the heterocycles or bridge. Compounds 18, 19, 21, 22, 24, and 25 with all sites halogenated exhibit reduced pancreas uptake. We attribute this effect to an increase in overall hydrophobicity imparted by too many halogens on the core structure. Additionally, structures with higher molecular weight in addition to greater hydrophobic character seem to be poor at pancreatic localization.
Figure 6.

Compounds 36–38, targeting to adrenal glands and pituitary gland, and biodistribution of resected organs in CD-1 mice. Ten nmol of each fluorophore was injected intravenously into 25 g CD-1 mice 4 h prior to imaging and resection. Abbreviations used are Du, duodenum; He, heart; In, intestine; Ki, kidneys; Li, liver; Lu, lungs; Mu, muscle; Pa, pancreas; SG, salivary gland, Sp, spleen. Arrows indicate the targeted gland. For pituitary glands, arrowheads indicate the anterior portion and arrows for posterior pituitary.
Preliminary Cytotoxicity of NIR fluorophores
To confirm cell cytotoxicity of the tissue-specific fluorophores, NIH/3T3 mouse fibroblast cells were incubated with the selected NIR fluorophores, respectively, for 1 h at 37 °C and gently washed with DMEM. Then, the viability of fibroblasts was assessed by the alamarBlue assay. The assay system incorporates an oxidation–reduction (REDOX) indicator that both fluorescence and changes color in response to chemical reduction of growth medium resulting from cell growth. As shown in Figure 7, over 75% of the cells were viable when treated with NIR fluorophores at concentrations of 2 μM and 10 μM. Therefore, notable cell death was not observed even with the high concentration of the NIR fluorophores. These results confirm that tissue-specific NIR fluorophores do not show obvious cytotoxic effects.
Figure 7.

Cell viability assay of selected NIR fluorophores using NIH/3T3 fibroblasts. Cell viability was plotted 1 day post-treatment of compounds at a concentration of 2 μM (left) or 10 μM (right), compared to untreated control as measured by the alamarBlue assay. Data are representative of N = 6 independent experiments per condition (mean ± SD).
CONCLUSIONS
Toward satisfying the clinical need for native tissue targeted contrast agents in real-time NIR image-guided surgery, we present compounds that are effective at imaging the salivary, thyroid, pituitary, adrenal glands, lymph nodes, and pancreas. We are confident that this work will lay the foundation for development of native tissue contrast agents for clinical use.
EXPERIMENTAL DETAILS
Synthesis of Pentamethine Cyanine Analogs
The chemical reagents used in the synthesis of these compounds were obtained from Acros Organics, Alfa Aesar, and Matrix Scientific. The reactions were followed using silica gel 60 F254 thin-layer chromatography plates (Merck EMD Millipore, Darmstadt, Germany). Open column chromatography was utilized for the purification of all final compounds using 60–200 μm, 60A, classic column silica gel (Dynamic Adsorbents, Norcross, GA). The 1H NMR and 13C NMR spectra were obtained using high-quality Kontes NMR tubes (Kimble Chase, Vineland, NJ) rated to 500 MHz and were recorded on a Bruker Avance (400 MHz) spectrometer using DMSO-d6 or MeOD-d4 containing tetramethylsilane (TMS) as an internal calibration standard set to 0.0 ppm. UV–vis/NIR absorption spectra were recorded on a Varian Cary 50 spectrophotometer. High-resolution accurate mass spectra (HRMS) were obtained either at the Georgia State University Mass Spectrometry Facility using a Waters Q-TOF micro (ESI-Q-TOF) mass spectrometer or utilizing a Waters Micromass LCT TOF ES+ Premier mass spectrometer. Liquid chromatography utilized a Waters 2487 single wavelength absorption detector with wavelengths set between 640 and 700 nm depending on the particular photophysical properties. The column used in LC was a Waters Delta-Pak 5 μM 100A 3.9 × 150 mm reversed-phase C18 column. Evaporative light-scattering detection analyzes trace impurities that cannot be observed by alternate methods; a SEDEX 75 ELSD was utilized in tandem with liquid chromatography. The integral under the curve was determined for both the LC and ELSD spectra and was used to confirm the purity (>95%) of the synthesized contrast agents.
Optical and Physicochemical Property Analyses
All optical measurements were performed in various solvents, including ethanol, dimethyl sulfoxide (DMSO), phosphate buffered saline (PBS, pH 7.4), and at 37 °C in 100% FBS buffered with 50 mM HEPES, pH 7.4. Absorbance and fluorescence emission spectra of the series of NIR fluorophores were measured using Varian Cary 50 absorbance spectrophotometer (190–1100 nm) and Shimadzu RF-5301PC spectrofluorometer (350–1000 nm). For fluorescence quantum yield (QY) measurements, rhodamine 800 in absolute ethanol (QY = 28%) was used as a calibration standard, under conditions of matched absorbance at 620 nm. In silico calculations of physicochemical distribution coefficient (log D at pH 7.4) was calculated using Marvin and JChem calculator plugins (ChemAxon, Budapest, Hungary). Electrostatic maps were calculated using Spartan DFT calculations at the B3LYP level.
Photostability Analysis
The photostability experiments were performed to determine the photobleaching threshold of the fluorophores. We determined the photobleaching rate by measuring the decrease in absorbance at the wavelength of maximum absorption over a 48h time period. The light condition involved a glass cell containing individual contrast agent (0.01 mm in methanol) that was affixed 250 mm away from a 15W F15T8 broad spectrum bulb being irradiated using a portable lamp at room temperature. The dark control was also examined to exclude chemical decomposition phenomena. The absorbance values were measured at various time points and then plotted versus time to obtain the photostability graphs in light and dark.
Liquid Chromatography–Mass Spectrometry Analysis
The purity of all compounds was measured using liquid chromatography–mass spectrometry (LC-MS) on a Waters system consisting of a 1525 binary HPLC pump with a manual 7725i Rheodyne injector, a 996 photodiode array (PDA) detector, and a 2475 multiwavelength fluorescence detector. The column eluent was divided in 2 using a flow splitter (Upchurch Scientific). A portion of the eluent flowed into an ELSD (Richards Scientific) while the rest flowed into a Micromass LCT ESI-TOF spectrometer (Waters) equipped with a Symmetry (R) C18 (4.6 × 150 mm, 5 μm) reverse-phase HPLC column. For mass spectrometry, the mobile phase was solvent A = 0.1% formic acid in water and solvent B = CH3CN with 95% A for 5 min and a linear gradient from 5% to 40% CH3CN (from A to B for 30 min) at a flow rate of 1 mL/min, capillary voltage was −3317 V, and sample cone voltage was −50 V.
Cell Viability Assay
The cell toxicity and proliferation were assessed by alamarBlue (Thermo Scientific) assay. The NIH/3T3 fibroblasts were seeded onto 96-well plates (1 × 10⁴ cells per well). To test cytotoxicity depending on the fluorophore type and concentration, cells were treated with 2 and 10 μM of each NIR fluorophore (n = 6) for 1 h and cultured at 24 h post-treatment. At each assay time point, the incubation cell media was replaced with 100 μL of fresh media. Ten μL of alamarBlue solution was directly added to 100 μL each well and incubated for 4 h at 37 °C in a humidified 5% CO2 incubator. Finally, the 96-well plates were placed into a microplate reader (Spark 10M, TECAN, Switzerland) for measuring the absorption intensity at 570 nm and fluorescence intensity at 590 nm. The data were presented by dividing by dye-untreated control group. The statistical significance was determined by one-way analysis of variance (ANOVA).
Animal Models and Biodistribution
Animals were housed in an AAALAC-certified facility and were studied under the supervision of BIDMC’s IACUC in accordance with the approved institutional protocol no. 057-2014. Male CD-1 mice (20–30 g, 6–8 weeks, Charles River Laboratories, Wilmington, MA) were anesthetized with 100 mg/kg ketamine and 10 mg/kg xylazine intraperitoneally (Webster Veterinary, Fort Devens, MA). For intraoperative imaging and biodistribution, the imaging system equipped with a custom filter set (Chroma Technology Corporation, Brattleboro, VT) composed of a 650 ± 22 nm excitation filter, a 680 nm dichroic mirror, and an 710 ± 25 nm emission filter was used at a fluence rate of 4 mW/cm2, with white light (400–650 nm) at 40,000 l×. Color and NIR fluorescence images were acquired simultaneously with custom software at rates up to 15 Hz over a 15 cm diameter field of view. The imaging system was positioned at a distance of 18 in. from the surgical field. For each experiment, camera exposure time and image normalization were held constant.
Quantitative Analysis
At each time point, the fluorescence and background intensity of a region of interest (ROI) over each tissue was quantified using custom imaging software and ImageJ software (NIH, Bethesda, MD) version 1.45q. The signal-to-background ratio (SBR) was calculated as SBR = fluorescence/background, where background is the signal intensity of neighboring tissues such as muscle or skin obtained over the period of imaging time. All NIR fluorescence images for a particular fluorophore were normalized identically for all conditions of an experiment. At least three animals were analyzed at each time point. Statistical analysis was carried out using the unpaired Student’s t-test or one-way ANOVA. Results were presented as mean ± SD, and curve fitting was performed using Prism version 4.0a software (GraphPad, San Diego, CA).
Synthesis and Characterization of NIR Fluorophore
To obtain the final dyes 14–28, 31–33, and 36–38, the precursor salts 6–10, 30, and 35 (2 mol equiv) were added to a clean, dry round-bottom flask. The compounds were stirred in 10 mL of acetic anhydride, and either sodium acetate or triethyl amine (3 mol equiv) was added along with 1 mol equiv of individual malondialdehyde linker 11–13. The reaction was allowed to stir at 40–60 °C for 2 h. The reactions were monitored closely using regular phase thin-layer chromatography with a mobile phase of DCM/MeOH (99:1) as well as UV–vis-NIR spectrophotometer in quartz cuvettes with methanol as a solvent to visualize the absorption band at ~650 nm against that of the starting materials ~400 nm. Upon completion of the reaction, the mixtures were allowed to cool, and the solvent was evaporated. The residue was extracted using DCM and was washed with DI water (3 × 70 mL). The resulting organic layer was dried under magnesium sulfate, gravity filtered, and evaporated to afford crystals that were washed with diethyl ether (2 × 50 mL) and hexanes (50 mL) to yield crystals that were dried under vacuum overnight. The pure product was obtained after dissolving in methanol and precipitating with ether several times, or the compounds were isolated using flash column chromatography and 5% methanol in DCM as the eluting solvent. After purification, the compounds were obtained in the designated yields and were fully characterized.
1,3,3-Trimethyl-2-((1E,3E,5E)-5-(1,3,3-trimethylindolin-2-ylidene)-penta-1,3-dien-1-yl)-3H-indol-1-ium Iodide (14)
Yield 64%, mp > 260 °C; 1H NMR (400 MHz, MeOD-d4) δ: 1.71 (s, 12H), 3.63 (s, 6H), 6.28 (d, J = 16.0 Hz, 2H), 6.65 (t, J = 12.0 Hz, 1H), 7.24 (t, J = 8.0 Hz, 2H), 7.29 (d, J = 8.0 Hz, 2H), 7.39 (t, J = 8.0 Hz, 2H), 7.48 (d, J = 8.0 Hz, 2H), 8.25 (t, J = 12.0 Hz, 2H); 13C NMR (100 MHz, MeOD-d4) δ 27.90, 31.71, 50.50, 104.44, 111.83, 123.31, 126.20, 129.71, 142.56, 144.29, 155.52, 175.28. TOF HRMS m/z [M]+ calcd for [C27H31N2]+ 383.2487, found 383.2474.
2-((1E,3Z,5E)-3-Chloro-5-(1,3,3-trimethylindolin-2-ylidene)penta-1,3-dien-1-yl)-1,3,3-trimethyl-3H-indol-1-ium Iodide (15)
Yield 64%, mp 230–232 °C; 1H NMR (400 MHz, MeOD-d4) δ 1.76 (s, 12H), 3.71 (s, 6H), 6.435 (d, J = 12 Hz, 2H), 7.32 (t, J = 8 Hz, 2H), 7.39 (d, J = 8 Hz, 2H), 7.45 (t, J = 8 Hz, 2H), 7.54 (d, J = 8 Hz, 2H), 8.345 (d, J = 12 Hz, 2H). 13C NMR (100 MHz, MeOD-d4) δ 25.03, 29.53, 48.55, 98.93, 110.02, 121.00, 121.86, 124.55, 127.43, 140.42, 141.67, 146.72, 174.28. TOF HRMS m/z [M]+ calcd for [C27H30N2Cl]+ 417.2098 found 417.2107.
2-((1E,3E,5E)-3-Bromo-5-(1,3,3-trimethylindolin-2-ylidene)penta-1,3-dien-1-yl)-1,3,3-trimethyl-3H-indol-1-ium Iodide (16)
Yield 61%, mp 230–232 °C; 1H NMR (400 MHz, CDCl3-d1) δ 1.91 (s, 12H), 3.82 (s, 6H), 6.36 (d, J = 8 Hz, 2H), 7.16 (d, J = 8.0 Hz, 2H, 7.26–7.31 (m, 4H), 7.39–7.44 (m, 4H) 8.93 (d, J = 12 Hz, 2H). 13C NMR (100 MHz, DMSO-d6) δ 27.04, 31.98, 49.85, 102.61, 112.19, 115.98, 122.94, 125.97, 128.93, 141.78, 143.02, 149.64, 175.14. TOF HRMS m/z [M]+ calcd for [C27H30N2Br]+ 461.1592 found 461.1585.
5-Fluoro-2-((1E,3E,5E)-5-(5-fluoro-1,3,3-trimethylindolin-2-ylidene)penta-1,3-dien-1-yl)-1,3,3-trimethyl-3H-indol-1-ium Iodide (17)
Yield 78%, mp > 260 °C; 1H NMR(400 MHz, DMSO-d6) δ 1.68 (s, 12H), 3.59 (s, 6H), 6.23 (d, J = 12.0 Hz, 2H), 6.52 (s, 1H), 7.24 (s, 2H), 7.39 (s, 2H), 7.62 (s, 2H), 8.29 (s, 2H). 13C NMR (100 MHz, DMSO-d6) δ: 27.27, 31.85, 49.54, 103.64, 103.76, 110.82, 111.07, 112.43, 112.49, 112.59, 112.66, 115.15, 125.54, 139.55, 143.60, 143.69, 154.27, 154.29, 159.32, 161.72, 173.64. TOF HR-MS ESI m/z [M]+ calcd for [C27H29F2N2]+ 419.2299, found 419.2296.
2-((1E,3E,5E)-3-Chloro-5-(5-fluoro-1,3,3-trimethylindolin-2-ylidene)penta-1,3-dien-1-yl)-5-fluoro-1,3,3-trimethyl-3H-indol-1-ium (18)
Yield 37%, mp > 260 °C; 1H NMR(400 MHz, DMSO-d6) δ: 1.72 (s, 12H), 3.67 (s, 6H), 6.26 (d, J = 14 Hz, 2H), 7.29,7.31 (t, J = 6.8 Hz, 8.8 Hz, 2H), 7.52–7.54 (m, 2H), 7.70 (d, J = 6 Hz, 2H), 8.41 (d, J = 14 Hz, 2H). 19F NMR (375 MHz, DMSO-d6) δ: −116.67 (s, 2F). TOF HR-MS ESI m/z [M]+ calcd for [C27H29F2ClN2]+ 453.1909 found 453.1914.
2-((1E,3E,5E)-3-Bromo-5-(5-fluoro-1,3,3-trimethylindolin-2-ylidene)penta-1,3-dien-1-yl)-5-fluoro-1,3,3-trimethyl-3H-indol-1-ium (19)
Yield 52%, 1H NMR(400 MHz, DMSO-d6) δ: 1.72 (s, 12H), 3.67 (s, 6H), 6.26 (d, J = 13.2 Hz, 2H), 7.32 (t, J = 8.8 Hz, 2H), 7.55–7.52 (m, 2H), 7.70 (d, J = 7.6, 2H), 8.46 (d, J = 13.6, 2H). 19F NMR (375 MHz, DMSO-d6) δ: −116.67 (s, 2F). TOF HR-MS ESI m/z [M]+ calcd [C27H29F2N2Br]+ was 497.1404 found 497.1394.
5-Chloro-2-((1E,3E,5E)-5-(5-chloro-1,3,3-trimethylindolin-2-ylidene)penta-1,3-dien-1-yl)-1,3,3-trimethyl-3H-indol-1-ium Iodide (20)
Yield 59%, mp > 260 °C; 1H NMR(400 MHz, DMSO-d6) δ: 1.69 (s, 12H), 3.59 (s, 6H), 6.27 (d, J = 14 Hz, 2H), 6.551 (t, J = 12.4, 12.0 Hz, 1H), 7.39 (d, J = 8.8 Hz, 2H), 7.46 (d, J = 8.4 Hz, 2H), 7.80 (s, 2H), 8.32 (t, J = 13.2 Hz, 2H). 13C NMR (100 MHz, DMSO-d6) δ: 27.30, 31.84, 49.51, 104.09, 112.87, 123.29, 126.16, 128.67, 129.50, 142.23, 143.54, 154.72, 173.65. TOF HR-MS ESI m/z [M]+ calcd for [C27H29Cl2N2]+ 451.1708, found 451.1722.
5-Chloro-2-((1E,3E,5E)-3-chloro-5-(5-chloro-1,3,3-trimethylindo-lin-2-ylidene)penta-1,3-dien-1-yl)-1,3,3-trimethyl-3H-indol-1-ium (21)
Yield 53%, mp > 260 °C; 1H NMR(400 MHz, DMSO-d6) δ: 1.72 (s, 12H), 3.67 (s, 6H), 6.26 (d, J = 14 Hz, 2H), 7.52 (m, 4H), 7.89 (s, 2H), 8.43 (d, J = 13.6, 2H). 13C NMR (100 MHz, DMSO-d6) δ: 26.81, 32.15, 49.98, 100.72, 113.62, 123.06, 123.49, 128.80, 130.31, 142.02, 143.83, 147.96, 174.97. TOF HR-MS ESI m/z [M]+ calcd for [C27H29Cl3N2]+ 485.1318 found 485.1317.
2-((1E,3E,5E)-3-Bromo-5-(5-chloro-1,3,3-trimethylindolin-2-ylidene)penta-1,3-dien-1-yl)-5-chloro-1,3,3-trimethyl-3H-indol-1-ium Iodide (22)
Yield 69%, mp 252–254 °C 1H NMR(400 MHz, DMSO-d6) δ: 1.73 (s, 12H), 3.67 (s, 6H), 6.28 (d, J = 13.2 Hz, 2H), 7.52 (m, 4H), 7.89 (s, 2H), 8.47 (d, J = 13.2 Hz, 2H). 13C NMR (100 MHz, DMSO-d6) δ: 26.79, 32.16, 50.03, 102.96, 113.65, 116.40, 123.51, 128.82, 130.35, 141.99, 143.83, 149.98, 175.15. TOF HR-MS ESI m/z [M]+ calcd [C27H28BrN2Cl2]+ was 529.0813 found 529.0810.
5-Bromo-2-((1E,3E,5E)-5-(5-bromo-1,3,3-trimethylindolin-2-ylidene)penta-1,3-dien-1-yl)-1,3,3-trimethyl-3H-indol-1-ium Iodide (23)
Yield 62%, mp > 260 °C; 1H NMR(400 MHz, DMSO-d6) δ: 1.69 (s, 12H), 3.58 (s, 6H), 6.27 (d, J = 14 Hz, 2H), 6.56 (t, J = 12.4, 12 Hz, 1H), 7.35 (d, J = 8.4 Hz, 2H), 7.59 (d, J = 8.4, 2H), 7.93 (s, 2H), 8.33 (t, J = 13.2 Hz, 2H). 13C NMR (100 MHz, DMSO-d6) δ 27.25, 31.71, 49.48, 104.07, 113.33, 117.45, 126.09, 131.51, 142.63, 143.85, 154.86, 173.45. TOF HR-MS ESI m/z [M]+ calcd for [C27H29Br2N2]+ 539.0697, found 539.0695.
5-Bromo-2-((1E,3E,5E)-5-(5-bromo-1,3,3-trimethylindolin-2-yli-dene)-3-chloropenta-1,3-dien-1-yl)-1,3,3-trimethyl-3H-indol-1-ium (24)
Yield 72%, mp > 260 °C; 1H NMR(400 MHz, DMSO-d6) δ: 1.72 (s, 12H), 3.67 (s, 6H), 6.28 (d, J = 12.0 Hz, 2H), 7.47 (d, J = 8.0 Hz, 2H), 7.63 (d, J = 8.0 Hz, 2H), 8.01 (s, 2H), 8.43 (d, J = 12.0 Hz, 2H). 13C NMR (100 MHz, DMSO-d6) δ: 26.81, 32.17, 49.96, 100.69, 114.05, 118.37, 123.13, 126.26, 131.63, 142.40, 144.11, 147.96, 174.78. TOF HR-MS ESI m/z [M]+ calcd for [C27H28Br2N2Cl]+ 573.0308, found 573.0316.
5-Bromo-2-((1E,3E,5E)-3-bromo-5-(5-bromo-1,3,3-trimethylindo-lin-2-ylidene)penta-1,3-dien-1-yl)-1,3,3-trimethyl-3H-indol-1-ium Iodide (25)
Yield 46%, mp 231–232 °C; 1H NMR(400 MHz, DMSO-d6) δ: 1.72 (s, 12H), 3.66 (s, 6H), 6.28 (d, J = 13.2 Hz, 2H), 7.47 (d, J = 8.0 Hz, 2H), 6.64 (d, J = 8.4 Hz, 2H), 8.01 (s, 2H), 8.48 (d, J = 13.6 Hz, 2H). 13C NMR (100 MHz, DMSO-d6) δ: 26.79, 32.11, 50.03, 102.97, 114.07, 116.47, 118.42, 126.27, 131.65, 142.40, 144.13, 150.03, 175.01. TOF HR-MS ESI m/z [M]+ calcd [C27H28Br3N2]+ was 616.9803, found 616.9814.
1,3,3-Trimethyl-5-(trifluoromethyl)-2-((1E,3E)-5-((E)-1,3,3-tri-methyl-5-(trifluoromethyl)indolin-2-ylidene)penta-1,3-dien-1-yl)-3H-indol-1-ium Iodide (26)
Yield 55%, mp 218–221 °C; 1H NMR (400 MHz, CDCl3): δ 1.81 (s, 12H), 3.79 (s, 6H), 6.53 (d, J = 13.6 Hz, 2H), 7.11 (t, J = 13.6 Hz, 1H), 7.21(d, J = 8.4 Hz, 2H), 7.60 (s, 2H), 7.70 (d, J = 7.6 Hz, 2H), 8.02 (t, J = 13.6, 2H). 19FNMR: (375 MHz, DMSO-d6): δ 62.00. TOF HRMS m/z [M]+ calcd for [C29H29N2F6]+ 519.2297, found 519.2393.
2-((1E,3Z)-3-Chloro-5-((E)-1,3,3-trimethyl-5-(trifluoromethyl)-indolin-2-ylidene)penta-1,3-dien-1-yl)-1,3,3-trimethyl-5-(trifluoro-methyl)-3H-indol-1-ium Iodide (27)
Yield 71%, mp 226–228 °C; 1H NMR (400 MHz, CDCl3): δ 1.91 (s, 12H), 3.87 (s, 6H), 6.47 (d, J = 13.6 Hz, 2 H), 7.30 (s, 2H), 7.65 (m, 4H), 8.90 (d, J = 10.4 Hz, 2H). 19F NMR (375 MHz, DMSO-d6): δ 62.05. TOF HRMS m/z [M]+ calcd for [C29H28N2F6Cl]+ 553.1840, found 553.1996.
2-((1E,3Z)-3-Bromo-5-((E)-1,3,3-trimethyl-5-(trifluoromethyl)-indolin-2-ylidene)penta-1,3-dien-1-yl)-1,3,3-trimethyl-5-(trifluoro-methyl)-3H-indol-1-ium Iodide (28)
Yield 71%, mp 226–228 °C; 1H NMR (400 MHz, CDCl3): δ 1.91 (s, 12H), 3.87 (s, 6H), 6.46 (bs, 2H), 7.30 (s, 2H), 7.69 (m, 4H), 8.91 (d, J = 7.2 Hz, 2H). 19F NMR (375 MHz, DMSO-d6), δ: 62.01. TOF HRMS m/z [M]+ calcd for [C29H28N2F6Br]+ 597.1335, found 597.1597.
5-Methoxy-2,3,3-trimethyl-3H-indole (29)
Yield 78%, reddish brown oil; 1H NMR (400 MHz, DMSO-d6) δ 1.17 (s, 6H), 2.16 (s, 3H), 3.68 (s, 3H), 6.74 (m, 2H), 7.38 (s,1H).
5-Methoxy-1,2,3,3-tetramethyl-3H-indol-1-ium Iodide (30)
1H NMR (400 MHz, DMSO-d6) δ 1.51 (s, 6H), 2.71 (s, 3H), 3.86 (s, 3H), 3.94 (s, 3H), 7.14 (d, J = 8.0 Hz, 1H), 7.47 (s, 1H), 7.81 (d, J = 8.0 Hz, 1H).
5-Methoxy-2-((1E,3E,5E)-5-(5-methoxy-1,3,3-trimethylindolin-2-ylidene)penta-1,3-dien-1-yl)-1,3,3-trimethyl-3H-indol-1-ium Iodide (31)
Yield 75%, mp 228–230 °C; 1H NMR (400 MHz, DMSO-d6): δ 1.66 (s, 12H), 3.56 (s, 3H), 3.81 (s, 6H), 6.17 (d, J = 12 Hz, 2H), 6.46 (t, J = 12 Hz, 1H), 6.95 (d, J = 8 Hz, 2H), 7.30–7.28 (m, 4H), 8.23 (t, J = 12 Hz, 2H). 13C NMR (100 MHz, DMSO-d6): δ 26.48, 30.62, 48.45, 55.29, 102.06, 108.43, 111.02, 112.84, 123.73, 135.80, 142.15, 151.94, 156.98, 171.55. TOF HRMS m/z [M]+ calcd for [C29H35N2O2]+ 443.2699, found 443.2692.
2-((1E,3E,5E)-3-Chloro-5-(5-methoxy-1,3,3-trimethylindolin-2-ylidene)penta-1,3-dien-1-yl)-5-methoxy-1,3,3-trimethyl-3H-indol-1-ium Iodide (32)
Yield 80%, mp 235–237 °C; 1H NMR (400 MHz, MeOD-d4) δ 1.73 (s, 12H), 3.67 (s, 6H), 3.85 (s, 6H), 6.34 (d, J = 12 Hz, 2H), 6.99 (d, J = 8.0 Hz, 2H), 7.14 (s, 2H), 7.29 (d, J = 8.0 Hz, 2H), 8.23 (d, J = 12 Hz, 2H). 13C NMR (100 MHz, DMSO-d6) δ 27.05, 31.96, 49.88, 56.33, 99.74, 109.36, 112.76, 114.07, 121.81, 136.50, 143.49, 146.18, 158.51, 173.76. TOF HRMS m/z [M]+ calcd for [C29H34N2O2Cl]+ 477.2309; found 477.2327.
2-((1E,3E,5E)-3-Bromo-5-(5-methoxy-1,3,3-trimethylindolin-2-ylidene)penta-1,3-dien-1-yl)-5-methoxy-1,3,3-trimethyl-3H-indol-1-ium Iodide (33)
Yield 55%, mp 214–216 °C; 1H NMR (400 MHz, DMSO-d6): δ 1.69 (s, 12H), 3.63 (s, 6H), 3.81 (s, 6H), 6.18 (d, J = 12 Hz, 2H), 6.97 (d, J = 8.0 Hz, 2H), 7.35 (s, 2H), 7.40 (d, J = 8 Hz, 2H), 8.38 (d, J = 12 Hz, 2H). 13C NMR (100 MHz, DMSO-d6): δ 26.20, 31.16, 49.13, 55.53, 101.20, 108.56, 112.00, 113.28, 114.41, 135.67, 142.68, 147.32, 157.72, 173.09. TOF HRMS m/z [M]+ calcd for [C29H34N2O2Br]+ 521.1804 found 521.1801.
5,7,7-Trimethyl-6-((1E,3E,5Z)-5-(5,7,7-trimethyl-5H-[1,3]dioxolo-[4,5-f ]indol-6(7H)-ylidene)penta-1,3-dien-1-yl)-7H-[1,3]dioxolo[4,5-f ]indol-5-ium Iodide (36)
Yield 38%, 1H NMR (400 MHz, DMSO-d6) δ: 1.63 (s, 12H), 3.54 (s, 6H), 6.06 (s, 4H), 6.18 (d, J = 16.0 Hz, 2H), 6.46 (t, J = 16.0 Hz, 1H), 7.13 (s, 2H), 7.28 (s, 2H), 8.16 (t, J = 15 Hz, 2H). 13C NMR (100 MHz, DMSO-d6) δ: 27.59, 31.89, 49.29, 94.35, 102.18, 103.40, 104.03, 125.11, 134.93, 137.52, 145.55, 148.02, 152.68, 173.32. TOF HRMS m/z [M]+ calcd for [C29H31O4N2]+ 471.2278 found 471.2268.
6-((1E,3E,5E)-3-Chloro-5-(5,7,7-trimethyl-5,7-dihydro-6H-[1,3]-dioxolo[4,5-f ]indol-6-ylidene)penta-1,3-dien-1-yl)-5,7,7-trimethyl-7H-[1,3]dioxolo[4,5-f ]indol-5-ium (37)
Yield 39%, 1H NMR (400 MHz, DMSO-d6) δ: 1.66 (s, 12H), 3.63 (s, 6H), 6.10 (s, 4H), 6.21 (d, J = 13.6 Hz, 2H), 7.29 (s, 2H), 7.38 (s, 2H), 8.30 (d, J = 13.6 Hz, 2H). 13C NMR (100 MHz, DMSO-d6) δ: 27.10, 32.20, 49.70, 94.92, 100.10, 102.34, 104.12, 135.49, 137.25, 146.04, 146.12, 148.10, 174.41. TOF HRMS m/z [M]+ calcd for [C29H30N2O4Cl]+ 505.1894 found 505.1871.
6-((1E,3E,5E)-3-Bromo-5-(5,7,7-trimethyl-5,7-dihydro-6H-[1,3]-dioxolo[4,5-f ]indol-6-ylidene)penta-1,3-dien-1-yl)-5,7,7-trimethyl-7H-[1,3]dioxolo[4,5-f ]indol-5-ium (38)
Yield 27%, 1H NMR (400 MHz, DMSO-d6) δ: 1.66 (s, 12H), 3.62 (s, 6H), 6.10 (s, 4H), 6.21 (d, J = 13.6 Hz, 2H), 7.29 (s, 2H), 7.39 (s, 2H), 8.36 (d, J = 13.6 Hz, 2H). 13C NMR (100 MHz, DMSO-d6) δ: 27.08, 32.20, 49.76, 94.94, 102.34, 104.14, 113.95, 135.50, 137.22, 146.16, 146.16, 148.02, 174.59. TOF HRMS m/z [M]+ calcd for [C29H30N2O4Br]+ 549.1389 found 549.1368.
Supplementary Material
Acknowledgments
This study was supported by a Georgia State University dissertation grant to E.A.O. M.H. wishes to thank the Brains and Behavior Grant, the Health Innovation Grant and the Georgia Research Alliance Grant for their financial support. H.S.C. thanks the NIH/NIBIB grant #R01-EB-011523 for their support. E.A.O. was supported through a predoctoral fellowship from the Center for Diagnostics and Therapeutics (CDT). H.H. was financially supported by Chonnam National University (2015). Thank you Andrew Levitz and Nicholas Bruschi for helping with the synthesis.
ABBREVIATIONS USED
- NIR
near-infrared
- log D
distribution coefficient
- SBR
signal-to-noise ratio
- DMEM
Dulbecco’s modified eagle’s medium
- ANOVA
analysis of variance
Footnotes
Notes
The authors declare no competing financial interest.
The Supporting Information is available free of charge on the ACS Publications website at DOI: 10.1021/acs.jmedchem.6b00038.
instrumentation, general methods, synthetic procedures, and NMR and MS spectra (PDF)
SMILES information (CSV)
References
- 1.Yokoyama J, Fujimaki M, Ohba S, Anzai T, Yoshii R, Ito S, Kojima M, Ikeda K. A feasibility study of NIR fluorescent image-guided surgery in head and neck cancer based on the assessment of optimum surgical time as revealed through dynamic imaging. OncoTargets Ther. 2013;6:325–330. doi: 10.2147/OTT.S42006. [DOI] [PMC free article] [PubMed] [Google Scholar]
- 2.Ris F, Hompes R, Cunningham C, Lindsey I, Guy R, Jones O, George B, Cahill RA, Mortensen NJ. Near-infrared (NIR) perfusion angiography in minimally invasive colorectal surgery. Surg Endosc. 2014;28:2221–2226. doi: 10.1007/s00464-014-3432-y. [DOI] [PMC free article] [PubMed] [Google Scholar]
- 3.Li C, Cao L, Zhang Y, Yi P, Wang M, Tan B, Deng Z, Wu D, Wang Q. Preoperative detection and intraoperative visualization of brain tumors for more precise surgery: a new dual-modality MRI and NIR nanoprobe. Small. 2015;11:4517–4525. doi: 10.1002/smll.201500997. [DOI] [PubMed] [Google Scholar]
- 4.Zhu N, Huang CY, Mondal S, Gao S, Huang C, Gruev V, Achilefu S, Liang R. Compact wearable dual-mode imaging system for real-time fluorescence image-guided surgery. J Biomed Opt. 2015;20:96010. doi: 10.1117/1.JBO.20.9.096010. [DOI] [PMC free article] [PubMed] [Google Scholar]
- 5.Chan HH, Siewerdsen JH, Vescan A, Daly MJ, Prisman E, Irish JC. 3D rapid prototyping for otolaryngology-head and neck surgery: applications in image-guidance, surgical simulation and patient-specific modeling. PLoS One. 2015;10:e0136370. doi: 10.1371/journal.pone.0136370. [DOI] [PMC free article] [PubMed] [Google Scholar]
- 6.Zheng J, Muhanna N, De Souza R, Wada H, Chan H, Akens MK, Anayama T, Yasufuku K, Serra S, Irish J, Allen C, Jaffray D. A multimodal nano agent for image-guided cancer surgery. Biomaterials. 2015;67:160–168. doi: 10.1016/j.biomaterials.2015.07.010. [DOI] [PubMed] [Google Scholar]
- 7.Ramakrishnan VR, Kingdom TT. Does image-guided surgery reduce complications? Otolaryngol Clin North Am. 2015;48:851–859. doi: 10.1016/j.otc.2015.05.011. [DOI] [PubMed] [Google Scholar]
- 8.Al-Qudah M. Image-guided sinus surgery in sinonasal pathologies with skull base/orbital erosion. J Craniofac Surg. 2015;26:1606–1608. doi: 10.1097/SCS.0000000000001841. [DOI] [PubMed] [Google Scholar]
- 9.Xi L, Jiang H. Image-guided surgery using multimodality strategy and molecular probes. Wiley Interdiscip Rev Nanomed Nanobiotechnol. 2016;8:46–60. doi: 10.1002/wnan.1352. [DOI] [PubMed] [Google Scholar]
- 10.Njiojob CN, Owens EA, Narayana L, Hyun H, Choi HS, Henary M. Tailored near-infrared contrast agents for image guided surgery. J Med Chem. 2015;58:2845–2854. doi: 10.1021/acs.jmedchem.5b00253. [DOI] [PMC free article] [PubMed] [Google Scholar]
- 11.Hill TK, Abdulahad A, Kelkar SS, Marini FC, Long TE, Provenzale JM, Mohs AM. Indocyanine green-loaded nanoparticles for image-guided tumor surgery. Bioconjugate Chem. 2015;26:294–303. doi: 10.1021/bc5005679. [DOI] [PMC free article] [PubMed] [Google Scholar]
- 12.Liang CH, Di WY, Ren JP, Zhou FM, Hu Y, Mao HJ, Han DM. Imaging, clinical and pathological features of salivary gland adenolymphoma. Eur Rev Med Pharmacol Sci. 2014;18:3638–3644. [PubMed] [Google Scholar]
- 13.Santhanam P, Oakley C. Pet imaging of the adrenal gland-utility and pitfalls. Endocr Pract. 2014;20:375–377. doi: 10.4158/EP13356.CO. [DOI] [PubMed] [Google Scholar]
- 14.Sumi M, Van Cauteren M, Sumi T, Obara M, Ichikawa Y, Nakamura T. Salivary gland tumors: use of intravoxel incoherent motion MR imaging for assessment of diffusion and perfusion for the differentiation of benign from malignant tumors. Radiology. 2012;263:770–777. doi: 10.1148/radiol.12111248. [DOI] [PubMed] [Google Scholar]
- 15.Hyun H, Park MH, Owens EA, Wada H, Henary M, Handgraaf HJ, Vahrmeijer AL, Frangioni JV, Choi HS. Structure-inherent targeting of near-infrared fluorophores for parathyroid and thyroid gland imaging. Nat Med. 2015;21:192–197. doi: 10.1038/nm.3728. [DOI] [PMC free article] [PubMed] [Google Scholar]
- 16.Owens EA, Hyun H, Tawney JG, Choi HS, Henary M. Correlating molecular character of NIR imaging agents with tissue-specific uptake. J Med Chem. 2015;58:4348–4356. doi: 10.1021/acs.jmedchem.5b00475. [DOI] [PMC free article] [PubMed] [Google Scholar]
- 17.Owens EA, Lee S, Choi J, Henary M, Choi HS. NIR fluorescent small molecules for intraoperative imaging. Wiley Interdiscip Rev Nanomed Nanobiotechnol. 2015;7:828–838. doi: 10.1002/wnan.1337. [DOI] [PMC free article] [PubMed] [Google Scholar]
- 18.Wada H, Hyun H, Vargas C, Gravier J, Park G, Gioux S, Frangioni JV, Henary M, Choi HS. Pancreas-targeted NIR fluorophores for dual-channel image-guided abdominal surgery. Theranostics. 2015;5:1–11. doi: 10.7150/thno.10259. [DOI] [PMC free article] [PubMed] [Google Scholar]
- 19.Salim MM, Owens EA, Gao T, Lee JH, Hyun H, Choi HS, Henary M. Hydroxylated near-infrared BODIPY fluorophores as intracellular pH sensors. Analyst. 2014;139:4862–4873. doi: 10.1039/c4an01104j. [DOI] [PMC free article] [PubMed] [Google Scholar]
- 20.Park MH, Hyun H, Ashitate Y, Wada H, Park G, Lee JH, Njiojob C, Henary M, Frangioni JV, Choi HS. Prototype nerve-specific near-infrared fluorophores. Theranostics. 2014;4:823–833. doi: 10.7150/thno.8696. [DOI] [PMC free article] [PubMed] [Google Scholar]
- 21.Choi HS, Nasr K, Alyabyev S, Feith D, Lee JH, Kim SH, Ashitate Y, Hyun H, Patonay G, Strekowski L, Henary M, Frangioni JV. Synthesis and in vivo fate of zwitterionic near-infrared fluorophores. Angew Chem, Int Ed. 2011;50:6258–6263. doi: 10.1002/anie.201102459. [DOI] [PMC free article] [PubMed] [Google Scholar]
- 22.Choi HS, Gibbs SL, Lee JH, Kim SH, Ashitate Y, Liu F, Hyun H, Park G, Xie Y, Bae S, Henary M, Frangioni JV. Targeted zwitterionic near-infrared fluorophores for improved optical imaging. Nat Biotechnol. 2013;31:148–153. doi: 10.1038/nbt.2468. [DOI] [PMC free article] [PubMed] [Google Scholar]
- 23.Ashitate Y, Kim SH, Tanaka E, Henary M, Choi HS, Frangioni JV, Flaumenhaft R. Two-wavelength near-infrared fluorescence for the quantitation of drug antiplatelet effects in large animal model systems. J Vasc Surg. 2012;56:171–180. doi: 10.1016/j.jvs.2011.11.058. [DOI] [PMC free article] [PubMed] [Google Scholar]
- 24.Hyun H, Owens EA, Wada H, Levitz A, Park G, Park MH, Frangioni JV, Henary M, Choi HS. Cartilage-specific near-infrared fluorophores for biomedical imaging. Angew Chem, Int Ed. 2015;54:8648–8652. doi: 10.1002/anie.201502287. [DOI] [PMC free article] [PubMed] [Google Scholar]
- 25.Wada H, Hyun H, Vargas C, Genega EM, Gravier J, Gioux S, Frangioni JV, Choi HS. Sentinel Lymph Node Mapping of Liver. Ann Surg Oncol. 2015;22:1147–1155. doi: 10.1245/s10434-015-4601-5. [DOI] [PMC free article] [PubMed] [Google Scholar]
- 26.Hyun H, Wada H, Bao K, Gravier J, Yadav Y, Laramie M, Henary M, Frangioni JV, Choi HS. Phosphonated near-infrared fluorophores for biomedical imaging of bone. Angew Chem, Int Ed. 2014;53:10668–10672. doi: 10.1002/anie.201404930. [DOI] [PMC free article] [PubMed] [Google Scholar]
- 27.Ashitate Y, Hyun H, Kim SH, Lee JH, Henary M, Frangioni JV, Choi HS. Simultaneous mapping of pan and sentinel lymph nodes for real-time image-guided surgery. Theranostics. 2014;4:693–700. doi: 10.7150/thno.8721. [DOI] [PMC free article] [PubMed] [Google Scholar]
Associated Data
This section collects any data citations, data availability statements, or supplementary materials included in this article.