

Reconstituted muscle-like assays reveal novel mechanisms that control the speed of muscle contraction.
Abstract
In vitro motility assays, where purified myosin and actin move relative to one another, are used to better understand the mechanochemistry of the actomyosin adenosine triphosphatase (ATPase) cycle. We examined the relationship between the relative velocity (V) of actin and myosin and the number of available myosin heads (N) or [ATP] for smooth (SMM), skeletal (SKM), and cardiac (CMM) muscle myosin filaments moving over actin as well as V from actin filaments moving over a bed of monomeric SKM. These data do not fit well to a widely accepted model that predicts that V is limited by myosin detachment from actin (d/ton), where d equals step size and ton equals time a myosin head remains attached to actin. To account for these data, we have developed a mixed-kinetic model where V is influenced by both attachment and detachment kinetics. The relative contributions at a given V vary with the probability that a head will remain attached to actin long enough to reach the end of its flexible S2 tether. Detachment kinetics are affected by L/ton, where L is related to the tether length. We show that L is relatively long for SMM, SKM, and CMM filaments (59 ± 3 nm, 22 ± 9 nm, and 22 ± 2 nm, respectively). In contrast, L is shorter (8 ± 3 nm) when myosin monomers are attached to a surface. This suggests that the behavior of the S2 domain may be an important mechanical feature of myosin filaments that influences unloaded shortening velocities of muscle.
INTRODUCTION
The cyclic interactions between actin and myosin associated with the catalysis of adenosine 5´-triphosphate (ATP) hydrolysis are the basis of muscle contraction as well as other processes that generate motion and tension in nonmuscle cells. Understanding the chemistry underlying movement in muscle has relevance to understanding the molecular basis for any movement in all living organisms. However, after more than 50 years of research, it remains unclear which kinetic step or steps in the actin-myosin–catalyzed adenosine triphosphatase (ATPase) reaction generate movement.
In vitro motility assays, where purified myosin and actin move relative to one another, are used to better understand the mechanochemistry of the actomyosin ATPase cycle. These experimental approaches bridge the gap between solution, single-molecule, and intact muscle or cellular studies. For muscle myosin II, the most widely used motility assay provides the velocity (V) of filamentous actin (A) sliding over a bed of monomeric myosin (Mm) attached to a coverslip surface (Fig. 1C) (1–4). Recently, we introduced a variant of this assay in which myosin filaments (Mf; Fig. 1B) move over actin filaments that are attached to a polyethylene glycol (PEG)–coated coverslip surface (Fig. 1D) (5, 6). We previously called this the inverted motility assay, but for clarity, we now use the notation Mf/A, which directly indicates the state of the myosin (monomers versus filaments) in addition to the geometry of the assay. Accordingly, we refer to the standard motility assay as A/Mm. Of the two, the Mf/A assay is the most physiological because myosin II monomers are assembled into filaments, which is the functional structure of myosin II in vivo.
Fig. 1. Kinetic scheme, myosin structures, motility assay geometries, and model predictions.
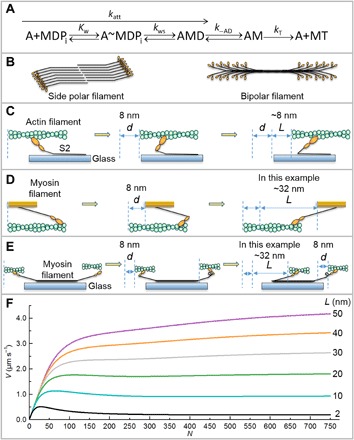
(A) Kinetic scheme for myosin (M) attachment to actin (A). D, ADP; T, ATP; Pi, phosphate. Kw, equilibrium constant for weak binding of myosin to actin; kws, forward rate constant for the weak to strong transition. We assume that −kws is insignificant. See text for other rate constants. (B to E) None of the cartoons are to scale. (B) Side polar (smooth muscle) and bipolar myosin filaments (skeletal and cardiac muscle), heads (orange), and tails (black). (C) A/Mm assay with actin filament (green) being moved by myosin heads (orange) attached to coverslip (blue). Only the S2 region of the tail (black) is shown. Before the working step (left), after the working step (middle), and after the fullest possible extension of S2 (right) by other heads undergoing the working steps (not shown for clarity). In this example, d = L = 8 nm. (D) Mf/A assay (5, 6), myosin filament (orange) moves over biotinylated actin (green) attached to PEG brush-coated coverslip (not shown). Pre-working step (left), post-working step (middle), and after full extension of S2 (right) by other working heads (not shown) giving L = 32 nm in this example. This head is now a drag head and therefore must detach from actin before further movement of the filament is possible. See movies S1 and S2 and the study of Brizendine et al. (6) for a more complete description. (E) A/Mf assay, a portion of a bipolar biotinylated myosin filament (black) attached via streptavidin to a biotinylated PEG brush-coated coverslip with physiological or fast (left) and nonphysiological or slow head-actin interactions (right). The slow heads need to spin or swivel to attach to actin, represented by a loop in the S2 domain, but the mechanism is unknown. Table 2 shows that L for the slow heads is finite, but the structural basis is unknown and therefore not depicted. (F) Mixed-kinetic model predictions at varying L’s. Plots predicted by Eq. 5 for katt = 6 s−1, d = 8 nm, k−AD = 100 s−1, kT = 2 μM−1 s−1, [ATP] = 1 mM. Please see Methods for an Excel spreadsheet link to generate additional curves.
Each type of motility assay has its strengths and weaknesses. For example, myosin subfragments such as S1 and heavy meromyosin (HMM), which lack all or a portion of the tail domain, can be studied using the A/Mm assay. These subfragments are soluble and easier to express than full-length myosin and thus allow the study of the effects of mutations (7–11). In contrast, the Mf/A assay requires myosin with a full-length tail domain, the C-terminal portion of which contains the structural requirements for self-assembly into filaments. Also, the A/Mm assay can be modified to study the effects of a mechanical load on the kinetic cycle (12–15), whereas the Mf/A assay has not yet been similarly modified.
For both assays, the unloaded velocity (V) of the moving protein (A or Mf) is a key parameter that reflects how myosins couple chemical energy to motion. A widely accepted model that has been used extensively to fit A/Mm assay data (16, 17) predicts that V increases with N (the number of available myosin heads) but is limited at high N by the rate of detachment of myosin heads from actin. However, several studies using the A/Mm assay are inconsistent with this model: (i) Measured V exceeds predicted V (5, 18–20), and (ii) recombinant HMM and S1 with decreased k−AD do not always show a corresponding decrease in V (4, 21). The detachment-limited model also poorly fits the V dependence on N of smooth muscle myosin (SMM) measured with the Mf/A assay (6). Therefore, we proposed a novel mixed-kinetic model (6), which describes V as being influenced by both attachment and detachment kinetics (see movies S1 and S2). It predicts that within the myosin filament, and to a lesser extent as monomers attached to the surface, the S2 region (tail proximal to the heads) can be pulled backward by other working heads. At low N, this places minimal drag loads on the working heads of the moving filament. This allows V to be influenced primarily by the rate of attachment of myosin to actin (katt; Fig. 1A). With increasing N, a sufficiently high V is reached to pull an attached head to the end of its S2 tether, resulting in a drag load that resists the working heads (Fig. 1D, right). These drag heads must detach from actin before the working heads can further move the filament. This leads to V being influenced by both attachment and detachment kinetics. Here, detachment kinetics are affected not by d but by a distance parameter, L, related to the distance the S2 tether can travel without placing a drag load on the moving filament (Fig. 1, C and D). A model-dependent analysis of our data implies L>>d to account for the SMM filament V at high N and is consistent with direct measurements of S2 nonlinear compliance in skeletal muscle myosin (SKM) filaments (22, 23). It also implies that L is shorter in the A/Mm assay than in the Mf/A assay because myosin monomers attached to the surface lead to S2-surface interactions that constrain the movement and native interactions of S2 (Fig. 1C).
If the mixed-kinetic model is correct, it should adequately fit data from A/Mm and Mf/A assays using any type of myosin II under a wide array of experimental conditions. To test this, we have extended our original work on SMM, which forms side polar filaments, to include both rabbit fast SKM and bovine ventricular β-cardiac muscle myosin (β-CMM), which both form bipolar filaments (Fig. 1B). V versus N data at different [ATP] from the Mf/A and A/Mm assays were collected under identical conditions. For the Mf/A assay, N was changed by varying the length of the myosin filament and by varying the number of heads on a filament by diluting the full-length myosin with myosin rods lacking the head domain. For the A/Mm assay, N was varied by changing the concentration of myosin applied to the coverslip surface. Using an on-coverslip ATPase assay, we established the relationship between the density of active myosin heads on the surface (N) and the applied myosin concentration over a wide range (50 to 400 μg ml−1). In addition, we report a new twist on the Mf/A assay in which the geometry is flipped over, that is, an A/Mf assay (Fig. 1E) where the myosin filaments are attached to a PEG surface. Fits to the detachment-limited and mixed-kinetic models are compared. Only the mixed-kinetic model adequately accounts for data using values of kinetic constants from the literature. This was true for data from all three assay types. The results of this study confirm our original findings and predictions that L is longer in moving myosin filaments and shorter if myosin monomers are attached to a nitrocellulose-coated surface. This suggests that the unhindered movement of the S2 domain of myosin filaments is an important structural feature that allows myosin to move faster along actin filaments.
RESULTS
Detachment-limited model
Equations 1 to 3 describe the detachment-limited model (16, 17). The rate of detachment of myosin from actin is ton−1 = kdet. This corresponds to the rate of adenosine 5′-diphosphate (ADP) release from actomyosin (k−AD) at high [ATP] (24) or the rate of attachment of ATP (kT·[ATP]) to actomyosin (25) at low [ATP] (Fig. 1A). Here, r is the fraction of the ATPase cycle time that myosin spends in the strongly bound states (duty ratio, Eq. 2; AMD and AM in Fig. 1A), k−AD is the rate of ADP dissociation from actomyosin or a slower isomerization immediately preceding ADP release, katt includes attachment of myosin to actin as a weakly bound complex (Kw) and the rate of the weak to strong transition (Fig. 1A), d is the myosin step size, N is the number of myosin heads available to attach to the actin filament, and kT is the rate of ATP binding to actomyosin. See Fig. 1A for the kinetic scheme.
| (1) |
| (2) |
| (3) |
Fitting a detachment-limited model to V versus N data from the Mf/A assay
Figure 2 (A to C) shows the relationship between V and N for three different types of myosin filaments. Colors of data points refer to different preparations designed to vary N (see Fig. 2 legends). Data from the Mf/A assay for SMM (Fig. 2A) are replotted from Brizendine et al. (6), and data for CMM (Fig. 2B) and SKM (Fig. 2C) are from this study (see movies S3 and S4 for representative filament motility). Fits to Eq. 1 with d fixed at 8 nm are shown by the dashed lines, and predictions with d, r, and k−AD fixed to literature values are shown by the blue lines. See Table 1 for a summary of fit parameters and how they compare to literature parameters.
Fig. 2. Detachment-limited model (Eq. 1) and mixed-kinetic model (Eq. 5) fits to N dependence of filament velocities (V) at saturating [ATP].
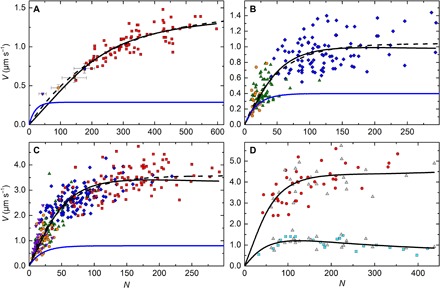
All experiments were performed in the observation buffer at 30°C. (A) SMM filaments moving in the Mf/A assay at 0.75 to 2.0 mM ATP from Brizendine et al. (6). Purple triangles, 26% SMM co-filaments, n = 10; orange circles, 51% SMM co-filaments; green triangles, 75% SMM co-filaments; blue diamond, rapidly diluted (short) SMM filaments; each point is the average V and N from 10 individual filament trajectories, and error bars show the SD. Red squares, SMM filaments prepared by dialysis; each point (n = 82) is V of a single filament trajectory. (B) CMM filaments moving in the Mf/A assay at 0.75 to 2.0 mM ATP. Blue diamonds, CMM filaments, n = 95; green triangles, 50% CMM co-filaments, n = 62; orange circles, 30% CMM co-filaments, n = 19. (C) SKM filaments moving in the Mf/A assay at 0.75 to 2.0 mM ATP. Purple triangles, 25% SKM co-filaments, n = 38; orange circles, 50% SKM co-filaments, n = 47; green triangles, 75% SKM co-filaments, n = 41; blue diamonds, SKM filaments prepared by rapid dilution (short), n = 122; red squares, SKM filaments prepared by dialysis. Each point (n = 102) is V of a single filament trajectory. For (A) to (C): Fits to Eq. 1 with d fixed at 8 nm (dashed lines) and d = 8 nm, r = 0.05, and k−AD = 36, 50, and 100 s−1, respectively, for (A), (B), and (C) (blue). See Table 1 for a summary of fit parameters. (D) V of actin moving on SKM filaments in the A/Mf assay at 1 mM ATP. Gray triangles, fast and slow V measured from a single actin filament trajectory moving across a single myosin filament (n = 25); red circles, V from a single actin filament trajectory (n = 42); cyan squares, V from a single actin filament trajectory (n = 21). All plots show a fit to Eq. 5 (black lines). See Table 2 for a summary of fit parameters.
Table 1. Results of fitting Eq. 1 to filament V versus N data with d fixed at 8 nm.
Data from Fig. 2 (A to C) were fit to Eq. 1 to obtain k−AD and r, which were used to calculate katt and v using Eqs. 2 and 6. For k−AD and r, the ± is the SE of the least-squares fit. Errors for katt and v were propagated.
| Parameters | Measured or literature value | Reference | Values resulting from fit (Fig. 2, A to C, dashed lines) |
| SMM | Fig. 2A | ||
| r | 0.05 | (33) | 0.0042 ± 0.0004 |
| k−AD (s−1) | 36 ± 5 | (40) | 197 ± 8 |
| katt (s−1) | 1.89* | 0.83 ± 0.09 | |
| vmax (s−1 head−1) | 0.49 ± 0.01 | (5) | 0.83 ± 0.08† |
| kT | 0.5 ± 0.01 | (5) | |
| CMM | Fig. 2B | ||
| r | 0.05 | (33) | 0.019 ± 0.002 |
| k−AD (s−1) | 50 | (32, 36–39) | 139 ± 4 |
| katt (s−1) | 2.6* | 2.69 ± 0.25 | |
| vmax (s−1 head−1) | 1.5 ± 0.1 | Fig. S1A | 2.6 ± 0.2† |
| kT | 1.1 ± 0.1 | Fig. S1C | |
| SKM | Fig. 2C | ||
| r | 0.05 | (33) | 0.0200 ± 0.0009 |
| k−AD (s−1) | 100 ± 8 | (20) | 575 ± 8 |
| katt (s−1) | 5.3* | 11.3 ± 0.6 | |
| vmax (s−1 head−1) | Range, 8–20 | Fig. S1B, (29–31) | 11.0 ± 0.5† |
| kT | 1.9 ± 0.1 | Fig. S1C |
Mixed-kinetic model
The mixed-kinetic model describes V as being influenced by both attachment and detachment kinetics (see movie S2). The relative contributions of the two vary with the probability (p) that a head will remain attached to actin long enough to reach the end of its S2 tether (distance dictating the length parameter, L) at a given V (Eq. 4)
| (4) |
Equation 5 describes the mixed-kinetic model, which contains two terms, each preceded by a probability function
| (5) |
At any instant, the probability that a given myosin head is not at the end of its S2 tether is 1 − p, and the probability that none of N myosin heads are at the ends of their tethers is (1 − p)N. At low N, this probability is nearly 1, and V is dictated primarily by the first term. Under this condition, V will increase linearly with N (see Fig. 1F). The steepness of the line will depend on the ATPase rate, v, and the step size, d. It is well established that v (26) in myofibrils (27) and in purified actomyosin in solution at high ATP (26, 28) is attachment-limited, controlled by Kw·kws = katt (Fig. 1A) (26). The ATPase rate (v) is related to katt, k−AD, and kT (Fig. 1A) as follows
| (6) |
In Eq. 5, as N increases, the probability that a head out of N heads reaches the end of its tether, 1 − (1 − p)N, increases toward 1, and V is now increasingly influenced by the second term. This term is responsible for the leveling off and/or the biphasic behavior of V after the initial linear phase (Fig. 1F). Figure 1F shows predicted V versus N curves under saturating ATP conditions for a set of hypothetical myosins each with identical kinetic constants but with different L’s. Longer L leads to faster V at maximal N. The magnitude of the second term will depend not only on L and ton but also on the time it takes for a given head to reach the end of its tether, L/(N⋅v⋅d). Therefore, at high N, when L is short and/or v is high, the time needed to reach the end of the tether becomes very small relative to ton. The second term of Eq. 5 then reduces to L/ton, and at this limit, V is completely influenced by detachment kinetics (Eq. 3).
Determination of katt and kT
To obtain an estimate for katt in Eq. 6, we measured the actin dependence of the steady-state ATPase at saturating [ATP] under the same conditions used for all three motility assays (filament buffer at 30°C). The maximal ATPase at saturating actin, vmax, is essentially the same as katt at high [ATP] (26, 28). Figure S1A shows the data for CMM S1, giving KATPase = 40 ± 9 μM and vmax = 1.5 ± 0.1 s−1 (±SEM). As expected at this relatively high ionic strength, the corresponding data for SKM S1 (fig. S1B) poorly define both KATPase and vmax because we were unable to work at [actin] > KATPase (29). We estimate that the vmax was ~8 to 20 s−1, roughly what others have estimated under similar conditions but at lower ionic strengths (29–31).
The rate of ATP binding to actomyosin, kT (Fig. 1A), during filament motion should be very similar to solution-derived values under the same conditions. Figure S1C shows a plot of the rate of ATP binding to actomyosin (kobs) versus [ATP], and a linear fit gave kT = 1.9 ± 0.1 μM−1 s−1 for SKM S1 and 1.8 ± 0.1 μM−1 s−1 for SKM filaments, both of which are in good agreement with a previous work (24). The value for CMM S1, kT = 1.1 ± 0.1 μM−1 s−1, is in good agreement with that by Siemankowski and White (32).
SKM V versus N data from A/Mm assays
To examine the relationship between V and N with monomeric myosin, varying concentrations of SKM were applied to flow cells and A/Mm assays were performed. The resulting densities of active surface-attached myosin heads were estimated from on-slide ATPase activities (see Methods and Supplementary Methods) and were converted to N, which is defined as the number of myosin heads available to interact with a 1-μm-long actin filament (17). The relationship between the concentration of SKM applied to the flow cell and N is shown in Fig. 3A, giving 0.34 N ml μg−1. Data from Harris and Warshaw (17) (Fig. 3A, black squares) are similar.
Fig. 3. A/Mm data for SKM.
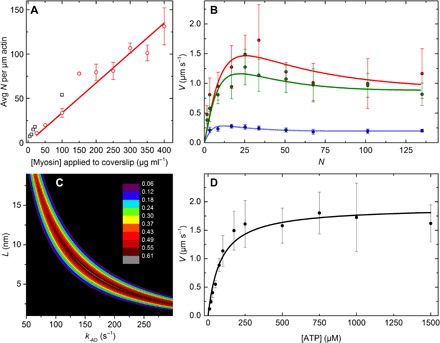
All experiments were performed in the observation buffer at 30°C. (A) Relationship between [myosin] applied to the coverslip (μg ml−1) and N. Red points are averages of two to six independent experiments; error bars show the SD; the red line is a linear fit, slope = 0.34 N ml μg−1. Black squares, data from Harris and Warshaw (17). (B) N dependence of V at 1 mM (red), 100 μM (green), and 20 μM ATP (blue). N values correspond to applied SKM concentrations between 5 and 400 μg ml−1. (C) Contour plot of L versus k−AD showing dependence of R2 values from the fit to 1000 μM ATP data from (B) (see fig. S2 for plots of 20 and 100 μM ATP data). Color scale shows the range of R2 values. (D) ATP dependence of V at N = 34 (100 μg ml−1). For (B) and (D), each point is an average of 40 individual actin filament trajectories, and error bars show the SD. Respective lines show the best fits to Eq. 5.
Figure 3B shows the relationship between V and N at 20, 100, and 1000 μM [ATP]. Figure 3D shows the ATP dependence of V at N = 34 (100 μg ml−1 myosin). Data in Fig. 3 (B and D) were fit to Eq. 5, fixing katt = 10 to 20 s−1, d = 8 nm, and kT to the value from fig. S1C (1.9 μM−1 s−1). These results are summarized in Table 2.
Table 2. Summary of fitting parameters to data from Figs. 2 to 4 using Eq. 5.
For each fitted value, the ± is the SE of the least-squares fit. For average values, the ± is the SD. For all fits to SKM filament data, fixed values are as follows: kT = 1.9 μM−1 s−1 (from fig. S1C), d = 8 nm, and k−AD = 190 s−1 (from Fig. 3C and fig. S2). For all fits to CMM data, fixed values are as follows: kT = 1.1 μM−1 s−1 (from fig. S1C), d = 8 nm, and k−AD = 50 s−1 (32, 36–39).
| Assay type | Experiment |
Figure no./ reference |
Parameters | L (average) | |
| k−AD (s−1) | L (nm) | ||||
| A/Mm | SKM 1 mM ATP V vs. N* | Fig. 3B | 193 ± 94 | 5 ± 4 | 8 ± 3 |
| SKM 100 μM ATP V vs. N* | Fig. 3B | 238 ± 123 | 9 ± 3 | ||
| SKM 20 μM ATP V vs. N† | Fig. 3B | 140 ± 96 | 7 ± 1 | ||
| SKM V vs. ATP* | Fig. 3D | 169 ± 31 | 11 ± 2 | ||
| Filament assays | katt (s−1) | L (nm) | L (average) | ||
| Mf/A | SMM V vs. N‡ | Fig. 2A and (6) | 0.6 ± 0.1 | 59 ± 3 | 59 ± 3 |
| SKM V vs. N | Fig. 2C | 7.0 ± 0.2 | 22 ± 1 | 22 ± 9|| | |
| SKM V vs. ATP§ | Fig. 4A | 14.0 ± 9.6 | 14 ± 1 | ||
| CMM V vs. N | Fig. 2B | 2.0 ± 0.1 | 24 ± 1 | 22 ± 2 | |
| CMM V vs. ATP¶ | Fig. 4B | 2.8 ± 3.0 | 20 ± 1 | ||
| A/Mf | SKM fast | Fig. 2D | 7.1 ± 0.6 | 31 ± 1 | |
| SKM slow | Fig. 2D | 3.1 ± 0.4 | 4 ± 0 | ||
*katt was fixed at 20 s−1 (30).
†katt was fixed at 10 s−1 (30).
‡From Brizendine et al. (6), refit to Eq. 5 with fixed parameters k−AD = 36 s−1, kT = 0.5 μM−1 s−1, and d = 8 nm.
§N was fixed at 88 based on average filament length and Eq. 7.
||Average includes L from the fast heads in the A/Mf assay.
¶N was fixed at 113 as above.
Using these same fixed parameters for the fit to the 1 mM ATP data from Fig. 3B, a contour plot of R2 values resulting from additionally fixing k−AD while letting L float (or vice versa) is shown in Fig. 3C. Figure 3C is similar to corresponding plots (see fig. S2) for the 0.1 and 0.01 mM ATP data from Fig. 3B. All contour plots showed that the range of maximal R2 values is well constrained, giving L = 5 to 9 nm and k−AD = 100 to 250 s−1. The best global estimate for k−AD and L was determined by average. This gave k−AD = 190 s−1, which was fixed in fitting the mixed-kinetic model to the filament data in Figs. 2 (C and D) and 4A, and L = 8 ± 3.
A similar analysis for CMM was not possible because no directed motion was observed. Therefore, k−AD was fixed to 50 s−1 for the fits shown in Figs. 2B and 4B (see Discussion).
Fitting the mixed-kinetic model to filament V versus N data
Figure 2 shows the fits of the mixed-kinetic model to SMM, CMM, and SKM filament V versus N data. The black solid lines are the fits to the data using Eq. 5 with d, kT, and k−AD fixed, whereas katt and L were left to float (see Table 2). Figure 2 (A to C) shows data from the Mf/A assay, where each data point is colored according to experimental preparations of the myosin filaments, which include rod co-filaments and filaments made by dialysis and rapid dilution protocols (see Methods).
A potential limitation of using the Mf/A assay with bipolar filaments (Fig. 1B) is that an actin filament may be interacting not only with myosin heads oriented in the normal direction for motion (fast heads) but also with heads of opposite polarity (slow heads) during a given trajectory. To evaluate the possible effects of slow heads, we flipped the Mf/A assay over (Fig. 1E; A/Mf assay). SKM filaments containing a small percentage of biotinylated myosin were attached to the same PEG-treated surface used for the Mf/A assay. As expected for bipolar filaments, trajectories from single actin filaments moving across a single myosin filament showed fast and slow velocities, moving toward or away from the myosin filament center, respectively (see movie S5 and fig. S4). Equation 5 was used to fit both the presumed physiological (fast) V (Fig. 2D, upper data) and the slow V (Fig. 2D, lower data). The results of the fits (black lines) are summarized in Table 2.
Fitting the mixed-kinetic model to filament V versus ATP data
To further test the model, Mf/A assays were performed at varying [ATP] with SKM (Fig. 4A) and CMM (Fig. 4B) filaments formed by rapid dilution, which gives a narrow length distribution. The respective N values were calculated from the average filament lengths using Eq. 7, giving N = 88 ± 29 and 113 ± 58. Equation 5 was fit to both data sets while fixing k−AD, kT, N, and d and letting katt and L float. See Table 2 for a summary of the fit parameters.
Fig. 4. ATP dependence of filament V at fixed N from the Mf/A assay.
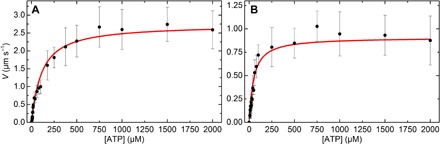
(A) SKM filaments formed by rapid dilution. (B) CMM filaments formed by rapid dilution. For both plots, each point is an average of 40 individual trajectories. Error bars show the SD. Red lines show the fits to Eq. 5 (see Table 2 for results). R2 = 0.95 and 0.96, respectively. All experiments were performed in the observation buffer at 30°C.
DISCUSSION
Fitting the detachment-limited model to data from the Mf/A assay
Using kinetic constants from the literature (Table 1), it is clear that the V predicted by Eq. 1 (Fig. 2, blue lines) is significantly lower than the observed data at high N for all three types of myosin filaments. If d is fixed to 8 nm, the resulting fits (dashed lines) give kinetic values that do not agree well with literature values (Table 1). Specifically, r is too low by a factor of 2 to 12 (33). The fitted k−AD for SKM (575 ± 8 s−1) is similar to estimates of 400 to 500 s−1 (24) from stopped-flow measurements in which ADP is mixed directly with actomyosin. However, in motility assays, the myosin heads go through the entire ATPase cycle before ADP is released. Therefore, a better estimate for k−AD comes from single-molecule measurements of the ATP dependence of ton, which likely include an additional slower isomerization step that occurs before ADP release (31, 34, 35). This value is 100 s−1 (20) for SKM, which is 4.5-fold slower than the fitted k−AD mentioned above. For CMM, the fitted value of k−AD (139 ± 4 s−1) (Table 1) is too fast by a factor of ~2, considering that both stopped-flow and single-molecule determinations of k−AD are relatively similar at ~50 to 80 s−1 (32, 36–39). For SMM, the fitted value of 197 s−1 is considerably faster than our previously measured value of 21 s−1 (5), as well as single-molecule determinations of 36 s−1 under similar conditions (40). In summary, the best fits to a detachment-limited model generally require r to be lower and k−AD to be higher than measured values.
Fitting the mixed-kinetic model to data from the A/Mm assay with SKM to estimate k−AD and L
Because of the direct inverse relationship between k−AD and L in Eq. 5, fits to the data in Fig. 2 are not useful to constrain either parameter. Contour plots (fig. S3) show that the range of maximal R2 values is less well constrained than the mixed-kinetic model fits to the A/Mf assay data (Fig. 3C and fig. S2), giving relatively broad ranges for k−AD and L. Therefore, because L is an unknown, it was necessary to fix k−AD in fitting Eq. 5 to Mf/A assay data in Fig. 2.
To get the best estimate of k−AD for this purpose, we turned to the A/Mm assay, which has several advantages. First, we predict L to be short due to interactions of S2 with the coverslip surface (Fig. 1C), giving slower V and a distinct shape of V versus N plots (Fig. 1F). Second, estimates of N do not require manually measuring filament lengths, a potential source of variability for the filament-based motility assays. It is not necessary to measure actin lengths in the A/Mm assay, because only actin filaments above 1 μm are analyzed, and due to the persistence length of actin, actin filaments longer than 1 μm do not move any faster (16).
Figure 3B shows A/Mm data at varying N and three [ATP]. The data followed the characteristic shape predicted by the mixed-kinetic model (Fig. 1F), which is unaccounted for by Eq. 1, which simply plateaus (Fig. 2, blue lines). Our approach to constraining k−AD was to find the maximum of the R2 values (Fig. 3C and fig. S2) from fitting all three curves and use the average. This gave k−AD = 190 ± 49 s−1, which is in good agreement with the 100 s−1 obtained from single-molecule experiments (20) and reasonably close to an estimated value (300 s−1) from modeling of solution kinetics (31). Fitting Eq. 5 to V versus ATP data from the A/Mf assay (Fig. 3D) provided a further test of the model. As predicted, the average resulting L from all V versus N and V versus [ATP] fits was significantly shorter (8 ± 3 nm) than our previously determined L = 36 to 67 nm for SMM filaments moving in the Mf/A assay (6).
Unfortunately, a parallel analysis of A/Mm assay data for CMM was not possible because no directed motion was observed in the filament buffer at 125 or 75 mM KCl, both of which are higher in ionic strength than published conditions used for CMM A/Mm assays (25 mM KCl) (41–43). Perhaps CMM has more ionic interactions with actin than SKM (44), making it more sensitive to increased ionic strength. Regardless, because stopped-flow and laser trap studies both estimate k−AD of CMM at ~50 to 80 s−1 under similar conditions to our assays (32, 36–39), an independent determination using A/Mm assay data was not essential to fit the data from filament-based assays (see below).
Fitting the mixed-kinetic model to filament V versus N data
Equation 5 was fit to filament V versus N (Fig. 2, black solid lines) and V versus [ATP] (Fig. 4) data with fixed k−AD = 190 s−1 for SKM from above, 50 s−1 for CMM, and 36 s−1 for SMM (40). The parameters left floating were katt and L (Table 2). Table 1 shows the measured vmax from steady-state ATPase data at high [ATP], which provides an approximation of katt. Note that the fitted katt values in Table 2 are in reasonable agreement with the vmax values. Also, for each respective myosin type, the fitted katt values from V versus N and V versus [ATP] experiments are reasonably consistent. The katt for SKM fast heads from the A/Mf assay (Fig. 2D) matches the fitted katt from the Mf/A assay (Table 2), suggesting that katt of filaments moving in the Mf/A assay is not appreciably affected by potential slow head interactions with actin. Also, note that the katt for the slow heads is significantly slower than the katt for the fast heads (Table 2), which is expected because the slow heads presumably need time to twist to orient themselves correctly to attach to the actin filament (Fig. 1E). Overall, this analysis suggests that the mixed-kinetic model provides katt values that agree with measured values.
Of particular interest is the length of the tether defined by L. For all three myosins moving in the Mf/A assay, L is longer when incorporated into a filament versus attached as monomers to a coverslip surface (Table 2). These relatively long L’s provide the basis for much faster V in the Mf/A assay compared to the A/Mm assay. For example, for SKM, the relative motion of actin and myosin was about threefold faster for filaments (Fig. 2, C and D) versus monomers (Fig. 3B), explained by the long L = 22 ± 9 nm in the filament-based assays compared to the short L = 8 ± 3 nm in the A/Mm assay. Filament V is very close to unloaded shortening V of myofibrils under similar conditions (45, 46). With SMM, we previously used a simple version of the current model to estimate L = 36 to 67 nm (6). Here, we used Eq. 5 to refit the V versus N data, with k−AD fixed to the single-molecule determination value (36 s−1), and found that L = 59 ± 3 nm, consistent with our previous estimates. The fitted values of L for CMM (22 ± 2 nm) and SKM (22 ± 9 nm) were identical.
A potential disadvantage of the Mf/A assay with the bipolar filaments of SKM and CMM (Fig. 1B) is that slow head actin interactions could affect the kinetics or mechanics of the fast heads. If anything, the slow heads would place a nonphysiological load on the fast heads. This is not accounted for in the mixed-kinetic model and therefore may lead to underestimates of L. In the side polar filaments formed by SMM, all the heads involved in actin interactions during motion are oriented in the correct direction, so there are no slow heads that could affect V and thus the measurement of L. This could explain why SMM filaments have a much longer L than both SKM and CMM.
The A/Mf assay provides an advantage over the Mf/A assay because a small actin filament can interact with only fast or slow heads at any given time. This allows an analysis of the fast and slow head V individually, whereas in the Mf/A assay, they may be operating simultaneously. In addition, the A/Mf geometry provides a robust test of the model because we expected L to be very short for the slow heads, a prediction that is verified by the fit to Eq. 5 (Fig. 2D, lower data), where L was 4 nm. As stated above, these slow heads must swivel or twist to stereochemically interact with actin, affecting both katt and severely limiting the distance the S2 region could travel (see Fig. 1E).
If myosin filaments moving in the Mf/A assay are not significantly affected by a load from slow heads, they should move at the same V as the fast heads in the A/Mf assay. Fast head V was marginally faster (~20%; Fig. 2D, upper data) than the maximal V from the Mf/A assay (Fig. 2C), corresponding to a higher L = 31 ± 1 (Table 2). It is then tempting to conclude that the slow heads have only a small effect on V measured in the Mf/A assay. However, V in the A/Mf assay may plateau at high N without actually reaching the maximum V predicted by our model. A portion of the motion generated by many myosin heads could be “absorbed” by the bending of the longest (>1 μm) actin filaments (47). Therefore, if anything, we may be underestimating L for the bipolar filaments. Regardless, the longer L from the A/Mf assay data indicates that the slow heads in the Mf/A assay likely have only a small effect on the filament motility. This small effect is consistent with a previous work showing that the slow heads can only generate ~1/10th the force of the fast heads of clam adductor myosin filaments (48).
Summary and conclusions
Here, we used in vitro approaches to better understand how myosin as both monomers and filaments interact with actin to generate motion under unloaded conditions. Using myosin II isolated from three different muscle types (smooth, cardiac, and skeletal) in both monomeric and filament-based motility assays, we have shown that our mixed-kinetic model (Eq. 5) provides an adequate fit to velocity data using kinetic constants from the literature. At low N, V is primarily attachment-influenced due to a flexible tether that relates to the length and flexibility of the S2 domain. As N increases, V is influenced increasingly by detachment kinetics that depends on the probability that an actin-attached head will reach the end of the tether length (L). Our data suggest that L is longer when myosin is incorporated into filaments versus as monomers attached to a surface.
In contrast to conventional models in which muscle shortening is thought to be associated with actin-myosin detachment, our results support a model in which filament movement can be associated with both actin-myosin attachment and detachment kinetics. The results of this study and previous studies (5, 6, 18–20) suggest that different muscles may operate primarily in different kinetic regimes depending on the effective N, which presumably would change as the muscle transitions from relaxed to partial and full activation. Also, L may not be a constant in muscle but could be modulated by effectors that interact with the S2 domain, such as myosin binding protein C. Similarly, phosphorylation of the regulatory light chain is thought to weaken the interactions of the myosin heads with the S2 domain (49), a region that has recently been shown to be important in mutations involved in hereditary heart disease (7, 50). We suggest that our approach can reveal the mechanochemical mechanisms underlying such perturbations.
MATERIALS AND METHODS
Buffers and proteins
The filament buffer consists of 10 mM NaPi (pH 7.0), 5 mM MgCl2, 125 mM NaCl, 0.1 mM EGTA, 1 mM dithiothreitol (DTT), and 30 nM NaN3. The observation buffer consists of the filament buffer plus 0.5% methylcellulose and an oxygen scavenger system (5) with indicated [ATP]. The conjugation buffer consists of 20 mM Hepes (pH 7.2), 0.5 M NaCl, 0.1 mM EGTA, 5 mM DTT, and 30 nM NaN3. The myosin buffer consists of 25 mM imidazole (pH 7.4), 300 mM KCl, 1 mM EGTA, 4 mM MgCl2, 10 mM DTT, and 30 nM NaN3. The actin buffer consists of 50 mM imidazole (pH 7.0), 50 mM KCl, 2 mM EGTA, 8 mM MgCl2, and 10 mM DTT. Actin, Alexa Fluor 488 (Thermo Fisher Scientific), tetramethyl rhodamine isothiocyanate (TRITC), and biotinylated actin (5%) were prepared as described (5, 6). Rabbit SKM was purified from psoas muscle as described and stored at −20°C in 50% glycerol (51, 52). Bovine CMM was purified from left ventricles as described and stored at −20°C in 50% glycerol (53). Both types of myosins were shown by urea gel electrophoresis to be unphosphorylated. SKM and CMM rods were prepared by papain digestion (52), and S1s were prepared by α-chymotrypsin digestion without further separation of isoenzymes (52, 54). The following extinction coefficients (0.1%, w/v) were used to determine protein concentrations at 280 nm: SMM, 0.56; SKM, 0.53; SKM S1, 0.75; SKM rod, 0.36; CMM, 0.55; CMM S1, 0.75; CMM rod, 0.17. Protein molecular weights were as follows: SMM, SKM, and CMM, 480 kDa; SMM, SKM, and CMM rod, 250 kDa; SMM, SKM, and CMM S1, 130 kDa.
Preparation of SKM and CMM filaments
Glycerol was removed from SKM and CMM by adding 10 volumes of cold 5 mM MgCl2 followed by incubating on ice for 30 min and pelleting the filaments for 20 min at 12,000g at 4°C. Pellets were resuspended in the conjugation buffer, and myosins were labeled with N-hydroxysuccinimide (NHS)–rhodamine (Thermo Fisher Scientific), as described (5). Rhodamine labeling had little effect on ATPase activity (fig. S5A), as was shown for SMM (5). Short filaments with a relatively narrow length distribution were formed by rapidly diluting labeled myosin in the conjugation buffer at 6 to 8 mg ml−1 10-fold with cold 5 mM MgCl2, incubating on ice for 30 min, pelleting for 20 min at 12,000g at 4°C, and resuspending in the filament buffer. To form longer filaments with a wider length distribution, the labeled myosin in conjugation buffer was dialyzed overnight at 4°C to the filament buffer at 0.5 to 2 mg ml−1. CMM filaments were cross-linked in the DTT-free filament buffer for 30 min at room temperature with 0.5 mM 1-ethyl-3-(3-dimethylaminopropyl)carbodiimide hydrochloride (EDC) (Thermo Fisher Scientific). Note that this follows our previous procedure (5), with the correction that [EDC] = 0.5 mM, not 5 mM. EDC cross-linking had little effect on ATPase activity (fig. S5B). The reaction was quenched with 1 mM hydroxylamine hydrochloride (Sigma-Aldrich), and the filaments were pelleted for 20 min at 164,000g at 4°C and resuspended in the filament buffer.
Preparation of myosin rod co-filaments
Myosin rods were labeled with NHS-rhodamine as described for myosins. SKM- and CMM-rod co-filaments were formed as previously described for SMM co-filaments (6) except that SKM co-filaments were not cross-linked; CMM co-filaments were cross-linked as above.
Determination of N for the A/Mm assay
N was determined by measuring the ATPase activity of heads attached to nitrocellulose-coated slides and compared to the ATPase activity of known myosin concentrations in solution. See the Supplementary Materials for details.
Actin-activated ATPase assays
Assays for actin-activated ATPase activities were at 30°C in the filament buffer made with Mops rather than phosphate with 2 mM ATP. Aliquots of a stock actin solution (~200 μM) were added to a glass test tube using a positive pressure pipette (Microman), and the exact volumes were verified by weight. Following buffer/ATP additions, the reaction was started by adding myosin with extensive mixing using a positive pressure pipette. Aliquots were removed into the quenching solution using a positive pressure pipette. Phosphate was determined as described in the Supplementary Materials.
Motility assays
We used three different types of in vitro assays that allow direct observation of the relative motion between fluorescently labeled actin and myosin using TIRF (total internal reflection fluorescence) microscopy. All assays were performed at 30°C in the observation buffer. Trajectories of actin filaments in the A/Mm and A/Mf assays were analyzed identically to myosin filaments in the Mf/A (6). To avoid the actin filament length dependence of V (16), all actin filaments shorter than 1 μm were ignored for the A/Mm assay.
Mf/A assays (Fig. 1D) were as previously described (6). For the A/Mf (Fig. 1E), SKM was labeled with biotin (Thermo Fisher Scientific, EZ-Link Sulfo-NHS-LC-LC-Biotin; 21338) in the conjugation buffer according to the manufacturer’s protocol using a 10-fold molar excess of biotin over myosin. The biotinylated SKM (1 or 5 parts) was then mixed with rhodamine-labeled SKM (99 or 95 parts), and the mixture (0.5 to 2 mg ml−1) was dialyzed overnight to the filament buffer at 4°C. The following reagents (~80 μl) were added in the following order with indicated incubation times to biotin-PEG flow cells (6): bovine serum albumin (BSA) (5 mg ml−1) (Sigma; A3059) for 1 min, streptavidin (4 μg ml−1) (Invitrogen; 434302) for 15 to 30 s, BSA wash (5 mg ml−1), biotin/rhodamine-labeled myosin filaments (100 to 200 μg ml−1) for 1 to 2 min, filament buffer wash, shredded (sonicated for 5 to 10 s) Alexa Fluor 488–phalloidin–labeled 5% biotinylated actin (70 nM) in actin buffer for 1 min, filament buffer wash, and observation buffer.
Flow cells (~30 to 40 μl) for A/Mm were created with a nitrocellulose-coated coverslip (Thermo Fisher Scientific; 12544A) attached with two layers of 1/4”-wide double-sided tape (3M) to a microscope slide (Thermo Fisher Scientific; 12-544-1). Flow cell additions (50 μl) were as follows: myosin buffer, myosin in myosin buffer at indicated concentrations (between 5 and 400 μg ml−1) incubated for 1 min, BSA (5 mg ml−1) in myosin buffer, actin buffer, 50 nM TRITC-actin in actin buffer, filament buffer, and finally observation buffer.
Estimation of N in myosin filament motility assays
N was estimated by measuring the length of each moving filament (ImageJ line tool) and subtracting 0.31 μm to account for the point spread function as previously described (6). Because SKM and CMM filaments are three stranded and bipolar (55–57), the length was converted to N using the following equation
| (7) |
Equation 7 incorporates our assumption that only one-fourth of the heads in a bipolar filament can interact in a physiological manner with a single actin filament. In the A/Mf assay, the apparent length of the filament is the length of the actin filament moving over the myosin filament after subtracting 0.31 μm to account for the point spread function.
Fitting model equations
Equation 5 was fit to data using OriginLab (OriginLab Corporation) or a custom program written in Python (version 3.6.1; available on request). The recursive Eq. 5 was solved using an iterative approach and generally needed fewer than 50 iterations to converge. See fig. S6 and the Supplementary Materials for a flowchart describing the steps used to solve the equation and example code written in C. See www.dropbox.com/sh/22xlcflonit87uz/AADRyoTKMPWYrdULMwb2NoW3a?dl=0 for a simulation of V versus N data using Eq. 5 and the fitting functions used in OriginLab. Data were fit, and the estimated SEs of the means and R2 values were calculated using a Levenberg-Marquardt algorithm. Other errors were calculated using fundamental equations for propagating uncertainties (58).
Supplementary Material
Acknowledgments
We thank E. Su for programming the fitting algorithms. Funding: The research reported in this publication was supported by the National Institute of Arthritis and Musculoskeletal and Skin Diseases of the NIH under award number 1R01AR071405-01 (to C.R.C. and J.E.B.). The content is solely the responsibility of the authors and does not necessarily represent the official views of the NIH. Additional funding support was provided by the Mick Hitchcock Scholarship (to R.K.B.). Author contributions: R.K.B., J.E.B., and C.R.C. designed research; R.K.B., G.G.S., D.B.A., and S.I.N. performed research; R.K.B., G.G.S., D.B.A., S.I.N., J.E.B., and C.R.C. analyzed data; R.K.B. and C.R.C. wrote the paper. Competing interests: The authors declare that they have no competing interests. Data and materials availability: All data needed to evaluate the conclusions in the paper are present in the paper and/or the Supplementary Materials. Additional data related to this paper may be requested from the authors.
SUPPLEMENTARY MATERIALS
Supplementary material for this article is available at http://advances.sciencemag.org/cgi/content/full/3/12/eaao2267/DC1
Supplementary Methods
movie S1. Cartoon depicting detachment-limited kinetics in the A/Mm assay.
movie S2. Cartoon depicting mixed kinetics (attachment to detachment) in the Mf/A assay.
movie S3. Example movie of SKM filaments moving in the Mf/A assay.
movie S4. Example movie of CMM filaments moving in the Mf/A assay.
movie S5. Example movie of actin filaments moving over SKM filaments in the A/Mf assay.
fig. S1. Steady-state actin-activated ATPase rates and ATP-induced dissociation of actomyosin.
fig. S2. Contour plots showing R2 dependence of fit of Eq. 5 to data from Fig. 3B.
fig. S3. Contour plots showing R2 dependence of fit of Eq. 5 to data from Fig. 2 (A to C).
fig. S4. Distance from origin plot of actin filament moving over a myosin filament in the A/Mf assay.
fig. S5. Effect of rhodamine labeling and EDC cross-linking on CMM steady-state actin-activated ATPase activity.
fig. S6. Flowchart describing algorithm to solve recursive Eq. 5.
Supplementary Text
Reference (59)
REFERENCES AND NOTES
- 1.Kron S. J., Spudich J. A., Fluorescent actin filaments move on myosin fixed to a glass surface. Proc. Natl. Acad. Sci. U.S.A. 83, 6272–6276 (1986). [DOI] [PMC free article] [PubMed] [Google Scholar]
- 2.Yanagida T., Nakase M., Nishiyama K., Oosawa F., Direct observation of motion of single F-actin filaments in the presence of myosin. Nature 307, 58–60 (1984). [DOI] [PubMed] [Google Scholar]
- 3.Toyoshima Y. Y., Kron S. J., McNally E. M., Niebling K. R., Toyoshima C., Spudich J. A., Myosin subfragment-1 is sufficient to move actin filaments in vitro. Nature 328, 536–539 (1987). [DOI] [PubMed] [Google Scholar]
- 4.Yengo C. M., Takagi Y., Sellers J. R., Temperature dependent measurements reveal similarities between muscle and non-muscle myosin motility. J. Muscle Res. Cell Motil. 33, 385–394 (2012). [DOI] [PMC free article] [PubMed] [Google Scholar]
- 5.Haldeman B. D., Brizendine R. K., Facemyer K. C., Baker J. E., Cremo C. R., The kinetics underlying the velocity of smooth muscle myosin filament sliding on actin filaments in vitro. J. Biol. Chem. 289, 21055–21070 (2014). [DOI] [PMC free article] [PubMed] [Google Scholar]
- 6.Brizendine R. K., Alcala D. B., Carter M. S., Haldeman B. D., Facemyer K. C., Baker J. E., Cremo C. R., Velocities of unloaded muscle filaments are not limited by drag forces imposed by myosin cross-bridges. Proc. Natl. Acad. Sci. U.S.A. 112, 11235–11240 (2015). [DOI] [PMC free article] [PubMed] [Google Scholar]
- 7.Nag S., Trivedi D. V., Sarkar S. S., Adhikari A. S., Sunitha M. S., Sutton S., Ruppel K. M., Spudich J. A., The myosin mesa and the basis of hypercontractility caused by hypertrophic cardiomyopathy mutations. Nat. Struct. Mol. Biol. 24, 525–533 (2017). [DOI] [PMC free article] [PubMed] [Google Scholar]
- 8.Kawana M., Sarkar S. S., Sutton S., Ruppel K. M., Spudich J. A., Biophysical properties of human β-cardiac myosin with converter mutations that cause hypertrophic cardiomyopathy. Sci. Adv. 3, e1601959 (2017). [DOI] [PMC free article] [PubMed] [Google Scholar]
- 9.Spudich J. A., Aksel T., Bartholomew S. R., Nag S., Kawana M., Yu E. C., Sarkar S. S., Sung J., Sommese R. F., Sutton S., Cho C., Adhikari A. S., Taylor R., Liu C., Trivedi D., Ruppel K. M., Effects of hypertrophic and dilated cardiomyopathy mutations on power output by human β-cardiac myosin. J. Exp. Biol. 219, 161–167 (2016). [DOI] [PMC free article] [PubMed] [Google Scholar]
- 10.Bloemink M., Deacon J., Langer S., Vera C., Combs A., Leinwand L., Geeves M. A., The hypertrophic cardiomyopathy myosin mutation R453C alters ATP binding and hydrolysis of human cardiac β-myosin. J. Biol. Chem. 289, 5158–5167 (2014). [DOI] [PMC free article] [PubMed] [Google Scholar]
- 11.Kad N. M., Patlak J. B., Fagnant P. M., Trybus K. M., Warshaw D. M., Mutation of a conserved glycine in the SH1-SH2 helix affects the load-dependent kinetics of myosin. Biophys. J. 92, 1623–1631 (2007). [DOI] [PMC free article] [PubMed] [Google Scholar]
- 12.Aksel T., Choe Yu E., Sutton S., Ruppel K. M., Spudich J. A., Ensemble force changes that result from human cardiac myosin mutations and a small-molecule effector. Cell Rep. 11, 910–920 (2015). [DOI] [PMC free article] [PubMed] [Google Scholar]
- 13.Debold E. P., Schmitt J. P., Patlak J. B., Beck S. E., Moore J. R., Seidman J. G., Seidman C., Warshaw D. M., Hypertrophic and dilated cardiomyopathy mutations differentially affect the molecular force generation of mouse α-cardiac myosin in the laser trap assay. Am. J. Physiol. Heart Circ. Physiol. 293, H284–H291 (2007). [DOI] [PubMed] [Google Scholar]
- 14.Bing W., Knott A., Marston S. B., A simple method for measuring the relative force exerted by myosin on actin filaments in the in vitro motility assay: Evidence that tropomyosin and troponin increase force in single thin filaments. Biochem. J. 350 (Pt. 3), 693–699 (2000). [PMC free article] [PubMed] [Google Scholar]
- 15.Greenberg M. J., Moore J. R., The molecular basis of frictional loads in the in vitro motility assay with applications to the study of the loaded mechanochemistry of molecular motors. Cytoskeleton 67, 273–285 (2010). [DOI] [PMC free article] [PubMed] [Google Scholar]
- 16.Uyeda T. Q. P., Kron S. J., Spudich J. A., Myosin step size. Estimation from slow sliding movement of actin over low densities of heavy meromyosin. J. Mol. Biol. 214, 699–710 (1990). [DOI] [PubMed] [Google Scholar]
- 17.Harris D. E., Warshaw D. M., Smooth and skeletal muscle myosin both exhibit low duty cycles at zero load in vitro. J. Biol. Chem. 268, 14764–14768 (1993). [PubMed] [Google Scholar]
- 18.Hooft A. M., Maki E. J., Cox K. K., Baker J. E., An accelerated state of myosin-based actin motility. Biochemistry 46, 3513–3520 (2007). [DOI] [PubMed] [Google Scholar]
- 19.Baker J. E., Brosseau C., Fagnant P., Warshaw D. M., The unique properties of tonic smooth muscle emerge from intrinsic as well as intermolecular behaviors of myosin molecules. J. Biol. Chem. 278, 28533–28539 (2003). [DOI] [PubMed] [Google Scholar]
- 20.Baker J. E., Brosseau C., Joel P. B., Warshaw D. M., The biochemical kinetics underlying actin movement generated by one and many skeletal muscle myosin molecules. Biophys. J. 82, 2134–2147 (2002). [DOI] [PMC free article] [PubMed] [Google Scholar]
- 21.Sweeney H. L., Rosenfeld S. S., Brown F., Faust L., Smith J., Xing J., Stein L. A., Sellers J. R., Kinetic tuning of myosin via a flexible loop adjacent to the nucleotide binding pocket. J. Biol. Chem. 273, 6262–6270 (1998). [DOI] [PubMed] [Google Scholar]
- 22.Kaya M., Higuchi H., Nonlinear elasticity and an 8-nm working stroke of single myosin molecules in myofilaments. Science 329, 686–689 (2010). [DOI] [PubMed] [Google Scholar]
- 23.Kaya M., Higuchi H., Stiffness, working stroke, and force of single-myosin molecules in skeletal muscle: Elucidation of these mechanical properties via nonlinear elasticity evaluation. Cell. Mol. Life Sci. 70, 4275–4292 (2013). [DOI] [PMC free article] [PubMed] [Google Scholar]
- 24.Siemankowski R. F., Wiseman M. O., White H. D., ADP dissociation from actomyosin subfragment 1 is sufficiently slow to limit the unloaded shortening velocity in vertebrate muscle. Proc. Natl. Acad. Sci. U.S.A. 82, 658–662 (1985). [DOI] [PMC free article] [PubMed] [Google Scholar]
- 25.Nyitrai M., Rossi R., Adamek N., Pellegrino M. A., Bottinelli R., Geeves M. A., What limits the velocity of fast-skeletal muscle contraction in mammals? J. Mol. Biol. 355, 432–442 (2006). [DOI] [PubMed] [Google Scholar]
- 26.Lymn R. W., Taylor E. W., Mechanism of adenosine triphosphate hydrolysis by actomyosin. Biochemistry 10, 4617–4624 (1971). [DOI] [PubMed] [Google Scholar]
- 27.Lionne C., Brune M., Webb M. R., Travers F., Barman T., Time resolved measurements show that phosphate release is the rate limiting step on myofibrillar ATPases. FEBS Lett. 364, 59–62 (1995). [DOI] [PubMed] [Google Scholar]
- 28.Spudich J. A., How molecular motors work. Nature 372, 515–518 (1994). [DOI] [PubMed] [Google Scholar]
- 29.Wagner P. D., Slater C. S., Pope B., Weeds A. G., Studies on the actin activation of myosin subfragment-1 isoenzymes and the role of myosin light chains. Eur. J. Biochem. 99, 385–394 (1979). [DOI] [PubMed] [Google Scholar]
- 30.Woledge R. C., Curtin N. A., Homsher E., Energetic aspects of muscle contraction. Monogr. Physiol. Soc. 41, 1–357 (1985). [PubMed] [Google Scholar]
- 31.Mijailovich S. M., Nedic D., Svicevic M., Stojanovic B., Walklate J., Ujfalusi Z., Geeves M. A., Modeling the actin.myosin ATPase cross-bridge cycle for skeletal and cardiac muscle myosin isoforms. Biophys. J. 112, 984–996 (2017). [DOI] [PMC free article] [PubMed] [Google Scholar]
- 32.Siemankowski R. F., White H. D., Kinetics of the interaction between actin, ADP, and cardiac myosin-S1. J. Biol. Chem. 259, 5045–5053 (1984). [PubMed] [Google Scholar]
- 33.Tyska M. J., Warshaw D. M., The myosin power stroke. Cell Motil. Cytoskeleton 51, 1–15 (2002). [DOI] [PubMed] [Google Scholar]
- 34.Bloemink M. J., Geeves M. A., Shaking the myosin family tree: Biochemical kinetics defines four types of myosin motor. Semin. Cell Dev. Biol. 22, 961–967 (2011). [DOI] [PMC free article] [PubMed] [Google Scholar]
- 35.Sleep J. A., Hutton R. L., Exchange between inorganic phosphate and adenosine 5’-triphosphate in the medium by actomyosin subfragment 1. Biochemistry 19, 1276–1283 (1980). [DOI] [PubMed] [Google Scholar]
- 36.Nag S., Sommese R. F., Ujfalusi Z., Combs A., Langer S., Sutton S., Leinwand L. A., Geeves M. A., Ruppel K. M., Spudich J. A., Contractility parameters of human β-cardiac myosin with the hypertrophic cardiomyopathy mutation R403Q show loss of motor function. Sci. Adv. 1, e1500511 (2015). [DOI] [PMC free article] [PubMed] [Google Scholar]
- 37.Deacon J. C., Bloemink M. J., Rezavandi H., Geeves M. A., Leinwand L. A., Identification of functional differences between recombinant human α and β cardiac myosin motors. Cell. Mol. Life Sci. 69, 2261–2277 (2012). [DOI] [PMC free article] [PubMed] [Google Scholar]
- 38.Greenberg M. J., Shuman H., Ostap E. M., Inherent force-dependent properties of β-cardiac myosin contribute to the force-velocity relationship of cardiac muscle. Biophys. J. 107, L41–L44 (2014). [DOI] [PMC free article] [PubMed] [Google Scholar]
- 39.Palmiter K. A., Tyska M. J., Dupuis D. E., Alpert N. R., Warshaw D. M., Kinetic differences at the single molecule level account for the functional diversity of rabbit cardiac myosin isoforms. J. Physiol. 519 (Pt. 3), 669–678 (1999). [DOI] [PMC free article] [PubMed] [Google Scholar]
- 40.Lauzon A.-M., Tyska M. J., Rovner A. S., Freyzon Y., Warshaw D. M., Trybus K. M., A 7-amino-acid insert in the heavy chain nucleotide binding loop alters the kinetics of smooth muscle myosin in the laser trap. J. Muscle Res. Cell Motil. 19, 825–837 (1998). [DOI] [PubMed] [Google Scholar]
- 41.Cuda G., Fananapazir L., Epstein N. D., Sellers J. R., The in vitro motility activity of β-cardiac myosin depends on the nature of the β-myosin heavy chain gene mutation in hypertrophic cardiomyopathy. J. Muscle Res. Cell Motil. 18, 275–283 (1997). [DOI] [PubMed] [Google Scholar]
- 42.Tyska M. J., Hayes E., Giewat M., Seidman C. E., Seidman J. G., Warshaw D. M., Single-molecule mechanics of R403Q cardiac myosin isolated from the mouse model of familial hypertrophic cardiomyopathy. Circ. Res. 86, 737–744 (2000). [DOI] [PubMed] [Google Scholar]
- 43.Sommese R. F., Sung J., Nag S., Sutton S., Deacon J. C., Choe E., Leinwand L. A., Ruppel K., Spudich J. A., Molecular consequences of the R453C hypertrophic cardiomyopathy mutation on human β-cardiac myosin motor function. Proc. Natl. Acad. Sci. U.S.A. 110, 12607–12612 (2013). [DOI] [PMC free article] [PubMed] [Google Scholar]
- 44.Nowakowski S. G., Regnier M., Daggett V., Molecular mechanisms underlying deoxy-ADP. Pi activation of pre-powerstroke myosin. Protein Sci. 26, 749–762 (2017). [DOI] [PMC free article] [PubMed] [Google Scholar]
- 45.Moss R. L., The effect of calcium on the maximum velocity of shortening in skinned skeletal muscle fibres of the rabbit. J. Muscle Res. Cell Motil. 3, 295–311 (1982). [DOI] [PubMed] [Google Scholar]
- 46.Cooke R., Franks K., Luciani G. B., Pate E., The inhibition of rabbit skeletal muscle contraction by hydrogen ions and phosphate. J. Physiol. 395, 77–97 (1988). [DOI] [PMC free article] [PubMed] [Google Scholar]
- 47.Stewart T. J., Jackson D. R. Jr, Smith R. D., Shannon S. F., Cremo C. R., Baker J. E., Actin sliding velocities are influenced by the driving forces of actin-myosin binding. Cell. Mol. Bioeng. 6, 26–37 (2013). [DOI] [PMC free article] [PubMed] [Google Scholar]
- 48.Ishijima A., Kojima H., Higuchi H., Harada Y., Funatsu T., Yanagida T., Multiple- and single-molecule analysis of the actomyosin motor by nanometer-piconewton manipulation with a microneedle: Unitary steps and forces. Biophys. J. 70, 383–400 (1996). [DOI] [PMC free article] [PubMed] [Google Scholar]
- 49.Alamo L., Qi D., Wriggers W., Pinto A., Zhu J., Bilbao A., Gillilan R. E., Hu S., Padrón R., Conserved intramolecular interactions maintain myosin interacting-heads motifs explaining tarantula muscle super-relaxed state structural basis. J. Mol. Biol. 428, 1142–1164 (2016). [DOI] [PMC free article] [PubMed] [Google Scholar]
- 50.Spudich J. A., The myosin mesa and a possible unifying hypothesis for the molecular basis of human hypertrophic cardiomyopathy. Biochem. Soc. Trans. 43, 64–72 (2015). [DOI] [PMC free article] [PubMed] [Google Scholar]
- 51.Prochniewicz E., Lowe D. A., Spakowicz D. J., Higgins L., O’Conor K., Thompson L. V., Ferrington D. A., Thomas D. D., Functional, structural, and chemical changes in myosin associated with hydrogen peroxide treatment of skeletal muscle fibers. Am. J. Physiol. Cell Physiol. 294, C613–C626 (2008). [DOI] [PMC free article] [PubMed] [Google Scholar]
- 52.Margossian S. S., Lowey S., Preparation of myosin and its subfragments from rabbit skeletal muscle. Methods Enzymol. 85 (Pt. B), 55–81 (1982). [DOI] [PubMed] [Google Scholar]
- 53.Pant K., Watt J., Greenberg M., Jones M., Szczesna-Cordary D., Moore J. R., Removal of the cardiac myosin regulatory light chain increases isometric force production. FASEB J. 23, 3571–3580 (2009). [DOI] [PMC free article] [PubMed] [Google Scholar]
- 54.Weeds A. G., Taylor R. S., Separation of subfragment-1 isoenzymes from rabbit skeletal muscle myosin. Nature 257, 54–56 (1975). [DOI] [PubMed] [Google Scholar]
- 55.Kensler R. W., Stewart M., Frog skeletal muscle thick filaments are three-stranded. J. Cell Biol. 96, 1797–1802 (1983). [DOI] [PMC free article] [PubMed] [Google Scholar]
- 56.Squire J. M., General model of myosin filament structure. II. Myosin filaments and cross-bridge interactions in vertebrate striated and insect flight muscles. J. Mol. Biol. 72, 125–138 (1972). [DOI] [PubMed] [Google Scholar]
- 57.Kensler R. W., The mammalian cardiac muscle thick filament: Crossbridge arrangement. J. Struct. Biol. 149, 303–312 (2005). [DOI] [PubMed] [Google Scholar]
- 58.P. Bevington, D. K. Robinson, Data Reduction and Error Analysis (McGraw-Hill, ed. 3, 2003). [Google Scholar]
- 59.Chifflet S., Torriglia A., Chiesa R., Tolosa S., A method for the determination of inorganic phosphate in the presence of labile organic phosphate and high concentrations of protein: Application to lens ATPases. Anal. Biochem. 168, 1–4 (1988). [DOI] [PubMed] [Google Scholar]
Associated Data
This section collects any data citations, data availability statements, or supplementary materials included in this article.
Supplementary Materials
Supplementary material for this article is available at http://advances.sciencemag.org/cgi/content/full/3/12/eaao2267/DC1
Supplementary Methods
movie S1. Cartoon depicting detachment-limited kinetics in the A/Mm assay.
movie S2. Cartoon depicting mixed kinetics (attachment to detachment) in the Mf/A assay.
movie S3. Example movie of SKM filaments moving in the Mf/A assay.
movie S4. Example movie of CMM filaments moving in the Mf/A assay.
movie S5. Example movie of actin filaments moving over SKM filaments in the A/Mf assay.
fig. S1. Steady-state actin-activated ATPase rates and ATP-induced dissociation of actomyosin.
fig. S2. Contour plots showing R2 dependence of fit of Eq. 5 to data from Fig. 3B.
fig. S3. Contour plots showing R2 dependence of fit of Eq. 5 to data from Fig. 2 (A to C).
fig. S4. Distance from origin plot of actin filament moving over a myosin filament in the A/Mf assay.
fig. S5. Effect of rhodamine labeling and EDC cross-linking on CMM steady-state actin-activated ATPase activity.
fig. S6. Flowchart describing algorithm to solve recursive Eq. 5.
Supplementary Text
Reference (59)