

Abstract
Cells are highly asymmetrical, a feature that relies on the sorting of molecular constituents, including proteins, lipids, and nucleic acids, to distinct subcellular locales. The localization of RNA molecules is an important layer of gene regulation required to modulate localized cellular activities, although its global prevalence remains unclear. We combine biochemical cell fractionation with RNA-sequencing (CeFra-seq) analysis to assess the prevalence and conservation of RNA asymmetric distribution on a transcriptome-wide scale in Drosophila and human cells. This approach reveals that the majority (∼80%) of cellular RNA species are asymmetrically distributed, whether considering coding or noncoding transcript populations, in patterns that are broadly conserved evolutionarily. Notably, a large number of Drosophila and human long noncoding RNAs and circular RNAs display enriched levels within specific cytoplasmic compartments, suggesting that these RNAs fulfill extra-nuclear functions. Moreover, fraction-specific mRNA populations exhibit distinctive sequence characteristics. Comparative analysis of mRNA fractionation profiles with that of their encoded proteins reveals a general lack of correlation in subcellular distribution, marked by strong cases of asymmetry. However, coincident distribution profiles are observed for mRNA/protein pairs related to a variety of functional protein modules, suggesting complex regulatory inputs of RNA localization to cellular organization.
Keywords: RNA localization, subcellular fractionation, RNA-sequencing, messenger RNA, noncoding RNA, cellular organization
INTRODUCTION
In eukaryotic cells, biochemical reactions are often carried out within distinct subcellular compartments by localized molecular machineries. Indeed, most signal transduction systems rely on the colocalization of ligand–receptor pairs, as well as proteins that fulfill various molecular sensing, scaffolding, and enzymatic functions (Hartwell et al. 1999). Similarly, the diverse array of regulatory events that modulate gene expression are mediated by compartment-specific ribonucleoprotein (RNP) complexes involved in RNA synthesis, processing, nuclear export, cytoplasmic localization, translation, and degradation (Gerstberger et al. 2014). By increasing the local concentrations of molecular constituents, colocalization is thought to enhance the probability of productive molecular interactions (Kuriyan and Eisenberg 2007). In the case of protein–protein interactions, subcellular localization strongly influences proteome organization and has been proposed to be a driving force in the evolution of functional binding interactions and allostery (Kuriyan and Eisenberg 2007; Levy et al. 2014). Moreover, modeling studies suggest that coincident sites of synthesis may be crucial for ensuring the efficient assembly of protein complexes (Batada et al. 2004).
The intracellular trafficking of RNA molecules is an important and evolutionarily conserved mechanism for controlling cell polarity (Martin and Ephrussi 2009; Bergalet and Lécuyer 2014). This process has been most extensively studied in the context of messenger RNAs (mRNAs), for which localized translation at precise cytoplasmic destinations is implicated in a broad range of biological processes, including developmental patterning, cell fate determination, synaptic plasticity, and cell migration (Cody et al. 2013). Likewise, subcellular targeting strongly influences the function of various noncoding RNA species, such as long noncoding RNAs (lncRNAs) and small nucleolar RNAs (snoRNAs), and it has been proposed that such RNAs may act as key components of subcellular addressing systems (Batista and Chang 2013). Over the years, several transcriptome profiling surveys of purified organelles and subcellular compartments have revealed cofractionation of functionally coherent collections of mRNAs (Kopczynski et al. 1998; Diehn et al. 2000, 2006; Eberwine et al. 2001; Marc et al. 2002; Lerner et al. 2003; Blower et al. 2007; Garcia et al. 2007; Mili et al. 2008; Pyhtila et al. 2008; Zivraj et al. 2010; Cajigas et al. 2012; Wang et al. 2012; Jan et al. 2014; Williams et al. 2014; Lefebvre et al. 2016). Similarly, global RNA imaging-based screens in Drosophila oocytes and embryos have demonstrated that as much as 70% of coding transcripts are localized in patterns that broadly correlate with the distribution and function of their encoded proteins (Lécuyer et al. 2007; Jambor et al. 2015; Wilk et al. 2016). However, as Drosophila embryos may represent an exceptional case where mRNA localization is particularly prominent, due to their large size and syncytial nature, it remains unclear whether a comparably high prevalence of RNA localization is also manifest in standard cells grown in culture.
In this study, we combine subcellular fractionation with RNA sequencing in human and Drosophila cellular models, following poly(A)-enrichment or ribosomal RNA (rRNA)-depletion regimens, to assess the extent of RNA subcellular localization in eukaryotic cells. These results reveal the high prevalence of RNA asymmetric localization, with distinctive subcellular enrichments observed for a diverse array of cellular RNA species exhibiting discriminative sequence features. Comparative transcriptome and proteome profiling of cellular fractions further reveals functional coherence in the molecular components enriched within individual fractions, as well as diverse patterns of RNA–protein distribution suggestive of complex regulatory relationships.
RESULTS
Subcellular fractionation and RNA sequencing (CeFra-seq) of human and insect cells
To gain global insights into the subcellular localization properties of cellular RNAs in eukaryotic cells, and the degree of conservation of RNA distribution signatures, we applied a biochemical cell fractionation strategy coupled with RNA sequencing (CeFra-seq) to human and Drosophila cellular models (Fig. 1A; Wang et al. 2012). For this, we focused on two cell lines with epithelial-like features, human HepG2 hepatocellular carcinoma cells and Drosophila DM-D17-c3 (D17) cells, a cell line derived from imaginal discs (Cherbas et al. 2011; Currie and Rogers 2011). As outlined in Figure 1A, following harvesting, cells were swelled and lysed in hypotonic solution, then subjected to a low-speed centrifugation (1200g) to isolate pelleted nuclei and a supernatant representing the general cytoplasmic extract. The pellet was further processed via centrifugation over a sucrose cushion to remove un-lysed cells and large cellular debris from the “Nuclear” fraction. The general cytoplasmic extract was first subjected to high-speed ultracentrifugation at 100,000g, after which the supernatant was retrieved as the “Cytosolic” fraction. The recovered pellet was then incubated in buffer supplemented with Triton-X to solubilize endo-membranous components. Subsequent ultracentrifugation thus resulted in the isolation of a soluble “Membrane” fraction and a pellet consisting of “Insoluble” cellular material (Howell et al. 1989; Jagannathan et al. 2011; Wang et al. 2012). RNA and protein extracts were prepared from each sample and fractionation efficiency was evaluated via western blotting and RT-qPCR (Fig. 1B; Supplemental Fig. S1A) analyses of fraction-specific markers, in comparison to total extracts from unfractionated cells. Western analysis revealed the expected distribution profiles of protein markers; with enrichments observed for histone H3 in the nuclear fraction, monomeric α-Tubulin in the cytosol, prominent membrane-targeting of proteins bearing the KDEL motif typically present in endoplasmic reticulum proteins, and insoluble signatures for cytoskeletal and mitotic apparatus-associated proteins such as Shot and Ninein (Fig. 1B). This was also generally the case at the RNA level, with the distinction that transcripts often exhibited a combination of nuclear and cytoplasmic localization signatures, reflecting the nuclear origin of most cellular RNAs. For instance, predominant nuclear targeting was observed for transcripts such as hsr-omega and SNORD17, while others showed enrichments in the cytosolic (RN7SK, Rpl23a), membrane (MT-CO1, mt-NDF6) and insoluble (TJP-1, dlg-1) fractions of the cytoplasm (Supplemental Fig. S1A).
FIGURE 1.

Cell fractionation combined with RNA sequencing (CeFra-seq) of human and Drosophila epithelial cell models. (A) Schematic diagram of the fractionation procedure based on Dounce homogenization, centrifugation, and detergent extraction steps to obtain nuclear, cytosolic, membrane, and insoluble fractions. (B) Western blots of protein sample controls show fraction efficiency. The accumulation of the indicated protein markers was assessed in human HepG2 and Drosophila D17 cells. (C) Principal component analysis of RNA-seq replicates for HepG2 and D17 cells. (D) Simplex graph of the relative localization of mRNAs (top row) or noncoding RNAs (bottom row) across subcellular fractions, either assessed from poly(A)-enriched (PA) or rRNA-depleted (RD) sequencing data sets. (T) Total, (C) cytosolic, (M) membrane, (I) insoluble, (N) nuclear.
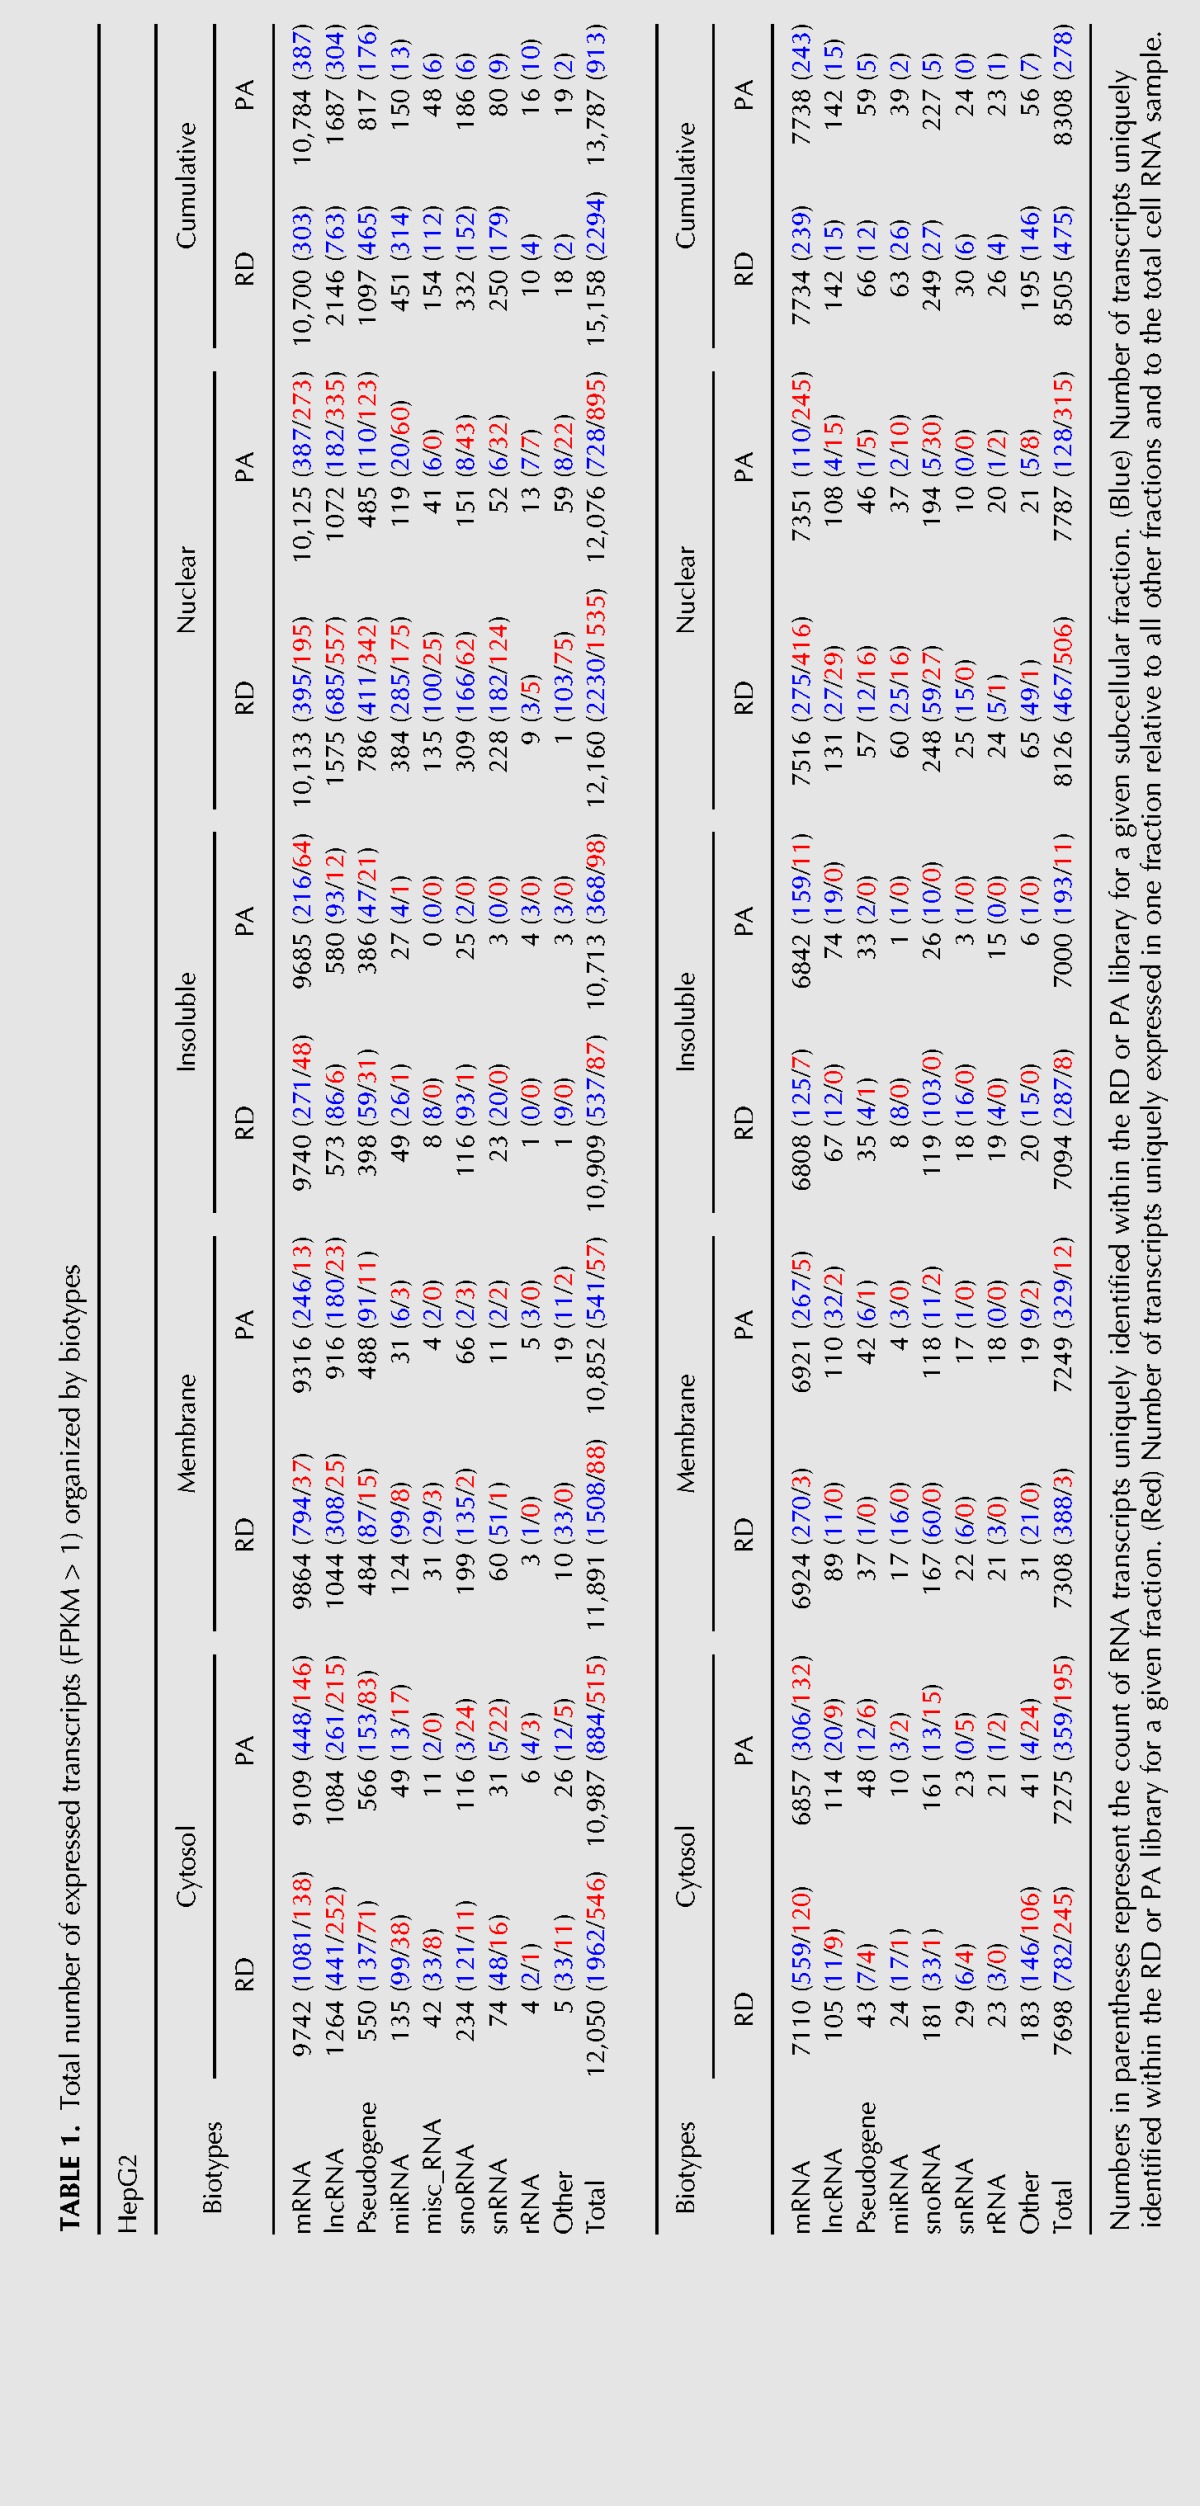
To evaluate global subcellular transcriptome distribution features, we next subjected RNA from biological replicate fractionation samples of HepG2 and D17 cells to strand-specific and paired-end RNA sequencing, following either poly(A)-enrichment (PA) or rRNA-depletion (RD) regimens. Sequencing reads were, respectively, aligned to the human and Drosophila reference genomes (GRCH_37.75 and BDGP_5.78). For D17 and HepG2, respectively, an average number of aligned reads of 19.9 and 30.5 M was obtained for RD libraries and 20.6 and 22 M for PA libraries (Supplemental Table S1; Supplemental Files S1–S4). Pearson correlation measurements and principal component analyses (PCA) revealed highly correlated transcriptomic signatures between biological replicate samples and distinctive gene expression profiles for each fraction type (Fig. 1C; Supplemental Fig. S1B). The cumulative number of expressed transcripts, using a threshold of ≥1 average fragments per kilobase per million mapped reads (FPKM), for PA and RD libraries was, respectively, 8308 and 8505 for D17 cells, and 13,787 and 15,158 for HepG2 cells (Table 1). The majority of transcripts were detectable using both PA and RD regimens, although a subset of RNAs was only robustly detectable in either data set (Table 1, blue numbers). Moreover, certain biotypes such as lncRNA, miRNAs (here primary miRNAs, pri-miRNAs), snoRNAs and snRNAs were more strongly represented in RD samples. Comparison of inter-fraction expression signatures revealed that most RNA species are detectable across all interrogated subcellular fractions. However, as will be detailed below, the majority display extensive asymmetry in relative fraction enrichment profiles, while many transcripts (2256/1565 and 762/533 for human and fly in RD/PA data sets, respectively) were only reliably detected in one fraction compared to all other (Table 1, red numbers).
TABLE 1.
Total number of expressed transcripts (FPKM > 1) organized by biotypes
To help visualize RNA distribution across subcellular fractions, we next built three-simplex graphs in which FPKM values are converted to Cartesian coordinates (see Materials and Methods), such that each dot depicts the relative distribution of an individual RNA in relation to the interrogated fractions (Fig. 1D). For this, we distinguished eight RNA subtypes: (i) mRNAs; (ii) lncRNAs, including antisense, sense intronic, sense overlapping long intergenic noncoding RNA, and processed transcripts; (iii) pseudogene-derived transcripts; (iv) rRNAs; (v) snoRNA; (vi) snRNAs; (vii) miscellaneous RNA; and (viii) pri-miRNAs. This representation conveys the tendency of coding (upper) and noncoding (lower) transcripts to be asymmetrically distributed toward specific fractions, both in HepG2 and D17 cells. We conclude that RNA expression signatures are highly reproducible across CeFra-seq replicate samples and clearly distinctive between subcellular fractions.
Subcellular fractions exhibit distinctive RNA biotype composition
To further characterize the RNA composition of interrogated fractions, we calculated transcript per million (TPM) values for each fraction, a measure that conveys the relative molar concentrations of transcripts within each sample (Wagner et al. 2012). Adding to our previous eight RNA subtypes, we grouped within the “other” category biotypes for which the highest TPM in any given fraction was below 1%. This analysis revealed clear distinctions in the relative RNA composition of subcellular fractions for both species (Fig. 2A). For example, in RD samples of HepG2 cells, more than half of the TPM in the cytosolic and membrane fractions were derived from three abundant Pol III transcribed RNAs: RN7SL, the RNA component of the signal recognition particle involved in ER targeting of mRNAs encoding transmembrane proteins; RN7SK, a lncRNA implicated in transcription elongation as a component of the pTEFB complex; and Ribonuclease P RNA Component H1 (RPPH1), an endoribonuclease implicated in the maturation of nuclear and mitochondrial tRNAs. These findings are consistent with previous studies reporting strong expression of these RNAs in the cytoplasmic compartments of HEK293 cells and motor neurons (Sultan et al. 2014; Briese et al. 2016). The Drosophila orthologs of these transcripts (RNAseP:RNA, RN7SK and RN7SL) were also abundant in the cytosol and membrane fractions of D17 cells, albeit to a lesser extent than HepG2. In contrast, a predominant mRNA signature was observed for the insoluble compartment in RD data sets of both cell types (Fig. 2A), while snoRNAs and pri-miRNAs were primarily nuclear-enriched. As expected, mRNAs were the predominant RNA species represented in PA samples for all fractions tested (Supplemental Fig. S2A).
FIGURE 2.

Distinctive transcript composition of subcellular fractions in rRNA-depletion data set. (A) Histograms depicting the RNA biotype content, in TPM, detected via RD sequencing of cytosolic (C), membrane (M), insoluble (I), and nuclear (N) fractions or whole-cell RNA ([T] total) from HepG2 (upper panel) and D17 cells (lower panel). (B) Histograms of the RNA biotype content of HepG2 (upper panel) and D17 (lower panel) cell fractions, binned according to the length of the longest annotated isoform of detected RNA species, following a log10 scale from 1.5 to 5 (i.e., ranging from 31 to 100,000 nt). The expected lengths for mRNA and total RNA populations are indicated for each fraction. For A and B, biotypes accounting for <1% of the overall TPMs were grouped as “other.” (C) Boxplots showing the fraction distribution profiles of different RNA biotypes in percent FPKM (pFPKM) for HepG2 (upper panel) and D17 (lower panel) cells. The number (n) of transcripts analyzed for each biotype is indicated.
In our analyses, we found that the total number of FPKMs was different between fractions, following the order cytosol > membrane > insoluble ≅ nuclear. For instance, total FPKMs ranged from 0.24 × 10⁶ (nuclear) to 3.2 × 10⁶ (cytosol) for HepG2 cells, despite having sequenced the fractions to similar depths (Supplemental Table S1). We reasoned that this variability in total FPKM values might reflect differences in the size distributions of the RNA populations isolated from each fraction. To address this question, we partitioned transcripts expressed in each fraction based on the size of their longest annotated isoform, following a log10 scale spanning 1.5–5 with increments of 0.1 (i.e., ranging from 31 to 100,000 nt in length), and calculated TPM values within each bin, both for RD and PA samples (Fig. 2B; Supplemental Fig. S2B). Calculating the expected lengths of mRNAs for each fraction revealed an enrichment for shorter transcripts in the cytosolic fraction (1470 nt in PA/1401 nt in RD samples), transcripts of intermediate length in the membrane fraction (1893 nt in PA/1818 nt in RD) and a prevalence of longer mRNAs in the insoluble (2918 nt in PA/2332 nt in RD) and nuclear fractions (2737 nt in PA/2815 nt in RD). Similar expected length profiles were observed for Drosophila D17 samples (Fig. 2B; Supplemental Fig. S2B), and these fraction-specific differences were apparent whether considering mRNAs or by combining all RNA biotypes together (designated as “total”). Finally, while the nuclear fraction is enriched in short noncoding transcripts both in HepG2 and D17 cells, total FPKM counts were lower in this fraction due to the high abundance of intronic and intergenic reads, which ranged from 22% to 70% (Supplemental Fig. S3).
To define the distribution profiles of individual transcripts across subcellular fractions, we next calculated a percent FPKM (pFPKM) value for each fraction, which depicts the proportion of FPKMs obtained within one fraction divided by the sum of FPKMs in all fractions combined (pFPKMi = FPKMi/∑k∈{C,M,I,N}FPKMk, for i ∈ {C,M,I,N}). We found that pFPKM values closely reflect transcript expression signatures assessed by RT-qPCR validation (r = 0.94) (Supplemental Fig. S4), offering a reliable metric to assess the relative distribution profiles of individual transcripts across fractions. As depicted in Figure 2C and Supplemental Figure S2C, the median pFPKM values of all transcripts belonging to specific biotypes revealed distinctive distribution signatures across fractions. For instance, pFPKM values for mRNAs were similar across all fractions, each showing a median pFPKM of ∼25% in both RD and PA data sets. In contrast, transcript biotypes such as pri-miRNAs, snRNAs, and snoRNAs showed higher prevalence in the nuclear compartment, while lncRNAs and pseudogene-derived transcripts were generally depleted from the insoluble fraction (Fig. 2C). Thus, our data reveal that biochemically defined subcellular fractions exhibit distinct RNA composition, both in terms of RNA biotype profiles and expected transcript lengths, features that are strikingly similar between Drosophila and human cells.
Subcellular localization of mRNAs is prevalent and conserved
Previous FISH-based studies in Drosophila embryos revealed the high prevalence of RNA subcellular localization (Lécuyer et al. 2007), a feature that has remained poorly defined in cultured cells. To address this question, we next took advantage of our CeFra-seq data sets, for which each fraction was successively isolated from the same starting cellular population, to quantify the global prevalence of RNA asymmetric distribution in HepG2 and D17 cells. For this, we categorized a given RNA as asymmetric when it exhibited a ≥2-fold difference in expression in at least one fraction when assessed by pair-wise comparisons of fraction FPKM values, either considering all fractions (including the nucleus) or only the cytoplasmic compartments. We further defined RNAs as fraction-specific when they showed ≥2-fold expression enrichment in one fraction compared to all others. Based on this metric, we found that ∼90% of mRNAs are asymmetrically distributed across all fractions, ∼60% when considering only cytoplasmic fractions, while ∼25% are fraction-specific (Fig. 3A,B). A similar prevalence of asymmetry was observed in both cell lines and with both PA and RD data sets (Fig. 3A,B; Supplemental Fig. S5A,B). Expectedly, transcripts classified as fraction-specific using this metric showed a clear regionalization toward the vertices of three-simplex graphs depicting HepG2 and D17 subcellular transcriptomes, in particular toward the nuclear, cytosolic, and insoluble fractions (Fig. 3C,D; Supplemental Fig. S5C,D). Notably, few mRNAs were specific to the membrane fraction, as most abundant membrane transcripts were also abundant in the insoluble or cytosolic compartments.
FIGURE 3.

The subcellular distribution of mRNAs from PA data sets is highly asymmetric and evolutionarily conserved. (A,B) Histograms showing the percent of asymmetrically distributed and fraction-specific mRNAs in HepG2 (A) and D17 (B) cells. (C,D) Simplex graphs (left panels) and pie charts (right panels) depicting the relative distribution and proportion of fraction-specific mRNAs, colored according to the fraction they are enriched in, relative to the total mRNA population in HepG2 (C) or D17 (D) cells. (E) Heatmap of the hierarchical clustering of percent FPKM of Drosophila and human orthologs. The hot metal color scale reflects the median-centered distributions of pFPKM. (F) Bubble plot showing examples of relative fraction enrichment profiles of orthologous fly and human mRNAs. Gradient blue coloration and bubble size represent log10(FPKM) and pFPKM values, respectively. (G) A distance measurement score was devised by summing the differences in fraction-specific expression signatures for orthologous mRNAs (upper schematic). This metric was used to quantify the relative distance between all human and Drosophila orthologs (blue), and the values were binned according to distance range. Identical measurements were performed on the same population of mRNAs that were paired through random shuffling (gray). Vertical dotted lines indicate the median values of the distance distributions for orthologous and shuffled pairs. (C) Cytosolic, (M) membrane, (I) insoluble, (N) nuclear.
To assess whether mRNA asymmetry signatures are conserved between species, we next compared the fractionation profiles of 2541 mRNAs with high confidence one-to-one orthologs between Drosophila and human from the Ensembl database. Strikingly, unsupervised hierarchical clustering analysis revealed general similarities in the mRNA distribution profiles of corresponding HepG2 and D17 subcellular fractions, resulting in their coclustering (Fig. 3E). Analysis of pFPKM signatures revealed strong similarities for corresponding D17 and HepG2 subcellular fractions, with Pearson coefficients ranging from 0.33 (membrane) to 0.52 (cytosolic) (P < 2.2 × 10⁻¹⁶) (Supplemental Fig. S6), and similar fractionation profiles of specific orthologs (Fig. 3F). We further devised a distance measurement score (Fig. 3G, examples in upper chart), defined as the sum of the differences in pFPKM values across fractions for each ortholog pair, with values ranging from 0 (perfect colocalization) to 2 (perfectly asymmetric). This score conveys the similarity in relative localization of mRNA orthologs based on their respective pFPKM distribution profiles. By binning orthologous pairs by distance intervals (Fig. 3G, lower histogram), we found that orthologous transcripts show a significantly shorter average distance (dashed blue line) across fractions, compared to randomly shuffled pairs (dashed gray line) generated from the same starting transcript list (Wilcoxon–Mann–Whitney, P-value < 2.2 × 10⁻¹⁶). Collectively, these results indicate that the asymmetric localization of human and Drosophila mRNAs is highly prevalent and broadly conserved evolutionarily.
Subcellular localization properties of lncRNAs and circular RNAs
We next evaluated the global subcellular distribution properties of lncRNAs. As with coding transcripts, lncRNAs displayed a high prevalence of distribution, with ∼90% detected as asymmetric across all fractions, ∼75% among cytoplasmic compartments, while ∼30% were fraction-specific (Fig. 4A,B). Similar results were obtained whether considering RD or PA data sets (Fig. 4A,B; Supplemental Fig. S7A,B) and the fraction-specific lncRNAs exhibited striking regionalization when visualized in three-simplex format (Fig. 4C; Supplemental Fig. S7C). In both human and fly cells, the most highly asymmetric lncRNAs were primarily cytosolic or nuclear, whereas very few were specifically enriched within the insoluble or membrane fractions. While our standard asymmetry assessment considered all lncRNAs with a minimal expression threshold ≥1 FPKM, focusing our analysis on more highly expressed genes (≥10 FPKM) revealed a preferential enrichment within the cytosolic fraction (Fig. 4D; Supplemental Fig. S7D). Notwithstanding their prevalence within the cytosolic and nuclear fractions, we also identified a variety of lncRNAs displaying predominant targeting to each subcellular compartment interrogated, both in HepG2 and D17 cells (Fig. 4E). For example, the highly conserved RNA component of RNAse P (RPPH1 and RNAseP:RNA/CR32868) is cytosolically enriched in both human and fly cells. The imprinted maternally expressed H19 lncRNA, which is aberrantly regulated in Beckwith–Wiedermann Syndrome, shows a distinctive localization to the membrane fraction of HepG2 cells. Other fraction enriched transcripts include nuclear lncRNAs such as MALAT1 and CR42862, while transcripts such as RP11-342K6.1 and CR31845 are enriched in the insoluble fraction.
FIGURE 4.

LncRNAs from PA data sets are asymmetrically distributed and exhibit preferential polarization toward the nucleus and cytosol. (A,B) Histogram showing the percent of asymmetrically distributed and fraction-specific lncRNAs expressed in HepG2 (A) and D17 (B) cells, either using a standard expression threshold (≥1 FPKM) or focusing on highly expressed transcripts (≥10 FPKM). (C,D) Simplex graphs (C) and pie charts (D) depicting the relative distribution and proportion of fraction-specific lncRNAs, colored according to the fraction they are enriched in, relative to the total lncRNA populations detected in HepG2 or D17 cells at the expression thresholds indicated in A and B. (E) Genome browser views of candidate lncRNAs exhibiting fraction enrichment, either in HepG2 or D17 cells. (C) Cytosolic, (M) membrane, (I) insoluble, (N) nuclear.
With the recent emergence of circular RNAs (circRNA) as an intriguing class of cellular transcript generated through back splicing circularization (Chen 2016a), we next sought to interrogate our CeFra-seq data to glean insights into the subcellular compartmentalization features of these RNAs. For this, we first investigated the expression profiles of genes known to encode intron-derived circRNAs, such as ANKRD52. Indeed, the ANKRD52 locus (Fig. 5A), which transcribes an mRNA coding for a PP6 phosphotase subunit, as well as a circRNA derived from its second intron (Zhang et al. 2013), reveals a primarily insoluble mRNA signature and strong intron 2 read peak in the cytosol. This intronic peak was present in RD samples, but absent in PA samples, and presumably represents a circRNA signature. To gain a broader view of putative circRNA fractionation properties, we next assessed FPKM values for 103 intronic regions known to produce circRNAs, previously characterized by Zhang et al. (2013). As shown in circos plot (Fig. 5B) and box plot (Fig. 5C) representations, FPKMs aligning to circRNA-producing introns were enriched in the cytosolic and membrane fractions, with a striking depletion from the insoluble compartment. In contrast, analysis non-circRNA-producing introns revealed weak expression signatures that were primarily restricted to the nucleus, likely attributable to the unspliced pri-mRNA, whether focusing on a random selection of 103 introns (Fig. 5D) or all Ensembl-annotated introns (Supplemental Fig. S8A,B). These results are consistent with recent findings that circRNAs are present in the cytoplasm and can be translated (Jeck et al. 2013; Zhang et al. 2013; Jeck and Sharpless 2014).
FIGURE 5.

CircRNA exhibit distinct distribution compared to their host mRNAs and display cytosolic and membrane enrichments. (A) Genome browser view showing RNA-seq read coverage within the ANKRD52 locus across HepG2 subcellular fractions detected via either RD or PA sequencing. (B) Circos plot showing the expression, in FPKM, of 103 intronic regions known to encode circRNAs in human cells. The width of the bar is relative to the length of the intron and the height to its expression within the indicated fractions of HepG2 cells. (C,D) Relative expression of the 103 circRNA-producing introns (C) detailed in B and 103 randomly selected introns (D). (E–H) Identification of putative back-spliced circRNAs using the CIRCexplorer algorithm with HepG2 and D17 data sets. (E,G) Venn diagrams of the number of individual circular RNAs detected within the indicated fractions in HepG2 (E) and D17 (G) cells. (F,H) Boxplots showing the FPKM values of these putative circRNAs within the indicated fractions in HepG2 (F) and D17 (H) cells. (C) Cytosolic, (M) membrane, (I) insoluble, (N) nuclear.
To evaluate circRNA distribution properties using an orthogonal approach, we adapted the CIRCexplorer protocol (Zhang et al. 2016) to search for signature back-spliced junction reads corresponding to circRNAs. This enabled us to identify 1159 and 173 putative circRNAs in our human and fly RD data sets, respectively; which were primarily detectable in the cytosolic or membrane fractions in both species (Fig. 5E–H). As expected, no circRNA junction reads were identified in our PA data sets. We also sought to assess whether there is any relation between the distribution features of circRNAs and that of the cognate mRNAs from which they derive. For this, similarly to our analysis of orthologous mRNAs, we computed a distance measurement between the relative localization of an mRNA and its derived circRNA across fractions for each mRNA/circRNA pair (Supplemental Fig. S8C). These analyses revealed that the distances measured for true mRNA/ciRNA pairs was indistinguishable from randomly shuffled pairs, indicating that there is no broad concordance between the localization patterns of mRNA and circRNA transcripts originating from the same locus. Altogether, we conclude that noncoding transcripts, such as lncRNAs and circRNAs, exhibit a high prevalence of subcellular localization in eukaryotic cells.
Comparison of protein and mRNA distribution signatures across subcellular fractions
To characterize the proteomic signatures generated with the fractionation procedure, we next performed liquid chromatography tandem mass spectrometry (LC–MS/MS) analysis of proteins isolated from the same subcellular fractions as our RNA samples (Supplemental Files S5, S6). Using a stringent filtering procedure (see Materials and Methods), we identified 1890 proteins expressed across HepG2 cell fractions. The proteomic signature of each fraction was distinctive (Supplemental Fig. S9) and demarcated functionally coherent protein repertoires associated with specific Gene Ontology (GO) annotations (Supplemental Table S2), which matched several of the GO term enrichments observed for fraction-specific mRNAs (Supplemental Table S3). To evaluate the fractionation similarities of mRNAs and their encoded proteins, we first calculated Spearman correlations of expression signatures, comparing FPKM and spectrum count values as well as asymmetry, comparing pFPKM and percent spectrum counts for mRNA/protein pairs in each fraction. These simple comparisons revealed modest but significant fraction-specific positive correlations in expression, with values ranging from 0.24 to 0.34 for HepG2 fractions and 0.3 to 0.47 for D17 fractions (P-values < 2.2 × 10⁻¹⁶) (Fig. 6A, left panel). The fraction-specific correlation of asymmetry showed weaker values, ranging from −0.03 to 0.16 in human cells and −0.16 to 0.16 in fly cells (P-values < 2.2 × 10⁻¹⁶) (Fig. 6A, right panel). These generally modest correlation scores were expected, as they are likely to be influenced by cases of mRNA–protein pairs exhibiting strong asymmetric distribution across fractions. Indeed, three-simplex graphs displaying the relative distribution of mRNA/protein pairs for specific protein complexes revealed several striking features (Fig. 6B). Firstly, when compared among each other, functionally related mRNAs tended to cluster to specific regions of the simplex, a feature that was even more pronounced at the protein level, underlining a general coherence in the distribution properties of mRNA and protein subgroups. In contrast, comparison of mRNA versus protein subsets revealed varying degrees of proximity (Fig. 6B,C). For example, mRNAs for components of the actin-related protein 2/3 (Arp2/3) complex, which are known to undergo localized translation in the cellular cortex (Mingle et al. 2005), were coclustered with their encoded protein products (Fig. 6B). Transcripts encoding ribosomal proteins localized to the cytosol, while their protein products show enrichment toward the insoluble/membrane fractions. Components of the PA700 regulatory complex of the 26S proteasome were also asymmetrically partitioned, with mRNAs displaying insoluble/membrane partitioning, while the protein components localize toward the cytosolic vertex (Fig. 6B). These examples underline the variability in subcellular localization properties of specific classes of mRNA/protein pairs.
FIGURE 6.

Proteins are asymmetrically detected in each fraction in patterns that demonstrate specific colocalization with mRNA for a specific subset of genes. (A) Summary table of the Spearman correlation values of mRNA/protein expression (left) and mRNA/protein asymmetry (right) within the indicated HepG2 and D17 fractions. (B) Simplex graphs depicting the relative distribution profiles of components of different protein complexes (blue) and their corresponding mRNAs (red). (C) Boxplot of the distance measurement scores of protein components of specific biochemically defined protein complexes and their corresponding mRNAs. (C) Cytosolic, (M) membrane, (I) insoluble, (N) nuclear.
To further assess the relationship between the distribution features of mRNAs and that of their encoded proteins, we calculated a percent spectrum count, similar to the pFPKM metric used to define RNA signatures. We further used our distance measurement scores, summing the absolute values of the differences in pFPKM and percent spectrum counts across fractions, for all mRNA/protein pairs detected in our samples. To deconvolve the data in a functionally relevant manner, we evaluated the distance measurements displayed by mRNAs encoding subunits of experimentally defined protein complexes tabulated within the CORUM database (Ruepp et al. 2010), focusing on complexes containing at least three subunits and for which we had localization data for at least 75% of the subunits (Fig. 6C). Overall, more than a third of the clusters meeting our strict thresholds show relative proximity with a distance less than 1 and more than 10% could be defined as colocalizing with a distance less than 0.5. These results suggest that mRNA localization may serve to modulate the subcellular partitioning of several protein machineries through localized translation.
Asymmetrically distributed mRNAs exhibit conserved features
Having identified subsets of fraction-specific mRNAs, we next sought to assess whether these transcripts exhibit distinctive features. For this, we investigated specific sequence attributes of fractionated mRNA populations, such as the average length of 5′ untranslated regions (5′ UTR), coding sequences (CDS) and 3′ UTRs, or the exon (Fig. 7A). While 5′ UTR lengths were similar across cytoplasmic compartments in both HepG2 and D17 cells, significant differences were apparent when exploring other sequence features. For instance, cytosolic mRNAs exhibit significantly shorter CDS and 3′ UTRs compared to other fractions, whereas the 3′ UTRs of membrane (in both human and fly cells) and insoluble (in human cells) transcripts were longer on average, suggesting that these transcripts may be more susceptible to post-transcriptional regulatory events mediated by 3′ UTR trans-regulatory factors. Finally, the CDS of mRNAs enriched in the insoluble and nuclear fractions are longer and contain a significantly larger number of exons compared to other fractions. This observation likely reflects the propensity for longer and more intricately spliced mRNAs to require a prolonged nuclear residence time for their synthesis and maturation. We next evaluated the fractionation properties of mRNA populations known to undergo specific modes of maturation control. For instance, when considering mRNAs encoding secretory proteins bearing signal peptides or transmembrane domains, we observed enrichment for these transcripts in the cytosolic and membrane fractions (Supplemental Fig. S10A), with marked depletion in insoluble, consistent with the known transiting of these mRNAs from the cytosol to the ER via the signal recognition particle. In contrast, canonical histone mRNAs, which are nonpolyadenylated and undergo specialized 3′ end processing steps involving a highly conserved stem–loop element, are enriched in the cytosolic fraction in both HepG2 and D17 cells (Supplemental Fig. S10B). Thus, such transcript features help demarcate subcellular localized mRNAs pool and may influence localization control.
FIGURE 7.

Subcellular fractions are enriched for mRNAs with distinctive sequence features and RNA-binding protein (RBP) families in both human and Drosophila cells. (A) Boxplots of the longest isoform lengths of the indicated RNA regions (5′UTR, CDS, or 3′UTR) and total exon numbers for fraction-specific and not fraction-specific mRNAs in HepG2 (upper panel) and D17 (lower panel) cell fractions. (B) Boxplots indicating the relative fraction distribution profiles of all RBP with identified orthologs in HepG2 and D17 or specific subfamilies of these RBP bearing distinctive RNA-binding domains, in both HepG2 (upper panel) and D17 (lower panel).
Our findings that fraction mRNAs exhibit distinctive features that are evolutionarily conserved in human and Drosophila cellular models prompted us to investigate whether RNA regulatory factors also show conserved localization properties. RNA-binding proteins (RBPs) are deeply conserved and essential modulators of RNA metabolism including RNA localization, which can be separated into distinct classes based on the nature of their RNA-binding domain (RBDs). To assess whether RBPs also exhibit conserved subcellular distribution features between human and fly, we next evaluated the fractionation profiles of specific classes of factors defined by the type of RBD they contain. Through orthology searches enabling one-to-many or many-to-many relationships, we were able to define a conserved set 410 and 452 orthologous RBPs, respectively, represented in our D17 and HepG2 LC–MS/MS data sets. As a whole, the pool of orthologous proteins displayed higher peptide abundance in the cytosol, with a lower expression in the membrane, insoluble or nuclear fractions (Fig. 7B, leftmost boxplot). This distribution was similar to that exhibited by the total pool of human or fly proteins detected in our LC–MS/MS data sets (Supplemental Fig. S9). From the list of protein orthologs, we then subclassified proteins with known RBDs, as defined within the Pfam and Interpro databases, and evaluated their distribution profiles in human or Drosophila cells (Fig. 7B). Interestingly, RBPs belonging to different families exhibited similar subcellular distribution profiles in the interrogated cellular models. Moreover, the profiles exhibited by the different RBD families were distinctive. Indeed, several families of RBPs, including those containing KH, RRM, DEAD, and CCHC-zinc finger domains, were enriched within the insoluble or nuclear fractions. In contrast, proteins bearing the La motifs, implicated in transcription and cell proliferation, tend to localize in the insoluble fraction; whereas proteins bearing LSM domains were enriched in the cytosol and nucleus. As the distinctive asymmetric distribution patterns of RBP families appear to be generally conserved evolutionarily, this may explain why transcriptome distribution properties are also generally conserved.
DISCUSSION
In the last few decades, the subcellular localization of RNA molecules has emerged as an important step in post-transcriptional gene regulation, impacting many biological processes that rely on polarized intracellular activities. However, the general prevalence of RNA asymmetry on a transcriptome-wide scale has remained unclear. To address this question, we utilized herein a cell fractionation and RNA-sequencing strategy, termed CeFra-seq, to probe the RNA content of subcellular compartments sequentially generated from starting cellular populations of human and Drosophila cells. This comparative profiling approach shows that isolated compartments exhibit distinctive profiles of RNA biotype composition and that these asymmetries are both highly prevalent and evolutionarily conserved.
Biochemical purification and high-throughput RNA expression analysis, either using microarray or RNA-seq as a read out, has been used in several studies to identify specific populations of RNAs associated with structures such as the nucleus (Bhatt et al. 2012; Tilgner et al. 2012; Bahar Halpern et al. 2015; Lefebvre et al. 2016), cytoplasm (Bhatt et al. 2012; Bahar Halpern et al. 2015; Carlevaro-Fita et al. 2016), cytosol (Chen et al. 2011; Tilgner et al. 2012; Wang et al. 2012; van Heesch et al. 2014), the ER (Kopczynski et al. 1998; Diehn et al. 2000, 2006; Lerner et al. 2003; de Jong et al. 2006), mitochondria (Marc et al. 2002), microtubules (Blower et al. 2007; Sharp et al. 2011), pseudopodia (Mili et al. 2008), and neuronal projections (Eberwine et al. 2001; Job and Eberwine 2001; Moccia et al. 2003; Poon et al. 2006; Zivraj et al. 2010; Gumy et al. 2011; Khaladkar et al. 2013; Sasaki et al. 2014; Taliaferro et al. 2016). However, these efforts generally focused on defining enriched transcript populations associated with single structures, without simultaneously probing RNA expression signatures across other compartments derived from the same starting cellular specimens, thus limiting the capacity to evaluate global RNA localization prevalence. By using a comparative multicompartment profiling strategy, we demonstrate that the majority of cellular RNA transcripts (>80%) are asymmetrically distributed, whether considering mRNAs or noncoding transcripts, patterns that appear conserved evolutionarily. While previous FISH-based imaging screens in syncytial embryos of Drosophila revealed a high degree of localization (∼70%) among ∼6000 interrogated mRNA species (Lécuyer et al. 2007; Wilk et al. 2016), the present study offers one of the most comprehensive surveys of transcriptome subcellular distribution to date, revealing that this phenomenon is a basic feature of cellular organization that can be generalized to standard cellular models.
We found that mRNAs targeted to different regions of the cytoplasm exhibit distinctive features in terms of the overall length of their coding regions and 3′UTRs; with the cytosolic fraction preferentially composed of shorter mRNAs with lower exon complexity and shorter 3′UTR segments, while membrane and insoluble compartment mRNAs are longer and more complex. Since RNA localization and stability control elements often reside in mRNA 3′UTRs, these data suggest a model whereby targeting of mRNAs to membrane and insoluble (cytoskeletal) compartments may involve more elaborate regulatory information. In contrast, localization of RNAs to the cytosol, which can be achieved by simply exporting the mRNA from the nucleus, likely requires simpler targeting information. For example, mRNAs encoding histones and ribosomal proteins, which tend to be short and involve special regulatory mechanisms, exhibit preferential cytosolic targeting. Simple cytosolic targeting may prove beneficial for proteins that must reenter the nucleus to carry out their functions, as in the case of histones, which are central to chromatin formation, or for ribosomal proteins that are required in the nucleus for ribosome subunit assembly (Kressler et al. 2017).
Our results also extend the assessment of RNA localization prevalence to noncoding components of the transcriptome, such as lncRNAs and circRNAs. The steady-state nuclear versus cytoplasmic distribution features of lncRNAs has been an issue of debate, with early reports suggesting an enrichment for these transcripts in the nucleus (Mondal et al. 2010; Derrien et al. 2012), where they have been implicated in the epigenetic regulation of gene expression; while more recent studies documented significant lncRNA signatures within cytoplasmic compartments and in association with ribosomes (Ingolia et al. 2011; van Heesch et al. 2014; Carlevaro-Fita et al. 2016). The CeFra-seq approach reveals higher representation of lncRNA reads within the cytosolic and nuclear fractions, and a general under-representation in membrane and insoluble compartments, signatures that were similar in human and fly cells. These findings are consistent with the notion that subcellular fates of lncRNAs are diverse (Cabili et al. 2015; Chen 2016b), possibly enabling these transcripts to carry out distinct regulatory functions in specific intracellular locales. In the case of circRNAs, early reports suggested that they tended to be nuclear-enriched (Zhang et al. 2013), although recent studies have shown that these transcripts can associate with cytoplasmic ribosomes and undergo translation (Legnini et al. 2017; Pamudurti et al. 2017). Our results, gleaned by analyzing read coverage at intronic locations known to produce circRNAs and using a back-spliced junction read mapping algorithm, reveal a higher expression level of circRNAs within the cytosolic and membrane fractions, suggesting possible regulatory functions outside the nucleus. Altogether, these results highlight the potential usefulness of CeFra-seq methodology to segment noncoding RNAs into subgroups that may share common functional properties or interact physically to modulate cellular function.
Previous studies comparing global mRNA and protein expression signatures have generally revealed moderate levels of expression correlation, suggesting that post-transcriptional regulatory steps (e.g., translation rates, mRNA and protein decay) are a primary determinant of proteomic output of the transcriptome (Schwanhäusser et al. 2011; Vogel and Marcotte 2012; Liu et al. 2016). In this study, we sought to assess the potential relationship between mRNA and protein expression at the subcellular level by jointly profiling their expression signatures across our fractionated compartments. While the expression correlations within fractions for specific mRNA/protein pairs were generally good, comparison of asymmetry measurements (i.e., their distribution profiles across fractions) revealed a general absence of correlation, consistent with a previous study contrasting mRNA/protein profiles in cell bodies versus protrusions of migratory cells (Mardakheh et al. 2015). In light of the data presented here, it is clear that these overall distribution correlations are likely to be heavily influenced by examples of mRNA/protein pairs with strong asymmetric distribution. This led us to analyze the distribution signatures of mRNAs encoding components of well-defined protein complexes. A first striking characteristic to emerge is that functionally related mRNA subsets tend to cluster together in these graphs, as do the protein modules they specify, implying the existence of coherent sorting mechanisms. The second feature is that there is broad variability in codistribution profiles of mRNA/protein sets depending on the protein modules under consideration, ranging from cases with more proximal targeting of mRNA/protein pairs (e.g., Arp2/3, Vigilin) and others that were very distant (e.g., ribosome, proteasome). This suggests that protein modules exist on a gradual continuum of codistribution with their encoding mRNAs, while also underlining the notion that regulated mRNA localization may serve different purposes mechanistically. Cases in which mRNA/protein pairs cofractionate are likely to represent instances in which localized translation contributes to the assembly of protein complexes, as has been shown for components of the Arp2/3 complex (Mingle et al. 2005). In contrast, for mRNA/protein pairs exhibiting divergent fractionation behavior, i.e., with apparent steady-state accumulation in distinct subcellular locales, this may underlie cases where transcripts are subject to a generalized storage mechanism or to localized repression, which may be altered under specific contexts, such as cellular state transitions, during the cell cycle or in response to environmental signaling cues (Prasanth et al. 2005; Iampietro et al. 2014).
In summary, the CeFra-seq methodology presented herein offers an efficient approach to interrogate global subcellular transcriptome distribution features, as well as parallel analysis of recovered protein samples. In addition to offering insights into subcellular transcriptome targeting, the approach can allow detection of rare transcripts that display low overall cellular abundance, but may become detectable when profiling specific subcellular compartments. Indeed, we identified a significant number of transcripts that were fraction exclusive and otherwise would have escaped detection if solely focusing on whole-cell profiling at similar sequencing depth. In that sense, CeFra-seq may offer similar advantages to the capture-seq methodologies developed to deeply survey RNA species synthesized from precise genomic loci (Mercer et al. 2011). In light of the growing number of diseases implicating RNA localization defects, CeFra-seq methodology will prove extremely useful for dissecting the specific molecular alterations associated with these disorders.
MATERIALS AND METHODS
Cell culture and antibodies
The ML-D17c3 cell line, stock 107, was obtained from the Drosophila Genomics Resource Center cell line repository (http://dgrc.cgb.indiana.edu/). Cells were grown on pretreated tissue culture dishes with extracellular matrix as previously described (Currie and Rogers 2011) in M3 media (S-8398, Sigma-Aldrich) containing 1 mg/mL of yeast extracts (Y-1000, Sigma-Aldrich) and 2.5 mg/mL of bactopeptone (211677, Difco), 10% FBS (SH30070.02, Hyclone), and 10 mg/mL of insulin (I0516-5ml Sigma-Aldrich). The HepG2 cell line was kindly provided by B. Graveley (Institute for Systems Genomics, UCONN Health Center, Farmington) and maintained in Dulbecco's modified Eagle's medium (DMEM) (SH30022.01, Hyclone) supplemented with 10% FBS and 1% penicillin/streptavidin (15140-163, Invitrogen).
Rabbit polyclonal anti-Histone H3 (ab1791) and mouse monoclonal anti-α-tubulin (clone DM1A) were obtained from Abcam and Sigma-Aldrich, respectively. Mouse monoclonal anti-KDel (ADI-SPA-827), mouse monoclonal anti-Shot (mABRod1), and mouse monoclonal anti-ninein (clone F-5) were purchased from Enzo Life Sciences, the Developmental Studies Hybridoma Bank and Santa Cruz, respectively.
Cell fractionation procedure
D17 (3.5 × 10⁷) and HepG2 (2.5 × 10⁷) cells were used for the fractionation procedure, as described in Lefebvre et al. (2017). Briefly, after PBS washes, 1/10th of the cells are kept aside as Total extract, and the remaining cells were resuspended and incubated in cold hypotonic buffer (20 mM Tris–HCl [pH = 7.5]), 10 mM KCl, 1.5 mM MgCl2, 5 mM EGTA, 1 mM EDTA, 1 mM DTT, 1 mM PMSF, 0.15 U/mL Aprotinin, 20 µM leupeptin, 40 U/mL RNase Out (Thermo Fisher Scientific) for 20 min. Swelled cells were transferred into a homogenizer chamber and dounced for 15 strokes for D17 and 5 strokes for HepG2. After centrifugation of the homogenate at 1200g for 10 min at 4°C, the supernatant corresponding to the cytosolic fraction was conserved apart while the pellet was rinsed with 100 µL of hypotonic buffer and mixed with 0.5 mL of sucrose buffer 0.32 M (0.32 M sucrose, 3 mM CaCl2, 2 mM MgOAc, 0.1 mM EDTA, 10 mM Tris–HCl [pH = 8], 1 mM DTT, 0.5% v/v NP-40, protease inhibitors, and RNase out) and 0.5 mL of sucrose buffer 2.0 M (2.0 M sucrose, 5 mM MgOAc, 0.1 mM EDTA, 10 mM Tris–HCl [pH = 8], 1 mM DTT, protease inhibitors, and RNase out). The sucrose homogenate was loaded on top of 0.5 mL of sucrose 2.0 M in a polyallomer tube and centrifuged at 30,000g for 30 min at 4°C in a Sorvall RPS55 rotor to collect a pellet corresponding to the nuclear fraction. The cytosolic, membrane and insoluble fractions were prepared from the cytosolic homogenate by centrifugation at 100,000g for 1 h at 4°C in a Sorvall RP100 AT4 rotor. The supernatant was collected as the cytoplasmic fraction while the pellet was resuspended in 1 mL of Hypotonic Lysis Buffer containing 1% Triton X-100, dounced for 40 times on ice and incubated in ice for 1 h. After centrifugation at 100,000g for 30 min at 4°C in the Sorvall RP100 AT4 rotor, the supernatant was collected as the membrane fraction and the pellet was rinsed and used as the insoluble fraction.
RNA and protein extractions
At each step of the cell fractionation, the collected supernatants and pellets were immediately resuspended in 1 mL of TRIzol-LS or TRIzol, respectively. RNAs were isolated following TRIzol extraction procedure from the aqueous phase and resuspended in water, while proteins were extracted from the organic phase. For the proteins extraction, 0.3 mL of ethanol was added to 0.6 mL of organic phase and incubated 5 min at 25°C. After centrifugation at 3000g for 5 min at 4°C, the supernatant was mixed with 0.750 mL of isopropanol, incubated for 10 min at 25°C and centrifuged at 13,000g for 10 min at 4°C. The pellet was washed three times for 20 min at 25°C with 1 mL of 0.4 M guanidine hydrochloride in 95% isopropanol and once with 1 mL of ethanol 75%. The pellet was finally resuspended in 0.5 M unbuffered Tris containing 5% SDS.
RT-qPCR and western blot validations
RNA extracts from each fraction were subjected to reverse transcription using random hexamers and RT-MMLV (Invitrogen) followed by real-time (RT) quantitative PCR (qPCR) analyses using gene-specific primer pairs for:
SNORD17: Fw:5′-CTG CCA ACA CAC AAG CAG TT-3′; Rv:5′-CTT GCA GCC TTG TGA AAT GA-3′
RN7SK: Fw:5′-CCA TTT GTA GGA GAA CGT AGG-3′; Rv:5′-CCT CAT TTG GAT GTG TCT GG-3′
MT-CO1: Fw:5′-CAA ACC ACA AAG ACA TTG GAA; Rv:5′-GCA CCG ATT ATT AGG GGA AC-3′
TJP1: Fw:5′-GCT TAC CAC ACT GTG ATC CT; Rv:5′-CAC AGT TTG CTC CAA CGA G-3′
hsr-omega: Fw:5′-CCA CAA CAA AAT GAA CCA CAA; Rv:5′-CAA TTT TGA ATT GGG GCA GT-3′
Rpl23a: Fw:5′-GTG AAG CCC GTG ACC AAG; Rv:5′-AGG CGC CCT TGA TGA TCT-3′
mt-NDF6: Fw:5′-TCA TCC ATT AGC TTT AGG ATT AAC TTT-3′; Rv: 5′-TTT CAT TAG AGG CTA AAG ATG TTA CG-3′
dlg-1: Fw:5′-CTG GAT AAG CAA TCG ACA TTG G-3′; Rv: 5′- CAT TCT TCT CAT CGC GAC TC-3′
Quantitative PCR analyses were performed using the PowerUp SYBR Green Master Mix kit (Applied Biosystems, Thermo Fisher Scientific) on Viia7 Real-Time PCR system (Applied Biosystems, Thermo Fisher Scientific). For the western blot, protein extracts from each fraction were loaded on a 11% SDS-PAGE gel and transferred onto nitrocellulose membranes. Following incubation (16 h, 4°C) with primary antibodies corresponding to fraction-specific markers, blots were washed and incubated with appropriate HRP-conjugated secondary antibodies for 1 h. Signals were detected by enhanced luminescence (Clarity Western ECL Substrate, BIO-RAD) with the Gel Doc XR+ imaging system (BIO-RAD).
Library generation and RNA sequencing
Before library generation, the quality of the RNAs extracted from each sample was validated using the Agilent 2100 Bioanalyzer device and the RNA 6000 Pico Chip. RNA-seq libraries were prepared with the Illumina TruSeq mRNA Stranded kit from rRNA-depleted RNA samples (Ribo-Zero Magnetic Gold Kit for Human and Drosophila kit, Epicentre) or from poly(A) enriched RNA samples [NEBNext poly(A) mRNA, New England Biolabs]. Deep sequencing was performed using the Illumina HiSeq2000 sequencer (paired-end 50 cycles).
In silico analysis of RNA sequencing and proteomics data
Read quality was assessed using FastQC v0.11.5. No trimming was deemed necessary. Read alignment was executed using TopHat v2.1.0 on the human GRCh37/hg19 and the Drosophila BDGP5.78/dm3 genomes, respectively. Read count was obtained with featureCounts v1.5.0-p1. Normalized FPKM values and differential expression were computed with DESeq2 v1.10.1. Metrics about the alignment were obtained with Picard CollectRnaSeqMetrics program. We only considered transcripts with fragments per kilobase per million mapped reads (FPKM) ≥1. Percent FPKM (pFPKMi = FPKMi/∑k∈{C,M,I,N}FPKMk where i is a given gene in a given fraction) was calculated as the relative distribution unit. Transcript per million [TPMx = (FPKMx/∑ FPKMy) × 106, where x is a given gene in a given fraction and y represents all the genes observed in this fraction] was calculated as the relative abundance unit. We grouped as “other” all biotypes where the highest TPM in any given fraction was below 1%.
Attributes such as biotypes and longest isoform length were obtained via the R biomaRt package (Durinck et al. 2009). Expected gene length was obtained by calculating the normalized weighted average of each gene. For each individual fraction, this is , where TPMi is the expression value of a given gene i, L is its length, and j the total number of genes of a given biotype. All calculations and correlations were performed using R.
For proteomics data, spectrum count and probability was calculated with scaffold v4.4.8. We only conserve protein with a minimum number of two peptides and a peptide threshold and a protein probability of 95%. The Gene Ontology term statistical overrepresentation test was performed using Panther v11 (Mi et al. 2017). Protein complexes were obtained from the CORUM databases release 30-10-2016 (Ruepp et al. 2010).
Orthologs associations
We retrieved orthologous genes between fly and human via the R biomaRt package selecting those with high confidence (Durinck et al. 2009). We then filtered this list to keep only the genes with at least 1 FPKM in at least one fraction for both species.
Circular intronic RNA analysis
We downloaded the list of 103 circular intronic RNA identified and characterized by Zhang et al. (2013) as a bed file from circbase and reported the counts of alignment in our bam files with bedtools multicov (Quinlan and Hall 2010; Glažar et al. 2014).
Regular three-simplex (tetrahedron) representation of cellular compartments
Gene asymmetry within a three-simplex space was obtained by computing a vector resulting from the relative distribution of a given gene from each fraction projected into each compartment represented by the three-simplex. Assuming a three-simplex centered at the origin with coordinates V1 = (−1/3, −sqrt(2)/3, −sqrt(2/3)), V2 = (−1/3, −sqrt(2)/3, sqrt(2/3)), V3 = (−1/3, sqrt(8)/3, 0, V4 = (1,0,0)), in Cartesian space, this is defined as X = pFPKM_ cyto * (−1/3) + pFPKM_membr * (−1/3) + pFPKM_insol * (−1/3) + pFPKM_nucl * (1), Y = pFPKM_cyto * (−sqrt(2)/3) + pFPKM_membr * (−sqrt(2)/3) + pFPKM_insol * (sqrt(8)/3), Z = pFPKM_cyto * (−sqrt(2/3)) + pFPKM_membr * (sqrt(2/3)).
Prediction back-spliced junctions for circular RNAs
Previously unmapped reads were re-aligned with tophat-fusion (--fusion-search --keep-fasta-order --bowtie1--no-coverage-search) and then we applied the circExplorer algorithm to identify putative circRNA (Zhang et al. 2013).
DATA DEPOSITION
Raw sequencing data are available on the ENCODE portal (https://www.encodeproject.org/) under the experiment ID numbers: ENCSR931WGT (HepG2-cytosolic-PA); ENCSR541TIG (HepG2-membrane-PA); ENCSR019MXZ (Hepg2-insoluble-PA); ENCSR058OSL (HepG2-nuclear-PA); ENCSR862HPO (Hepg2-cytosolic-RD); ENCSR887ZSY (HepG2-membrane-RD); ENCSR813BDU (HepG2-insoluble-RD); ENCSR061SFU (HePG2-nuclear-RD); ENCSR283YJX (D17-cytosolic-PA); ENCSR053CWY (D17-membrane-PA); ENCSR622ROA (D17-insoluble-PA); ENCSR473SBP (D17-nuclear-PA); ENCSR432GTP (D17-cytosolic-RD); ENCSR302HSE (D17-membrane-RD); ENCSR772QDO (D17-insoluble-RD); ENCSR197ZHM (D17-nuclear-RD).
SUPPLEMENTAL MATERIAL
Supplemental material is available for this article.
Supplementary Material
ACKNOWLEDGMENTS
We thank Christopher Burge (MIT), Eric T. Wang (University of Florida), Brenton Graveley, Michael Duff, Xintao Wei (UCONN Health Center), Sebastian Markmiller and Gene Yeo (UCSD), and Atefeh Mohajeri (McGill University) for insightful discussions about CeFra-seq over the years. We are grateful to Alexis Blanchet-Cohen and Odile Neyret (IRCM) for their help with transcriptomic analyses. F.A.L. is supported by a Canadian Institutes of Health Research (CIHR) scholarship, J.B. and C.D. by postdoctoral scholarships from the Fonds de Recherche Québec Santé (FRQS), while E.L. is a Junior 2 FRQS research scholar. This work was supported by grants to E.L. from CIHR, FRQS, and the Canadian Cancer Society.
Author contributions: E.L., N.A.L.C., and L.P.B.B. contributed to conceptualization; L.P.B.B. and N.A.L.C. contributed to methodology; L.P.B.B., N.A.L.C., J.B., F.A.L., C.D., and X.W. contributed to investigation; L.P.B.B. contributed to software; formal analysis was performed by L.P.B.B.; visualization by L.P.B.B.; L.P.B.B. and E.L. contributed to writing and original draft; L.P.B.B., J.B., C.D., M.B., and E.L. contributed to writing, reviewing, and editing; funding acquisition by E.L.; supervised by E.L. and M.B.
Footnotes
Article is online at http://www.rnajournal.org/cgi/doi/10.1261/rna.063172.117.
REFERENCES
- Bahar Halpern K, Caspi I, Lemze D, Levy M, Landen S, Elinav E, Ulitsky I, Itzkovitz S. 2015. Nuclear retention of mRNA in mammalian tissues. Cell Rep 13: 2653–2662. [DOI] [PMC free article] [PubMed] [Google Scholar]
- Batada NN, Shepp LA, Siegmund DO. 2004. Stochastic model of protein–protein interaction: why signaling proteins need to be colocalized. Proc Natl Acad Sci 101: 6445–6449. [DOI] [PMC free article] [PubMed] [Google Scholar]
- Batista PJ, Chang HY. 2013. Long noncoding RNAs: cellular address codes in development and disease. Cell 152: 1298–1307. [DOI] [PMC free article] [PubMed] [Google Scholar]
- Bergalet J, Lécuyer E. 2014. The functions and regulatory principles of mRNA intracellular trafficking. Adv Exp Med Biol 825: 57–96. [DOI] [PubMed] [Google Scholar]
- Bhatt DM, Pandya-Jones A, Tong AJ, Barozzi I, Lissner MM, Natoli G, Black DL, Smale ST. 2012. Transcript dynamics of proinflammatory genes revealed by sequence analysis of subcellular RNA fractions. Cell 150: 279–290. [DOI] [PMC free article] [PubMed] [Google Scholar]
- Blower MD, Feric E, Weis K, Heald R. 2007. Genome-wide analysis demonstrates conserved localization of messenger RNAs to mitotic microtubules. J Cell Biol 179: 1365–1373. [DOI] [PMC free article] [PubMed] [Google Scholar]
- Briese M, Saal L, Appenzeller S, Moradi M, Baluapuri A, Sendtner M. 2016. Whole transcriptome profiling reveals the RNA content of motor axons. Nucleic Acids Res 44: e33. [DOI] [PMC free article] [PubMed] [Google Scholar]
- Cabili MN, Dunagin MC, McClanahan PD, Biaesch A, Padovan-Merhar O, Regev A, Rinn JL, Raj A. 2015. Localization and abundance analysis of human lncRNAs at single-cell and single-molecule resolution. Genome Biol 16: 20. [DOI] [PMC free article] [PubMed] [Google Scholar]
- Cajigas IJ, Tushev G, Will TJ, tom Dieck S, Fuerst N, Schuman EM. 2012. The local transcriptome in the synaptic neuropil revealed by deep sequencing and high-resolution imaging. Neuron 74: 453–466. [DOI] [PMC free article] [PubMed] [Google Scholar]
- Carlevaro-Fita J, Rahim A, Guigó R, Vardy LA, Johnson R. 2016. Cytoplasmic long noncoding RNAs are frequently bound to and degraded at ribosomes in human cells. RNA 22: 867–882. [DOI] [PMC free article] [PubMed] [Google Scholar]
- Chen LL. 2016a. The biogenesis and emerging roles of circular RNAs. Nat Rev Mol Cell Biol 17: 205–211. [DOI] [PubMed] [Google Scholar]
- Chen LL. 2016b. Linking long noncoding RNA localization and function. Trends Biochem Sci 41: 761–772. [DOI] [PubMed] [Google Scholar]
- Chen Q, Jagannathan S, Reid DW, Zheng T, Nicchitta CV. 2011. Hierarchical regulation of mRNA partitioning between the cytoplasm and the endoplasmic reticulum of mammalian cells. Mol Biol Cell 22: 2646–2658. [DOI] [PMC free article] [PubMed] [Google Scholar]
- Cherbas L, Willingham A, Zhang D, Yang L, Zou Y, Eads BD, Carlson JW, Landolin JM, Kapranov P, Dumais J, et al. 2011. The transcriptional diversity of 25 Drosophila cell lines. Genome Res 21: 301–314. [DOI] [PMC free article] [PubMed] [Google Scholar]
- Cody NA, Iampietro C, Lécuyer E. 2013. The many functions of mRNA localization during normal development and disease: from pillar to post. WIREs Dev Biol 2: 781–796. [DOI] [PubMed] [Google Scholar]
- Currie JD, Rogers SL. 2011. Using the Drosophila melanogaster D17-c3 cell culture system to study cell motility. Nat Protoc 6: 1632–1641. [DOI] [PMC free article] [PubMed] [Google Scholar]
- de Jong M, van Breukelen B, Wittink FR, Menke FL, Weisbeek PJ, Van den Ackerveken G. 2006. Membrane-associated transcripts in Arabidopsis; their isolation and characterization by DNA microarray analysis and bioinformatics. Plant J 46: 708–721. [DOI] [PubMed] [Google Scholar]
- Derrien T, Johnson R, Bussotti G, Tanzer A, Djebali S, Tilgner H, Guernec G, Martin D, Merkel A, Knowles DG, et al. 2012. The GENCODE v7 catalog of human long noncoding RNAs: analysis of their gene structure, evolution, and expression. Genome Res 22: 1775–1789. [DOI] [PMC free article] [PubMed] [Google Scholar]
- Diehn M, Eisen MB, Botstein D, Brown PO. 2000. Large-scale identification of secreted and membrane-associated gene products using DNA microarrays. Nat Genet 25: 58–62. [DOI] [PubMed] [Google Scholar]
- Diehn M, Bhattacharya R, Botstein D, Brown PO. 2006. Genome-scale identification of membrane-associated human mRNAs. PLoS Genet 2: e11. [DOI] [PMC free article] [PubMed] [Google Scholar]
- Durinck S, Spellman PT, Birney E, Huber W. 2009. Mapping identifiers for the integration of genomic datasets with the R/Bioconductor package biomaRt. Nat Protoc 4: 1184–1191. [DOI] [PMC free article] [PubMed] [Google Scholar]
- Eberwine J, Miyashiro K, Kacharmina JE, Job C. 2001. Local translation of classes of mRNAs that are targeted to neuronal dendrites. Proc Natl Acad Sci 98: 7080–7085. [DOI] [PMC free article] [PubMed] [Google Scholar]
- Garcia M, Darzacq X, Delaveau T, Jourdren L, Singer RH, Jacq C. 2007. Mitochondria-associated yeast mRNAs and the biogenesis of molecular complexes. Mol Biol Cell 18: 362–368. [DOI] [PMC free article] [PubMed] [Google Scholar]
- Gerstberger S, Hafner M, Tuschl T. 2014. A census of human RNA-binding proteins. Nat Rev Genet 15: 829–845. [DOI] [PMC free article] [PubMed] [Google Scholar]
- Glažar P, Papavasileiou P, Rajewsky N. 2014. circBase: a database for circular RNAs. RNA 20: 1666–1670. [DOI] [PMC free article] [PubMed] [Google Scholar]
- Gumy LF, Yeo GS, Tung YC, Zivraj KH, Willis D, Coppola G, Lam BY, Twiss JL, Holt CE, Fawcett JW. 2011. Transcriptome analysis of embryonic and adult sensory axons reveals changes in mRNA repertoire localization. RNA 17: 85–98. [DOI] [PMC free article] [PubMed] [Google Scholar]
- Hartwell LH, Hopfield JJ, Leibler S, Murray AW. 1999. From molecular to modular cell biology. Nature 402: C47–C52. [DOI] [PubMed] [Google Scholar]
- Howell KE, Devaney E, Gruenberg J. 1989. Subcellular fractionation of tissue culture cells. Trends Biochem Sci 14: 44–47. [DOI] [PubMed] [Google Scholar]
- Iampietro C, Bergalet J, Wang X, Cody NA, Chin A, Lefebvre FA, Douziech M, Krause HM, Lécuyer E. 2014. Developmentally regulated elimination of damaged nuclei involves a Chk2-dependent mechanism of mRNA nuclear retention. Dev Cell 29: 468–481. [DOI] [PubMed] [Google Scholar]
- Ingolia NT, Lareau LF, Weissman JS. 2011. Ribosome profiling of mouse embryonic stem cells reveals the complexity and dynamics of mammalian proteomes. Cell 147: 789–802. [DOI] [PMC free article] [PubMed] [Google Scholar]
- Jagannathan S, Nwosu C, Nicchitta CV. 2011. Analyzing mRNA localization to the endoplasmic reticulum via cell fractionation. Methods Mol Biol 714: 301–321. [DOI] [PMC free article] [PubMed] [Google Scholar]
- Jambor H, Surendranath V, Kalinka AT, Mejstrik P, Saalfeld S, Tomancak P. 2015. Systematic imaging reveals features and changing localization of mRNAs in Drosophila development. eLife 4: e05003. [DOI] [PMC free article] [PubMed] [Google Scholar]
- Jan CH, Williams CC, Weissman JS. 2014. Principles of ER cotranslational translocation revealed by proximity-specific ribosome profiling. Science 346: 1257521. [DOI] [PMC free article] [PubMed] [Google Scholar]
- Jeck WR, Sharpless NE. 2014. Detecting and characterizing circular RNAs. Nat Biotechnol 32: 453–461. [DOI] [PMC free article] [PubMed] [Google Scholar]
- Jeck WR, Sorrentino JA, Wang K, Slevin MK, Burd CE, Liu J, Marzluff WF, Sharpless NE. 2013. Circular RNAs are abundant, conserved, and associated with ALU repeats. RNA 19: 141–157. [DOI] [PMC free article] [PubMed] [Google Scholar]
- Job C, Eberwine J. 2001. Localization and translation of mRNA in dendrites and axons. Nat Rev Neurosci 2: 889–898. [DOI] [PubMed] [Google Scholar]
- Khaladkar M, Buckley PT, Lee MT, Francis C, Eghbal MM, Chuong T, Suresh S, Kuhn B, Eberwine J, Kim J. 2013. Subcellular RNA sequencing reveals broad presence of cytoplasmic intron-sequence retaining transcripts in mouse and rat neurons. PLoS One 8: e76194. [DOI] [PMC free article] [PubMed] [Google Scholar]
- Kopczynski CC, Noordermeer JN, Serano TL, Chen WY, Pendleton JD, Lewis S, Goodman CS, Rubin GM. 1998. A high throughput screen to identify secreted and transmembrane proteins involved in Drosophila embryogenesis. Proc Natl Acad Sci 95: 9973–9978. [DOI] [PMC free article] [PubMed] [Google Scholar]
- Kressler D, Hurt E, Bassler J. 2017. A puzzle of life: crafting ribosomal subunits. Trends Biochem Sci 42: 640–654. [DOI] [PubMed] [Google Scholar]
- Kuriyan J, Eisenberg D. 2007. The origin of protein interactions and allostery in colocalization. Nature 450: 983–990. [DOI] [PubMed] [Google Scholar]
- Lécuyer E, Yoshida H, Parthasarathy N, Alm C, Babak T, Cerovina T, Hughes TR, Tomancak P, Krause HM. 2007. Global analysis of mRNA localization reveals a prominent role in organizing cellular architecture and function. Cell 131: 174–187. [DOI] [PubMed] [Google Scholar]
- Lefebvre FA, Benoit Bouvrette LP, Perras L, Blanchet-Cohen A, Garnier D, Rak J, Lécuyer E. 2016. Comparative transcriptomic analysis of human and Drosophila extracellular vesicles. Sci Rep 6: 27680. [DOI] [PMC free article] [PubMed] [Google Scholar]
- Lefebvre FA, Cody N, Benoit Bouvrette LP, Bergalet J, Wang X, Lécuyer E. 2017. CeFra-seq: systematic mapping of RNA subcellular distribution properties through cell fractionation coupled to deep-sequencing. Methods 126: 138–148. [DOI] [PubMed] [Google Scholar]
- Legnini I, Di Timoteo G, Rossi F, Morlando M, Briganti F, Sthandier O, Fatica A, Santini T, Andronache A, Wade M, et al. 2017. Circ-ZNF609 is a circular RNA that can be translated and functions in myogenesis. Mol Cell 66: 22–37.e29. [DOI] [PMC free article] [PubMed] [Google Scholar]
- Lerner RS, Seiser RM, Zheng T, Lager PJ, Reedy MC, Keene JD, Nicchitta CV. 2003. Partitioning and translation of mRNAs encoding soluble proteins on membrane-bound ribosomes. RNA 9: 1123–1137. [DOI] [PMC free article] [PubMed] [Google Scholar]
- Levy ED, Kowarzyk J, Michnick SW. 2014. High-resolution mapping of protein concentration reveals principles of proteome architecture and adaptation. Cell Rep 7: 1333–1340. [DOI] [PubMed] [Google Scholar]
- Liu Y, Beyer A, Aebersold R. 2016. On the dependency of cellular protein levels on mRNA abundance. Cell 165: 535–550. [DOI] [PubMed] [Google Scholar]
- Marc P, Margeot A, Devaux F, Blugeon C, Corral-Debrinski M, Jacq C. 2002. Genome-wide analysis of mRNAs targeted to yeast mitochondria. EMBO Rep 3: 159–164. [DOI] [PMC free article] [PubMed] [Google Scholar]
- Mardakheh FK, Paul A, Kumper S, Sadok A, Paterson H, McCarthy A, Yuan Y, Marshall CJ. 2015. Global analysis of mRNA, translation, and protein localization: local translation is a key regulator of cell protrusions. Dev Cell 35: 344–357. [DOI] [PMC free article] [PubMed] [Google Scholar]
- Martin KC, Ephrussi A. 2009. mRNA localization: gene expression in the spatial dimension. Cell 136: 719–730. [DOI] [PMC free article] [PubMed] [Google Scholar]
- Mercer TR, Gerhardt DJ, Dinger ME, Crawford J, Trapnell C, Jeddeloh JA, Mattick JS, Rinn JL. 2011. Targeted RNA sequencing reveals the deep complexity of the human transcriptome. Nat Biotechnol 30: 99–104. [DOI] [PMC free article] [PubMed] [Google Scholar]
- Mi H, Huang X, Muruganujan A, Tang H, Mills C, Kang D, Thomas PD. 2017. PANTHER version 11: expanded annotation data from Gene Ontology and Reactome pathways, and data analysis tool enhancements. Nucleic Acids Res 45: D183–D189. [DOI] [PMC free article] [PubMed] [Google Scholar]
- Mili S, Moissoglu K, Macara IG. 2008. Genome-wide screen reveals APC-associated RNAs enriched in cell protrusions. Nature 453: 115–119. [DOI] [PMC free article] [PubMed] [Google Scholar]
- Mingle LA, Okuhama NN, Shi J, Singer RH, Condeelis J, Liu G. 2005. Localization of all seven messenger RNAs for the actin-polymerization nucleator Arp2/3 complex in the protrusions of fibroblasts. J Cell Sci 118: 2425–2433. [DOI] [PMC free article] [PubMed] [Google Scholar]
- Moccia R, Chen D, Lyles V, Kapuya E, E Y, Kalachikov S, Spahn CM, Frank J, Kandel ER, Barad M, et al. 2003. An unbiased cDNA library prepared from isolated Aplysia sensory neuron processes is enriched for cytoskeletal and translational mRNAs. J Neurosci 23: 9409–9417. [DOI] [PMC free article] [PubMed] [Google Scholar]
- Mondal T, Rasmussen M, Pandey GK, Isaksson A, Kanduri C. 2010. Characterization of the RNA content of chromatin. Genome Res 20: 899–907. [DOI] [PMC free article] [PubMed] [Google Scholar]
- Pamudurti NR, Bartok O, Jens M, Ashwal-Fluss R, Stottmeister C, Ruhe L, Hanan M, Wyler E, Perez-Hernandez D, Ramberger E, et al. 2017. Translation of CircRNAs. Mol Cell 66: 9–21.e27. [DOI] [PMC free article] [PubMed] [Google Scholar]
- Poon MM, Choi SH, Jamieson CA, Geschwind DH, Martin KC. 2006. Identification of process-localized mRNAs from cultured rodent hippocampal neurons. J Neurosci 26: 13390–13399. [DOI] [PMC free article] [PubMed] [Google Scholar]
- Prasanth KV, Prasanth SG, Xuan Z, Hearn S, Freier SM, Bennett CF, Zhang MQ, Spector DL. 2005. Regulating gene expression through RNA nuclear retention. Cell 123: 249–263. [DOI] [PubMed] [Google Scholar]
- Pyhtila B, Zheng T, Lager PJ, Keene JD, Reedy MC, Nicchitta CV. 2008. Signal sequence- and translation-independent mRNA localization to the endoplasmic reticulum. RNA 14: 445–453. [DOI] [PMC free article] [PubMed] [Google Scholar]
- Quinlan AR, Hall IM. 2010. BEDTools: a flexible suite of utilities for comparing genomic features. Bioinformatics 26: 841–842. [DOI] [PMC free article] [PubMed] [Google Scholar]
- Ruepp A, Waegele B, Lechner M, Brauner B, Dunger-Kaltenbach I, Fobo G, Frishman G, Montrone C, Mewes HW. 2010. CORUM: the comprehensive resource of mammalian protein complexes–2009. Nucleic Acids Res 38: D497–D501. [DOI] [PMC free article] [PubMed] [Google Scholar]
- Sasaki Y, Gross C, Xing L, Goshima Y, Bassell GJ. 2014. Identification of axon-enriched microRNAs localized to growth cones of cortical neurons. Dev Neurobiol 74: 397–406. [DOI] [PMC free article] [PubMed] [Google Scholar]
- Schwanhäusser B, Busse D, Li N, Dittmar G, Schuchhardt J, Wolf J, Chen W, Selbach M. 2011. Global quantification of mammalian gene expression control. Nature 473: 337–342. [DOI] [PubMed] [Google Scholar]
- Sharp JA, Plant JJ, Ohsumi TK, Borowsky M, Blower MD. 2011. Functional analysis of the microtubule-interacting transcriptome. Mol Biol Cell 22: 4312–4323. [DOI] [PMC free article] [PubMed] [Google Scholar]
- Sultan M, Amstislavskiy V, Risch T, Schuette M, Dökel S, Ralser M, Balzereit D, Lehrach H, Yaspo ML. 2014. Influence of RNA extraction methods and library selection schemes on RNA-seq data. BMC Genomics 15: 675. [DOI] [PMC free article] [PubMed] [Google Scholar]
- Taliaferro JM, Vidaki M, Oliveira R, Olson S, Zhan L, Saxena T, Wang ET, Graveley BR, Gertler FB, Swanson MS, et al. 2016. Distal alternative last exons localize mRNAs to neural projections. Mol Cell 61: 821–833. [DOI] [PMC free article] [PubMed] [Google Scholar]
- Tilgner H, Knowles DG, Johnson R, Davis CA, Chakrabortty S, Djebali S, Curado J, Snyder M, Gingeras TR, Guigo R. 2012. Deep sequencing of subcellular RNA fractions shows splicing to be predominantly co-transcriptional in the human genome but inefficient for lncRNAs. Genome Res 22: 1616–1625. [DOI] [PMC free article] [PubMed] [Google Scholar]
- van Heesch S, van Iterson M, Jacobi J, Boymans S, Essers PB, de Bruijn E, Hao W, MacInnes AW, Cuppen E, Simonis M. 2014. Extensive localization of long noncoding RNAs to the cytosol and mono- and polyribosomal complexes. Genome Biol 15: R6. [DOI] [PMC free article] [PubMed] [Google Scholar]
- Vogel C, Marcotte EM. 2012. Insights into the regulation of protein abundance from proteomic and transcriptomic analyses. Nat Rev Genet 13: 227–232. [DOI] [PMC free article] [PubMed] [Google Scholar]
- Wagner GP, Kin K, Lynch VJ. 2012. Measurement of mRNA abundance using RNA-seq data: RPKM measure is inconsistent among samples. Theory Biosci 131: 281–285. [DOI] [PubMed] [Google Scholar]
- Wang ET, Cody NA, Jog S, Biancolella M, Wang TT, Treacy DJ, Luo S, Schroth GP, Housman DE, Reddy S, et al. 2012. Transcriptome-wide regulation of pre-mRNA splicing and mRNA localization by muscleblind proteins. Cell 150: 710–724. [DOI] [PMC free article] [PubMed] [Google Scholar]
- Wilk R, Hu J, Blotsky D, Krause HM. 2016. Diverse and pervasive subcellular distributions for both coding and long noncoding RNAs. Genes Dev 30: 594–609. [DOI] [PMC free article] [PubMed] [Google Scholar]
- Williams CC, Jan CH, Weissman JS. 2014. Targeting and plasticity of mitochondrial proteins revealed by proximity-specific ribosome profiling. Science 346: 748–751. [DOI] [PMC free article] [PubMed] [Google Scholar]
- Zhang Y, Zhang XO, Chen T, Xiang JF, Yin QF, Xing YH, Zhu S, Yang L, Chen LL. 2013. Circular intronic long noncoding RNAs. Mol Cell 51: 792–806. [DOI] [PubMed] [Google Scholar]
- Zhang XO, Dong R, Zhang Y, Zhang JL, Luo Z, Zhang J, Chen LL, Yang L. 2016. Diverse alternative back-splicing and alternative splicing landscape of circular RNAs. Genome Res 26: 1277–1287. [DOI] [PMC free article] [PubMed] [Google Scholar]
- Zivraj KH, Tung YC, Piper M, Gumy L, Fawcett JW, Yeo GS, Holt CE. 2010. Subcellular profiling reveals distinct and developmentally regulated repertoire of growth cone mRNAs. J Neurosci 30: 15464–15478. [DOI] [PMC free article] [PubMed] [Google Scholar]
Associated Data
This section collects any data citations, data availability statements, or supplementary materials included in this article.