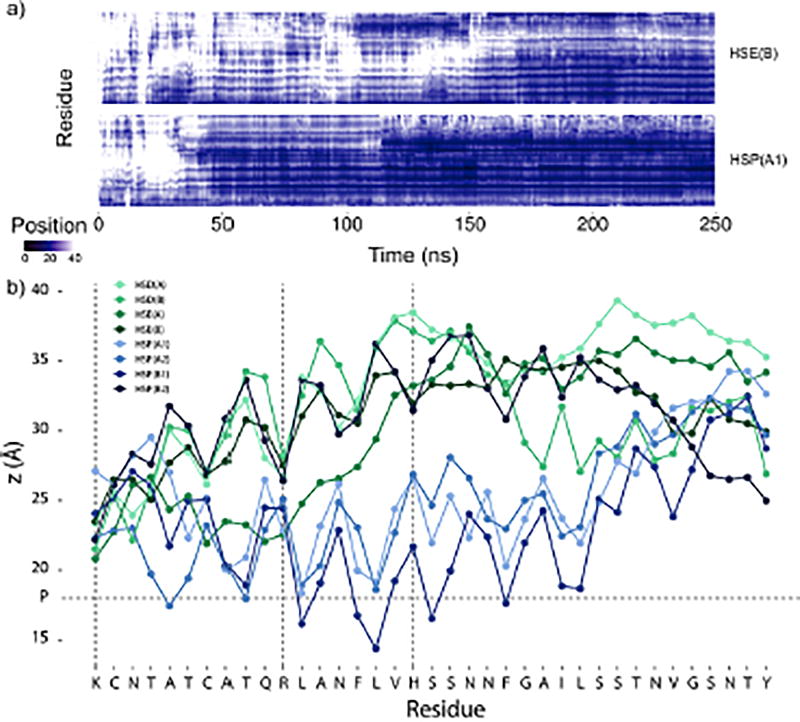
Figure 4.
a) The z-coordinate of the center of mass of each side chain for two hIAPP1–37 simulations, HSE1–37(B) and HSP1–37(A1). Plots for all the simulations can be found in the Supporting Information. The center of the membrane is at z = 0 Å and the average position of the phosphates is at z = 18 Å. Data points with z > 40 Å are the same color as z = 40 Å (white). b) Average z-coordinate of the center of mass of each side chain during the hIAPP1–37 simulations excluding the first 20 ns. The horizontal dashed line represents the average position of the phosphates, and the vertical dashed lines mark the position of the positive residues.

