

Abstract
Immune checkpoint inhibitors have shown significant therapeutic responses against tumors containing increased mutation-associated neoantigen load. We have examined the evolving landscape of tumor neoantigens during the emergence of acquired resistance in non-small cell lung cancer patients after initial response to immune checkpoint blockade with anti-PD1 or anti-PD-1/anti-CTLA4 antibodies. Analyses of matched pretreatment and resistant tumors identified genomic changes resulting in loss of 7 to 18 putative mutation-associated neoantigens in resistant clones. Peptides generated from the eliminated neoantigens elicited clonal T cell expansion in autologous T cell cultures, suggesting that they generated functional immune responses. Neoantigen loss occurred through elimination of tumor subclones or through deletion of chromosomal regions containing truncal alterations and were associated with changes in T cell receptor clonality. These analyses provide insights into the dynamics of mutational landscapes during immune checkpoint blockade and have implications for development of immune therapies that target tumor neoantigens.
Introduction
Tumor cells contain nonsynonymous somatic mutations that alter the amino acid sequences of the proteins encoded by the affected genes (1). Those alterations are foreign to the immune system and may therefore represent tumor-specific neoantigens capable of inducing anti-tumor immune responses (2, 3). Somatic mutational and neoantigen density has recently been shown to correlate with long-term benefit from immune checkpoint blockade in non-small cell lung cancer (NSCLC) (4) and melanoma (5, 6) suggesting that a high density of neoepitopes stemming from somatic mutations may enhance clinical benefit from blockade of immune checkpoints that unleash endogenous responses to these mutation-associated neoantigens (MANAs). Expression of the programmed cell death ligand 1 (PD-L1) in tumors or tumor-infiltrating immune cells has been associated with responses to PD-1 blockade (7–9), however PD-L1 expression or other immune biomarkers have not been sufficient to fully explain therapeutic outcomes (10).
Among the patients that initially respond to PD-1 blockade, some become resistant to the therapy (11). Up-regulation of alternate immune checkpoints (12), loss of HLA haplotypes (13) or somatic mutations in HLA or JAK1/JAK2 genes (14, 15) have been proposed as mechanisms of evasion to immune recognition in some patients, but the mechanisms underlying response and acquired resistance to immune checkpoint blockade have remained elusive. To examine mechanisms of resistance to immunotherapy, we performed genome-wide sequence analysis of protein coding genes and T cell receptor (TCR) clonotype analysis, followed by functional assays of autologous T cell activation of patients that demonstrated initial response to immune checkpoint blockade but ultimately developed progressive disease. These analyses identified immunogenic MANAs that were lost in the resistant tumors either through tumor cell elimination or chromosomal deletions, suggesting novel mechanisms for acquisition of resistance to immune checkpoint blockade.
Results
Of a cohort of 42 NSCLC patients treated with single agent PD-1 or combined PD-1 and CTLA4 blockade, we identified all consecutive cases (n=4) that developed acquired resistance and where paired tumor specimens were available both before and after therapy (Supplementary Figures S1-S4). To examine the landscape of genomic alterations and associated neoantigens, we performed whole exome sequencing of tumors from these patients (Figure 1, Supplementary Tables S1, S2). Pre-treatment and post-progression specimens were obtained from the same anatomic location (CGLU117) or from sites in close anatomic proximity (CGLU116, CGLU127 and CGLU161; Supplementary Figures S1-S3). Clinical and pathological characteristics for all patients are summarized in Supplementary Table S1 and described in detail in the Methods.
Figure 1. Overview of next-generation sequencing, neoantigen prediction and functional T cell analyses.

Whole exome sequencing was performed on the pre-treatment and post-progression tumor and matched normal samples. Exome data were applied in a neoantigen prediction pipeline that evaluates antigen processing, MHC binding and gene expression to generate neoantigens specific to the patient’s HLA haplotype. Truncal neoantigens were identified by correcting for tumor purity and ploidy and the TCR repertoire was evaluated at baseline, at the time of response and upon emergence of resistance. Putative eliminated neoantigens at the time of resistance were used to generate peptides and stimulate autologous T cells, followed by TCR next-generation sequencing.
We used a high-sensitivity mutation detection pipeline (16) to identify 129, 302, 344 and 127 somatic sequence alterations in pre-immunotherapy tumor samples from patients CGLU116, CGLU117, CGLU127 and CGLU161, respectively. The number and type of alterations as well as specific driver genes identified, including TP53, KRAS, MYC, ARID1A, RB1, and SMARCA4 genes, were consistent with previous observations of sequence and copy number changes in NSCLC (17, 18) (Supplementary Tables S3, S4). Post-progression tumor samples revealed a change in the overall somatic sequence alterations, including both gains and losses resulting in 177, 323, 354 and 142 somatic sequence alterations for CGLU116, CGLU117, CGLU127 and CGLU161 respectively (Supplementary Tables S3, S4).
We examined multiple immune-related parameters of peptides stemming from somatic alterations using a computational multi-dimensional neoantigen prediction platform (see Methods). This approach allowed for identification of peptides within mutated genes that were predicted to be processed and presented by major histocompatibility complex (MHC) class I proteins and therefore had the potential to elicit an immune response. The algorithm evaluated the binding of mutant peptides (8–11mers) to patient-specific MHC class I alleles and ranked the neoantigens according to MHC binding affinity, antigen processing, and self-similarity. We also evaluated the average expression of altered genes in TCGA lung cancer specimens as tumor material was limited and did not allow for both genomic and expression analyses. We identified 106, 240, 316 and 102 candidate mutation associated neoantigens (cMANAs) for pre-treatment tumors for CGLU116, CGLU117, CGLU127 and CGLU161, respectively. At the time of resistance to immune checkpoint blockade we identified 144, 250, 326 and 119 cMANAs from tumors of patients CGLU116, CGLU117, CGLU127 and CGLU161 (Supplementary Table S5).
As higher mutational load in resistant tumors was not consistent with the notion that a high mutation burden confers response to immune checkpoint blockade, we investigated whether the gained genomic alterations were enriched for mutations that are not associated with neoantigens. Interestingly, a higher fraction of mutations not encoding for neoantigens was identified among gained compared to eliminated mutations (19% versus 8%), however the small number of observations did not allow for statistical significance. This observation may suggest that the gained mutations were less likely to be related to an anti-tumor immune response. We also evaluated the gained alterations observed in the tumor samples to see if they may provide insight into known potential mechanisms of immunotherapy resistance (12–15, 19). However, there were no new alterations or copy number changes in post-therapy samples in the CD274 gene encoding for PD-L1, PDCD1 encoding for PD-1, CTLA4 or JAK1 or JAK2 genes. Similarly, we did not identify any genomic alterations in HLA genes, beta 2 microglobulin or other antigen presentation associated genes.
We observed that a subset of cMANAs present in the original tumors were eliminated in tumors at the time of resistance to immune checkpoint blockade (Figures 2A-B, 3A-I, and Supplementary Table S6). This included 18, 10, 7, and 6 cMANAs that were not present in tumors at the time of acquired resistance for patients CGLU116, CGLU117, CGLU127 and CGLU161, respectively (Figure 2). All eliminated cMANAs stemmed from single-base substitutions with the exception of neopeptides generated by a frameshift mutation in PCSK4 for CGLU116. Among the neoantigens with predicted MHC binding affinity <50 nM, the eliminated cMANAs had higher predicted MHC binding affinity than either those that were retained or gained in the resistant tumors (14.5 nM for lost neoantigens vs 23.4 nM or 24.7 nM for retained or gained neoantigens, respectively, p<0.05). The mutations in 23 eliminated cMANAs were found in positions thought to be important for TCR binding (20), and are likely to be important for recognition of the mutant peptide especially when the wild type peptide is also presented (21). A quarter of the eliminated cMANAs harbored mutations in either anchor or auxiliary anchor residues, presumably affecting MHC binding of these neoantigens (Supplementary Table S6).
Figure 2. Mutation cellularity analyses for eliminated mutations in pre-treatment and post-progression tumor samples.

Mutation cellularities at baseline (T1) and upon progression (T2) were estimated with the SCHISM pipeline; a cellularity of 0 was observed for 18, 10, 7, and 6 sequence alterations in resistant T2 tumors for CGLU116, CGLU117, CGLU127 and CGLU161, respectively (panel A). These somatic mutations were lost either by loss of heterozygosity or subclonal elimination at the time of emergence of therapeutic resistance to immune checkpoint blockade. Somatic mutations in SLC26A7, PGAP1, HELB and ANKRD12 that are associated with functionally validated neoantigens were detected in the pre-treatment tumors but not in the resistant tumor or matched normal DNA; MAF denotes the mutant allele frequency (panel B).
Figure 3. Emergence of resistance to immune checkpoint blockade is associated with elimination of mutation associated neoantigens by loss of heterozygosity and a more diverse T-cell repertoire independent of PD-L1 expression.
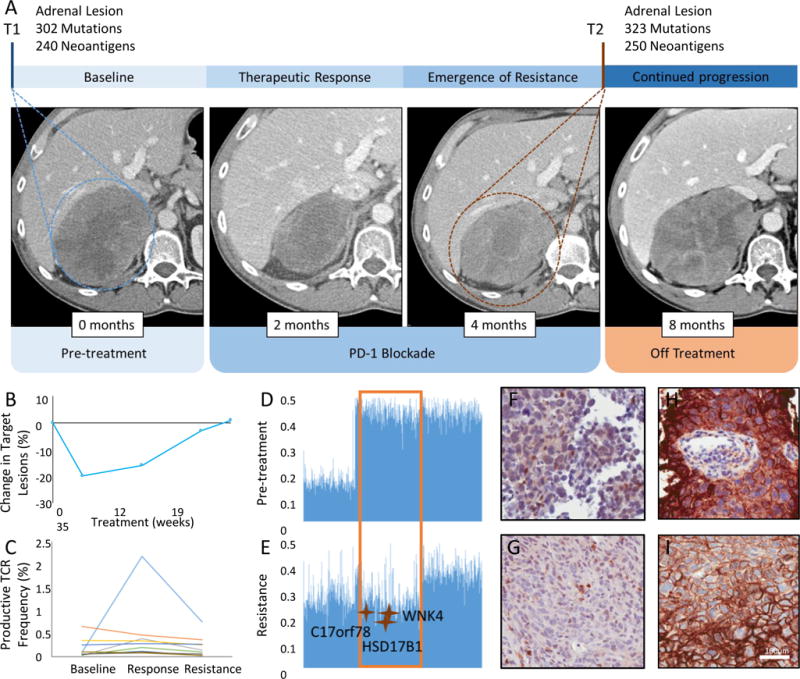
Panel A shows computed tomographic (CT) images of patient CGLU117 at baseline, at the time of therapeutic response and at time of acquired resistance. Pre-treatment CT image of the abdomen, demonstrates a right adrenal mass (T1, circled), radiologic tumor regression is noted after 2 months of treatment, followed by disease relapse at 4 months from treatment initiation with a markedly increased right adrenal metastasis (T2, circled). 3rd follow up CT demonstrates further disease progression in the adrenal lesion. Tumor burden kinetics for target lesions by RECIST criteria are shown in panel B. Peripheral T cell expansion of a subset of intratumoral clones was noted to peak at the time of response and decrease to baseline levels at the time of resistance (panel C). Productive TCR frequency denotes the frequency of a specific rearrangement that can produce a functional protein receptor among all productive rearrangements. Panels D and E show B allele frequency graphs for chromosome 17, a value of 0.5 indicates a heterozygous genotype whereas allelic imbalance is observed as a deviation from 0.5. The region that undergoes LOH in the resistant tumor (panel E, orange box) contains 3 mutation associated neoantigens that are thus eliminated. No differences in CD8+ T cell density (panel F, G) or PD-L1 expression (panel H, I) were observed between baseline and resistant tumors.
While algorithm-based predictions of antigenicity are valuable in narrowing down the large number of peptides capable of being generated by a mutation to a set of potential antigenic peptides presented by self-MHC alleles, functional T cell recognition is critical to evaluate immune responsiveness. To this end, we developed a sensitive approach for assessing T cell response to cMANAs that utilized next-generation sequencing of TCR-Vb CDR3 regions as a measure of T cell clonality. In this approach, TCR-Vb clonality is compared pre-stimulation to post-stimulation in vitro with cMANA peptides. In addition to being more sensitive than the conventional enzyme linked immunospot assay, this technique allowed us to match cMANA expanded TCR-Vb CDR3s with those found in the patients’ tumors themselves, identified by TCR-Vb CDR3 deep sequencing from the same DNA used for mutational analysis. Thus, this approach evaluates MANA-specific responses by T cells known to be present within the tumor microenvironment.
To evaluate T cell recognition of eliminated neoantigens, purified peripheral blood T cells from patients CGLU116, CGLU127 and CGLU161 were stimulated with autologous peripheral blood mononuclear cells (PBMCs) loaded with cMANA peptides in a 10-day culture system. We subsequently used TCR next generation sequencing to assess the differential abundance of neoantigen-specific T cell clonotypes in these expanded T cell populations. In order to further investigate the importance of eliminated cMANAs, we generated peptides from retained and gained cMANAs and assessed their potential to elicit a MANA-specific T cell expansion in samples where additional PBMCs were available (Figure 4A-D, Supplementary Table S7).
Figure 4. Neoantigen-specific TCR expansion in stimulated T cell cultures.

Peptides generated from the eliminated mutation associated neoantigen candidates were synthesized and used to pulse autologous peripheral T cells for patient CGLU116. T cells were stimulated with respective mutant and wild type peptides and cultured for 10 days, followed by next generation TCR sequencing of expanded T cell cultures. Reactive TCR clonotypes were matched to clones found in infiltrating tumor lymphocytes. Neoantigen-specific TCR reactivity was observed for the mutant peptides associated with mutant HELB987P>S (SASPLSVV; panel A), SCL26A7117R>Q (ISANAVEQIV; panel B) and PGAP1903Y>F (AFGSAHLFR and VIAFGSAHLFR; panel C) compared to their wild type counterparts. An oligoclonal TCR expansion was observed for both mutant (STPSASPLSV) and wild type (STPSASPLPVV) peptides associated with a single base substitution in HELB (panel D). Adjusted p values are given for pairwise comparisons between productive frequencies in peptide stimulated versus unstimulated T cells. Solid bars represent mutant and bars with diagonal pattern denote wild type peptides.
For patient CGLU116, all eliminated cMANA peptides tested induced a clonal T cell expansion. Peptides encoding for mutations in PGPA1903Y>F and SLC26A7117R>Q elicited a neoantigen-specific clonal T cell expansion with no reactivity observed against the wild-type peptides (Figure 4B-C, Supplementary Table S8). T cell reactivity was observed in response to multiple peptides encoding for the HELB987P>S mutation as well as one wild type peptide, with the mutant peptide resulting in stronger immune responses (Figure 4A and D, Supplementary Table S8). For patient CGLU127, we observed T cell reactivity specific to both mutant and wild type peptides of ANKRD12603K>T although the wild type peptide had a significantly lower predicted MHC binding affinity which might not allow significant presentation of naturally processed peptide by the tumor MHC in vivo (Supplementary Figure S5, Supplementary Table S8). For patient CGLU161, we observed T cell reactivity specific to mutant peptide of EP3001250C>Y (Supplementary Figure S6, Supplementary Table S8). In contrast, none of the seven retained cMANA peptides for CGLU127 and CGLU161 were found to be immunogenic by our assay, while for case CGLU116 a subset of retained cMANA peptides elicited a MANA-specific clonal T cell expansion (Supplementary Table S9). For gained cMANAs, we were only able to evaluate case CGLU116 as this was the only one for which additional PBMCs were available. These analyses identified a small fraction of gained cMANA peptides (30% of peptides tested) that elicited a MANA-specific clonal T cell expansion in autologous T cell cultures from this patient (Supplementary Table S9). These findings indicate that patient-derived T cells recognized the eliminated neoantigens and suggest that these neoantigens were relevant targets for the achievement of initial therapeutic response to checkpoint blockade.
Conceptually, there could be two mechanisms of neoantigen loss in resistant tumors. The first is through the immune elimination of neoantigen-containing tumor cells that represent a subset of the tumor cell population, followed by subsequent outgrowth of the remaining cells. The second is through the acquisition of one or more genetic events in a tumor cell that results in neoantigen loss, followed by selection and expansion of the resistant clone. The first mechanism would only be possible for subclonal neoantigens while the second could serve as a mechanism of resistance for both clonal and subclonal alterations. To evaluate the contribution of these mechanisms to the loss of neoantigens, we analyzed the tumors both before and after therapy using the SCHISM pipeline (22), and incorporated mutation frequency, tumor purity, and copy number variation to infer the fraction of cells containing a specific mutation (mutation cellularity) (see Methods, Supplementary Tables S10-S13). Through these approaches we estimated that alterations with a mutation cellularity >0.75 were present in all tumor cells (truncal) while the remainder were considered to be subclonal. Consistent with our predictions, we observed both mechanisms of neoantigen elimination: loss of 3 truncal changes and elimination of 38 subclonal cMANAs at the time of emergence of resistance (Supplementary Tables S10-S14). Analysis of genome-wide structural alterations revealed that all clonal neoantigens were lost through genetic events involving chromosomal deletions and loss of heterozygosity (LOH) (Figure 3, Supplementary Figures S7-S10, Supplementary Tables S10-S14). Subclonal neoantigens were lost either by LOH or through elimination of tumor subclones. Both truncal and subclonal changes were among the eliminated neoantigens that were functionally validated (Supplementary Table S8).
To evaluate the impact of changes in neoantigen landscape on cytotoxic T cell receptor repertoire, we analyzed serially collected PBMCs, prior to immunotherapy initiation, at clinical response, and at resistance for patients CGLU117 and CGLU127 and at response and disease progression for patient CGLU161 (Supplementary Table S15). We hypothesized that loss of neoantigens would lead to a decrease in clonality of cytotoxic TCR clonotypes, thus reflecting tumor immune evasion at the time of emergence of resistance. For patients CGLU127 and CGLU117, we observed peripheral T cell expansion of a subset of the top 100 most frequent intratumoral clones, with the most frequent clones reaching a 44- and 25-fold increase in abundance in the blood at the time of response, respectively, followed by a decrease to pretreatment levels at the time of resistance (Figure 3C and Supplementary Figure S11). For patient CGLU117, this observation was consistent with the fact that CD8+ immune density did not change significantly in pre-treatment and resistant tumors (Figure 3F-G, Supplementary Table S16). Importantly, for patient CGLU127, the TCR clonotype specific to the functionally validated eliminated neoantigen encoding the 603K>T alteration in ANKRD12 was among the top 20 circulating TCR clones, demonstrating a similar clonal expansion at the time of response and reduction at the time of emergence of resistance. Similarly, for patient CGLU161, the TCR clone that expanded after stimulation with the EP3001250C>Y MANA was one of the top 3 clonotypes observed in peripheral blood at the time of response and its frequency decreased upon emergence of resistance (Supplementary Figure S11). For this case, a decrease in abundance was also observed for the predominant peripheral TCR clonotypes that were also present in the tumor at the time of resistance (Supplementary Figure S11). As a comparison, such decreases in TCR frequencies were not observed in a NSCLC patient with durable response to PD-1 blockade and no change in intratumoral TCR frequencies was seen in a NSCLC patient with primary resistance to PD-1 blockade (Supplementary Figure S12). Taken together, these observations suggest that TCR expansion may be both a useful measure of response to checkpoint blockade as well as an indicator of acquired therapeutic resistance through neoantigen loss.
Discussion
Despite the compelling and increased durability of clinical efficacy of immune checkpoint inhibitors relative to chemotherapy or oncogene-targeted therapy, the majority of patients eventually experience therapeutic resistance after an initial response to these therapies. Through our comprehensive genomic analyses, we have identified changes in the genomic landscape of tumors during immune checkpoint blockade. These analyses show that emergence of acquired resistance is associated with loss of mutations encoding for putative tumor-specific neoantigens, both through elimination of tumor subclones or chromosomal loss of truncal alterations. Using a new approach to assess neoantigen reactivity by T cells, we found that some of these eliminated mutations encoded peptides recognized by T cells in the peripheral circulation of the respective patients. Given that the anti-tumor efficacy of checkpoint blockade likely involves release of endogenous T cell responses to tumor antigens generated by coding mutations, our findings are consistent with a mechanism of acquired resistance to immune checkpoint blockade that involves therapy-induced immune editing of MANAs.
Acquisition of somatic resistance mutations is a common mechanism of therapeutic resistance to targeted therapies (23). However, elimination of genomic alterations and more specifically loss of somatic mutations through subsequent genetic events is uncommon in the context of natural tumor evolution or therapeutic resistance (24–26). Elimination of mutation associated antigens by a T-cell-dependent immunoselection process has been proposed as a mechanism of cancer immunoediting in mouse models (27) and melanoma after adoptive T cell transfer (28), but the evolution of neoantigen loss as an escape mechanism under the selective pressure of immune checkpoint blockade in lung cancer has not been previously studied. We found that in tumor samples analyzed at the time of acquired resistance the majority of eliminated mutations were in genes typically expressed at high levels in lung cancer and encoded for neoantigens that were predicted to either confer high affinity MHC binding or affect TCR contact residues. Eliminated neoantigens elicited a specific T cell expansion and it is conceivable that the identified neoantigens eliminated at the time of emergence of resistance were immunodominant (29). In the setting of viral infections, it is common that the immune system focuses on a limited number of dominant viral epitopes and loss of these epitopes is a common mechanism of viral persistence and immune evasion. The determination of the overall role of loss of dominant tumor MANAs in acquired resistance to immunotherapy with checkpoint blockade will require extensive evaluation of MANA-specific immune responses in larger numbers of patients at varying times during response and relapse.
For these patients, we examined a variety of other mechanisms that have been proposed in the development of resistance to immunotherapies (30). We did not observe any differences in PD-L1 expression in tumor cells between responsive and resistant tumor samples although our interpretation was limited by the scant material available for immunohistochemistry (Supplementary Figure S13, Supplementary Table S16) (9, 10). Likewise, we did not observe any loss-of-function mutations or LOH in genes related to other reported mechanisms of resistance, including HLA genes (13), β2-microglobulin (15), PTEN (19), JAK1 and JAK2 (15) or the transporter for antigen presentation (TAP-1) gene in the resistance tumor specimens. Although we were precluded from evaluating other immune modulators due to limited biopsy specimens, it is conceivable that transcriptomic signatures (31) or specific co-inhibitory factors, such as LAG-3 or T-cell immunoglobulin mucin-3 (TIM-3) (12), may play a role in immune checkpoint regulation.
Our study has several limitations including its small sample size and analysis of samples from a defined period of relatively early acquired therapeutic resistance. Although many patients have longer clinical courses after initial response to checkpoint blockade, a range of duration in clinical benefit has been described in clinical trials including early acquired resistance (11). In particular, the patients described herein represent a relatively faster group of acquired resistance relative to the median 17 months median response duration with PD-1 blockade in metastatic lung cancer (32). To further evaluate this issue in a tumor type with similar genomic background to NSCLC (33), we performed a neoantigen landscape analysis in pre-treatment and post-progression samples of a patient with head and neck squamous cell carcinoma (HNSCC) treated with immune checkpoint blockade. This patient had a deeper response (91% reduction in tumor burden) lasting 12 months followed by emergence of acquired resistance. In this case, although our approach was limited by the low tumor purity of the pre-treatment sample, we found that two cMANAs in the pre-treatment tumor were eliminated in the post-progression tumor. Of these, HSPA12B54P>R was eliminated by an LOH event involving chromosome 20 (Supplementary Figure S14). These findings provide evidence that the mechanism of acquired resistance may be shared among patients of different tumor types with responses of variable duration. Another potential limitation is the possibility of tumor heterogeneity confounding our observations of eliminated neoantigens. However, we observed a high concordance of detected genomic alterations among three different samples from the baseline tumor for patient CGLU116 where sufficient material was available for this analysis. Ninety-four percent of sequence alterations were identified in at least two of three samples analyzed demonstrating that at the sequence level the amount of intra-tumor mutational heterogeneity was minimal.
While larger studies will be required to study the full spectrum of therapeutic resistance to immunotherapy, our findings provide insights into the relatively rapid dynamics of neoantigen gains and losses during therapy and reveal a potential mechanism of resistance for at least a fraction of these patients. One future area of investigation for patients with metastatic disease will be a comprehensive analysis of the evolving neoantigen landscape among different metastatic lesions in the same patient under selective pressure of immune checkpoint blockade.
Unravelling the genomic mechanisms through which cancer adapts to evade anti-tumor immune responses will be critical for the future development of tailored cancer immunotherapy strategies. Putative neoantigens identified prior to and at the time of emergence of resistance might be used to develop patient-specific immunotherapy approaches including vaccines and adoptive T-cell transfer with TCR-engineered T cells. Although clonal neoantigens have recently been reported to drive anti-tumor responses to checkpoint inhibitors (34), our analyses suggest that underlying immune responses target both truncal and subclonal neoantigens and that the combination should be considered for development of personalized immunotherapies. They also suggest that tumors are quite capable of eliminating both truncal and subclonal mutations in the acquisition of resistance, highlighting the challenges in defining which mutations should be chosen to construct personalized immunotherapies that would provide maximal durability of response.
Methods
Patient and Sample Characteristics
Our study group consisted of 4 NSCLC patients treated with immune checkpoint blockade at Johns Hopkins Sidney Kimmel Cancer Center. Two patients (CGLU117 and CGLU127) were treated with single agent nivolumab between December 2014 and October 2015 and 2 patients (CGLU116 and CGLU161) were treated with nivolumab and ipilimumab between July 2014 and October 2015. We performed neoantigen landscape analysis in an additional case of a patient with HNSCC treated with combined PD-1 and KIR blockade. The studies were conducted in accordance with the Declaration of Helsinki, were approved by the Institutional Review Board (IRB) and patients provided written informed consent for sample acquisition for research purposes. Clinical and pathological characteristics for all patients are summarized in Supplementary Table S1 and tumor burden kinetics are shown in Figure 3 and in Supplementary Figure S4.
Patient CGLU116 was a 55-year-old male, 40 pack-year ex-smoker, initially diagnosed with stage IIB squamous lung cancer, treated with left pneumonectomy followed by adjuvant cisplatin, vinorelbine and bevacizumab. Upon disease recurrence he was enrolled on a clinical trial of concurrent anti-PD-1 and anti-CTLA4 therapy and achieved a partial response as defined by RECIST 1.1 criteria after one dose of combined treatment (Supplementary Figure S1). Due to treatment-related toxicities and sustained response, he did not receive further anticancer therapy and developed progressive disease with left pleural implants 11 months later. Patient CGLU117 was a 55-year-old male, 80 pack-year current smoker, diagnosed with stage IIIA EGFR/KRAS/ALK wild-type lung adenocarcinoma. Following progression in a solitary site (right adrenal metastasis) immediately after definitive chemo-radiation with cisplatin and etoposide, and continued progression on 1st line chemotherapy with carboplatin, pemetrexed and bevacizumab, he received anti-PD-1 therapy. He achieved stable disease (22% tumor regression by RECIST 1.1) of 4 months’ duration before he developed disease progression within the enlarging right adrenal metastasis (Figure 2). Patient CGLU127 was a 58-year-old female, 40 pack-year ex-smoker diagnosed with stage IV KRAS mutant (13G>C) lung adenocarcinoma, initially treated with carboplatin, paclitaxel and cetuximab, followed by second line pemetrexed. Upon disease progression she commenced anti-PD1 therapy and achieved a partial response for 6 months but subsequently relapsed with increased hilar lymphadenopathy (Supplementary Figure S2). CGLU161 was a 42-year-old male, 5 pack-year distant ex-smoker, with history of mantle field radiation to the chest for Hodgkin Lymphoma at age 19, diagnosed with stage IV lung adenocarcinoma with liver metastasis. His tumor was wild type for EGFR, ALK and KRAS and he was enrolled in a 1st line clinical trial of combined PD-1 and CTLA4 blockade. He achieved a partial response of 7 months’ duration before disease progression at the site of the primary tumor, followed by with brain metastasis and diffuse tumor infiltration of the liver parenchyma 4 months later (Supplementary Figure S3). Patient CGHN2 was a 54-year-old male, former smoker, diagnosed with HPV negative laryngeal cancer, initially treated with surgical resection followed by first line cisplatin, docetaxel and bevacizumab and second line cetuximab. Upon disease progression, he received PD-1 and KIR blockade prior to developing acquired resistance 12 months later with abdominal and pelvic metastases. Patients underwent tumor biopsies within 30 days prior to starting treatment and at the time of progression, with the exception of CGLU116 and CGHN2 for which archival specimens from the time of the patient’s pneumonectomy and laryngectomy were analyzed respectively as the baseline tumor sample. All tumor samples were provided as formalin fixed paraffin embedded blocks (FFPE). Seven pre-treatment and seven post-progression specimens and their matched normal tissues were obtained and analyzed with IRB approval and patients’ consents.
For patient CGLU116 we analyzed the lung tumor from the time of diagnosis and an enlarging pleural nodule at the time of progression. To assess tumor heterogeneity of case CGLU116 where adequate baseline tumor was available, we analyzed two additional tumor samples originating from different fragments of the left lower lobe tumor. For patient CGLU117 a solitary adrenal metastasis present prior to initiation of PD-1 blockade was analyzed and compared to the same, post-progression enlarging adrenal mass. For patient CGLU127 we studied the lung tumor prior to treatment and a tumor-infiltrated hilar lymph node at the time of progression. For patient CGLU161 a mediastinal lymph node obtained prior to immunotherapy was analyzed and compared to tumor from the site of the primary right upper lobe mass, which regressed with therapy but eventually progressed at the time of therapeutic resistance. For patient CGHN2 a laryngeal mass was analyzed as the baseline specimen and compared to a pelvic metastasis at the time of resistance.
Serial blood samples were collected to assess immune responses: for patients CGLU117 and CGLU127, samples were obtained prior to treatment initiation, at the time of response to anti PD-1 therapy and at the time of disease progression. For patient CGLU161 blood was collected at the time of response to combined PD-1 and CTLA4 blockade and at the time of disease progression. Blood samples from the time of disease progression were available for patient CGLU116. Tumor and serial peripheral blood samples from 2 additional NSCLC patients, one with ongoing response (CGLU111) and the other with primary resistance (CGLU115) to PD-1 blockade were also analyzed to provide a comparator group for the TCR clonotype trends identified in the four patients with acquired resistance.
Treatment and assessment of clinical response
CGLU117 and CGLU127 received single agent nivolumab at 3mg/kg every 2 weeks. CGLU116 and CGLU161 received nivolumab 1mg/kg every 2 weeks and ipilimumab 1mg/kg every 6 weeks. Tumor responses to immune checkpoint blockade were evaluated every 8 weeks after treatment initiation. The response evaluation criteria in solid tumors (RECIST) version 1.1 were used to determine clinical responses. Based on RECIST criteria patients CGLU116, CGLU127, CGLU161 had a partial response as best response and patient CGLU117 had stable disease (22% tumor regression). Patient CGLU116 achieved a deep partial response after one dose of nivolumab and ipilimumab however was not able to receive further treatment because of treatment-related toxicity. Computed tomographic findings and tumor burden kinetics are shown in Figure 3 and Supplementary Figures S1-S4. Patient CGHN2 received PD-1 and KIR blockade achieving a partial response with a 91% reduction in tumor burden lasting a year.
Whole-exome sequencing, neoantigen prediction and T cell receptor sequencing
Whole exome sequencing was performed on the pre-treatment and post-progression tumor and matched normal samples. Tumor samples underwent pathological review for confirmation of lung cancer diagnosis and assessment of tumor purity. Slides from each FFPE block were macrodissected to remove contaminating normal tissue. Matched normal samples were provided as peripheral blood. DNA was extracted from patients’ tumors and matched peripheral blood using the Qiagen DNA FFPE and Qiagen DNA blood mini kit respectively (Qiagen, CA). Fragmented genomic DNA from tumor and normal samples was used for Illumina TruSeq library construction (Illumina, San Diego, CA) and exonic regions were captured in solution using the Agilent SureSelect v.4 kit (Agilent, Santa Clara, CA) according to the manufacturers’ instructions as previously described (16, 23, 35). Paired-end sequencing, resulting in 100 bases from each end of the fragments for the exome libraries was performed using Illumina HiSeq 2000/2500 instrumentation (Illumina, San Diego, CA). The mean depth of coverage for the pre-treatment and resistant tumors was 214x and 217x respectively, allowing us to identify sequence alterations and copy number changes in >20,000 genes (Supplementary Table S2).
Primary processing of next-generation sequencing data and identification of putative somatic mutations
Somatic mutations were identified using the VariantDx custom software for identifying mutations in matched tumor and normal samples (16). Prior to mutation calling, primary processing of sequence data for both tumor and normal samples were performed using Illumina CASAVA software (version 1.8), including masking of adapter sequences. Sequence reads were aligned against the human reference genome (version hg19) using ELAND with additional realignment of select regions using the Needleman-Wunsch method (36). Candidate somatic mutations, consisting of point mutations, insertions, deletions as well as copy number changes were then identified using VariantDx across the whole exome. VariantDx examines sequence alignments of tumor samples against a matched normal while applying filters to exclude alignment and sequencing artifacts. In brief, an alignment filter was applied to exclude quality failed reads, unpaired reads, and poorly mapped reads in the tumor. A base quality filter was applied to limit inclusion of bases with reported Phred quality score > 30 for the tumor and > 20 for the normal. A mutation in the pre or post treatment tumor samples was identified as a candidate somatic mutation only when (1) distinct paired reads contained the mutation in the tumor; (2) the fraction of distinct paired reads containing a particular mutation in the tumor was at least 10% of the total distinct read pairs and (3) the mismatched base was not present in >1% of the reads in the matched normal sample as well as not present in a custom database of common germline variants derived from dbSNP and (4) the position was covered in both the tumor and normal. Mutations arising from misplaced genome alignments, including paralogous sequences, were identified and excluded by searching the reference genome. To validate our mutation detection approach, we investigated whether the gained and lost genomic alterations derived from single base substitutions were also detected by the MuTect method (37). We found that 98% of the eliminated and 99% of the gained genomic alterations identified by our pipeline were also detected by MuTect, providing independent confirmation of our methodology. To ensure that the mutations that were absent in individual tumor specimens were not simply due to low coverage, we required that each mutated base be sequenced at a level that was at least 20% of the average sequence coverage of that sample. Alterations in cases where both tumor samples had tumor purity <50% (CGLU116) were analyzed with the above criteria except that the minimum fraction of distinct reads was 5% as adjusting the mutant allele fraction cut-off from 10% to 5% allowed for high sensitivity mutation detection in the 30–50% tumor purity range. To address the possibility of tumor heterogeneity in case CGLU161, where the pre-treatment tumor sample was obtained from a lymph node metastasis and not the primary tumor, we analyzed available additional lesions from the liver and brain after initiation of therapy and only considered the high concordance mutations that were present the baseline biopsy and either one of the additional lesions.
Candidate somatic mutations were further filtered based on gene annotation to identify those occurring in protein coding regions. Functional consequences were predicted using snpEff and a custom database of CCDS, RefSeq and Ensembl annotations using the latest transcript versions available on hg19 from UCSC (38). Predictions were ordered to prefer transcripts with canonical start and stop codons and CCDS or RefSeq transcripts over Ensembl when available. Finally, mutations were filtered to exclude intronic and silent changes, while retaining mutations resulting in missense mutations, nonsense mutations, frameshifts, or splice site alterations. A manual visual inspection step was used to further remove artefactual changes. An analysis of each candidate mutated region either gained or lost in post-progression specimens was performed using the BLAST like alignment tool (BLAT) to remove repeated regions in the genome as these may confound mutation analyses (39). For each mutation, 101 bases including 50 bases 5′ and 3′ flanking the mutated base was used as query sequence. Candidate mutations were removed from further analysis, if the analyzed region resulted in >1 BLAT hits with 90% identity over 90 SPAN sequence length.
Given the high polymorphism of the HLA loci which can prevent appropriate alignment of sequencing reads to the reference genome, we performed a separate bioinformatic analysis using POLYSOLVER to independently detect somatic Class I HLA mutations (14). These analyses confirmed that there were no somatic HLA mutations as originally determined by our whole exome sequencing analysis pipeline.
Neoantigen Predictions
To assess the immunogenicity of somatic mutations, exome data combined with each individual patient’s MHC class I haplotype were applied in a neoantigen prediction platform that evaluates binding of somatic peptides to class I MHC, antigen processing, self-similarity and gene expression. Detected somatic mutations, consisting of nonsynonymous single base substitutions, insertions and deletions, were evaluated for putative neoantigens using the Immuno Select-R pipeline (Personal Genome Diagnostics, Baltimore, MD). For single base substitutions, Immuno Select-R performs a comprehensive assessment of paired somatic and wild type peptides 8–11 amino acids in length at every position surrounding a somatic mutation. In the case of frameshifts, all peptides 8–11 amino acids encompassing the new protein sequence resulting from the frameshift alteration were considered. To accurately infer a patient’s germline HLA 4-digit allele genotype, whole-exome-sequencing data from paired tumor/normal samples were first aligned to a reference allele set, which was then formulated as an integer linear programming optimization procedure to generate a final genotype (40). The HLA genotype served as input to netMHCpan to predict the MHC class I binding potential of each somatic and wild-type peptide (IC50 nM), with each peptide classified as a strong binder (SB), weak binder (WB) or non-binder (NB) (41–43). Peptides were further evaluated for antigen processing by netCTLpan (44) and were classified as cytotoxic T lymphocyte epitopes (E) or non-epitopes (NA). Paired somatic and wild-type peptides were assessed for self-similarity based on MHC class I binding affinity (45). Neoantigen candidates meeting an IC50 affinity < 5000nM were subsequently ranked based on MHC binding and T-cell epitope classifications. Tumor-associated expression levels derived from TCGA were used to generate a final ranking of candidate immunogenic peptides. Anchor and auxiliary anchor residues for mutant peptides-HLA class I allele pairs were evaluated by the SYFPEITHI online tool (46). To generate Supplementary Table S6 we filtered the neoantigen predictions by applying a 500nM MHC affinity threshold and reduced the redundancy by selecting the strongest binding neoepitope specific to an HLA allele with known binding motifs in SYFPEITHI.
Somatic copy number analysis
Genome-wide copy number profile of each tumor sample was derived by comparing the abundance of aligned reads to each region between tumor and matched normal samples using the CNVkit method (47). CNVkit enables inference and visualization of copy number aberrations from sequencing data. The method uses sequencing reads mapped to the exome, as well as non-specifically captured reads, and corrects the sequencing depth profile with respect to three sources of bias: GC-content, capture target size, and regions containing sequence repeats. We derived a preliminary estimate of genome-wide copy number profile of each tumor sample as quantified by log2 ratio of reads between tumor and matched normal. Next we estimated the tumor purity by cross-analysis of these log2 ratio values and minor allele frequency of germline heterozygous variants. The estimated tumor purity (p) was used to convert the observed raw log2 ratio (r) to tumor copy number ( ), correcting for contribution of normal cell copy number ( ) as follows:
The corresponding tumor copy number values were rounded to closest integer levels to yield the final somatic copy number profile.
Tumor purity estimation
Normal cell contamination is one of the factors complicating the analysis of somatic alterations in solid tumors (48). To estimate the purity of each tumor sample, we extended the framework of SCHISM 1.1.1 (22) to cross-analyze the preliminary somatic copy number profile, and the minor allele frequency distribution of germline heterozygous single nucleotide polymorphisms (SNPs) along the genome. In each tumor sample, we selected a candidate subset of chromosomes or chromosome arms where there was a clear deviation of the minor allele frequencies from the expected value of 0.5, and log2 ratio of read counts indicated one copy loss by visual inspection (Supplementary Table S17). The expected minor allele frequency of germline heterozygous SNPs was calculated as
where p is the proportion of cancer cells in the sequenced tumor bulk (tumor purity), and and are the number of copies of minor allele present in tumor and normal cells, respectively. In regions of one copy loss, the minor allele is absent in tumor cells ( ) and present in one copy in normal cells ( ), tumor copy number is one ( ) and normal copy number is two ( , therefore:
We identified the mode of minor allele frequency in each such region and estimated the tumor purity as the average purity values estimated for the analyzed regions. To validate the accuracy of our method to estimate tumor purity we compared tumor purity estimates derived by SCHISM to four methods of estimating purity: 1) Pathology review, 2) Mutation allele frequency, 3) PyLOH (49) and 4) Sequenza (50) (Supplementary Table S18). Comparison of tumor purity estimates indicated a relatively high level correlation (r >= 0.78) with statistical significance (p < 0.05) across all pairs of methods (Supplementary Figure S15). On average, results from PyLOH had the largest difference (as measured by root mean squared error) with those of other methods, and the smallest dynamic range. Of the three copy number based methods, our method had the smallest root mean squared error when compared to the mutation-based approach.
Genome-wide analysis of allelic imbalance
In each tumor sample, we examined evidence for allelic imbalance in genomic regions surrounding somatic mutations. For each mutation, we compared the minor allele frequency of 20 closest germline heterozygous SNPs with coverage of at least 10 reads between tumor and matched normal sample using a 1-sided t-test. The p-values were corrected for multiple hypothesis testing using Benjamini-Hochberg (51) procedure. Regions with false discovery rate (FDR) less than or equal to 0.05 and a difference of at least 0.10 between the average minor allele frequencies of tumor and normal were marked as harboring allelic imbalance.
Somatic mutation cellularity estimation
Estimating the fraction of cancer cells harboring each somatic mutation (mutation cellularity) is central to reconstruction of subclone hierarchies and tumor evolution. We used an extension of the framework in SCHISM-1.1.1 (22) to derive point estimates and confidence intervals of mutation cellularities as follows: For each mutation, the expected value of variant allele frequency was determined by tumor sample purity p, tumor copy number , normal copy number , mutation cellularity C and mutation multiplicity m. Mutation multiplicity refers the number of mutant alleles present in tumor cells harboring the mutation. The expected variant allele frequency was calculated as:
For each mutation, we derived a cellularity estimate at each possible multiplicity values (in absence of allele specific tumor copy number, ) as follows. Given a multiplicity value m, we found the expected variant allele frequency for each value of cellularity in . Next, we found the binomial likelihood of observing variant reads out of total reads covering the mutation where success probability is set to . We normalized these likelihood values to sum to one, and derived the maximum likelihood estimate of cellularity and the 95% confidence interval using this normalized likelihood distribution over .
We selected the level of multiplicity for each mutation in each sample as follows: The multiplicity for mutations with tumor copy number of 1 is 1. Mutations with tumor copy number of 2 and outside regions with allelic imbalance are assumed to have multiplicity of 1. Mutations with tumor copy number of 2, and in regions with allelic imbalance are assumed to have multiplicity of 2. For mutations that are lost where allelic imbalance was absent in pre-treatment sample and was present in post-treatment sample, multiplicity is assumed to be 1. Mutations absent in pre-treatment sample and in regions with constant tumor copy number between pre- and post- treatment samples have multiplicity of 1. Finally, for mutations lost where tumor copy number changes from 3 in pre-treatment to 2 in post-treatment sample, and allelic imbalance only present in pre-treatment sample, multiplicity is assigned to 1. For mutations where multiplicity (and cellularity) could not be determined using the above approach, we used a secondary method. This involves clustering above mutations to identify groups of mutations with similar cellularity across all available samples. For each unclassified mutation, the unresolved cellularity (and multiplicity) values are selected to minimize the distance to the closest mutation cluster. A cellularity > 0.75 was used to differentiate truncal from subclonal mutations.
Stimulation and expansion of MANA-reactive T cells
Functional assays of peptide stimulated T cell expansion were performed for cases CGLU116, CGLU127 and CGLU161. On day 0, T cells were isolated from PBMC by negative selection (EasySep; STEMCELL Technologies). The T cell-negative fraction was gamma irradiated (3,000 rads) and co-cultured with an equal number of negatively-selected T cells in culture media (AIM V with 50μg/ml gentamicin) with 1μg/ml relevant peptide (Sigma-Aldrich, St. Louis, MO) and supplemented with IL-7 (25 ng/ml; Miltenyi, Auburn, CA) and IL-15 (25 ng/ml; PeproTech, Rocky Hill, NJ). IL-2 (10 IU/ml; Chiron, Emeryville, CA) was added to the cultures on day 1. On day 3, half the media was replaced with fresh culture media containing the same concentrations of IL-2, IL-7, and IL-15 used previously. On day 7, half the media was replaced with fresh culture media containing 20 IU/ml IL-2 and 25 ng/ml IL-7 and IL-15. On day 9, half the media was replaced with fresh culture media without cytokines. Cells were harvested and washed twice with PBS on day 10. Cultured T cell pellets were flash frozen in liquid nitrogen and stored at -140°C.
T cell receptor sequencing
TCR clones were evaluated in pre-treatment and post progression tumor tissue, matching peripheral blood lymphocytes (PBLs), and cMANA peptide stimulated autologous T cell cultures by next generation sequencing. DNA from pre- and post-treatment tumor samples and PBLs was isolated by using the Qiagen DNA FFPE and Qiagen DNA blood mini kit respectively (Qiagen, CA). For CGLU111 and CGLU115, pre-treatment tumor samples and serial PBLs were analyzed. TCR-β CDR3 regions were amplified using the survey (tumor) or deep (PBLs) ImmunoSeq assay in a multiplex PCR method using 45 forward primers specific to TCR Vβ gene segments and 13 reverse primers specific to TCR Jβ gene segments (Adaptive Biotechnologies) (52, 53). Productive TCR sequences were further analyzed. Given the low numbers of total productive rearrangements in the tumor samples, we used the TCR sequencing data from TILs to identify intra-tumoral clones that were present in peripheral and peptide-stimulated T cell samples but have refrained from drawing any conclusions directly from comparing TIL samples. The top 100 most frequent TCR clones in the tumor were used to determine their frequencies in peripheral blood prior to treatment, at the time of response and upon emergence of resistance. For each sample, a clonality metric was estimated in order to quantitate the extent of mono- or oligo-clonal expansion by measuring the shape of the clone frequency distribution19. Clonality values range from 0 to 1, where values approaching 1 indicate a nearly monoclonal population (Supplementary Table S15).
Immunohistochemistry and Interpretation of PD-L1 and CD8 staining
Immunohistochemistry for PD-L1 was performed using the PD-L1 IHC 22C3 pharmDx assay kit (Dako, CA). In brief, slides were deparaffinized with xylene and rehydrated with ethanol. Antigen retrieval was performed using citrate buffer (pH=6) at a temperature of 97 °C for 20 min. After blocking of endogenous peroxidase, slides were incubated with the primary mouse anti-human PD-L1 antibody (clone 22C3) or the negative control reagent for 30 minutes at room temperature. Slides were then incubated with an anti-mouse Linker antibody, followed by a 30-minute incubation with the FLEX+ secondary antibody/horseradish peroxidase polymer system. Signal was visualized with 3,3′ diaminobenzidine (DAB) and slides were counterstained with hematoxylin and coverslipped. NCI-226, a lung cancer cell line with known PD-L1 protein expression, and MCF-7, a breast cancer cell line with negative PD-L1 protein expression were used as positive and negative controls respectively. Negative control sections, in which the primary antibody was omitted were also used for each immunostaining run. A minimum of 100 tumor cells were evaluated per specimen; only membranous staining was considered specific and further interpreted. PD-L1 protein expression was evaluated based on the intensity of staining on a 0 to 3+ scale, and the percentage of immune-reactive tumor cells. Samples with membranous PD-L1 staining with an intensity score of 2+ in at least 1% of cells were classified as PD-L1 positive. Similarly, slides were deparaffinized, rehydrated, antigen retrieved and incubated with a mouse anti-human CD8 antibody (Dako, CA) diluted 1:100 overnight at 4°C, followed by a 30-minute incubation with the FLEX+ polymer system. DAB was used for signal visualization, sections were subsequently counterstained with hematoxylin and coverslipped. CD8-positive lymphocyte density was evaluated per 20× high power field (Supplementary Table S16). CD8 expression was evaluated in pre-treatment and post-progression tissue specimens for CLGU117 (Figure 3) and in post-progression specimens for CGLU116 and CGLU161 (Supplementary Figure S16) given limited tissue availability for the remaining cases.
Statistical analyses
Somatic mutations found to harbor at least one candidate neoantigen were utilized to compare features of immunogenicity between those eliminated and those shared or gained after treatment across the four patients. Given a specific binding threshold (IC50), mutations that generated neoantigens were characterized for features including minimum predicted IC50, average predicted affinity, the number of strong binder classifications and corresponding gene expression. To reduce redundancy, somatic mutations with multiple peptides satisfying the IC50 threshold were represented by their average value for downstream statistical comparisons of lost and shared/gained groups. The student’s T test was applied to compare mean predicted MHC affinities between lost and gained, and lost and retained cMANAs using both a 50nM and 500nM threshold. Only significant differences are indicated in the results. For the differential expansion TCR analysis, productive frequencies in the peptide stimulated T cells were compared to unstimulated T cells (“no peptide” condition) by Fisher’s exact test. TCR clones above 0.025% were considered expanded when they were found to be significantly expanded in a single cMANA-stimulated condition and not expanded in any other peptide-stimulated conditions. The p-values were corrected for multiple hypothesis testing using Benjamini-Hochberg (51) procedure. Statistical analysis was performed in R version 3.2.2.
Supplementary Material
Statement of Significance.
Acquired resistance to immune checkpoint therapy is being recognized more commonly. This work demonstrates for the first time that acquired resistance to immune checkpoint blockade can arise in association with the evolving landscape of mutations, some of which encode tumor neoantigens recognizable by T cells. These observations imply that widening the breadth of neoantigen reactivity may mitigate the development of acquired resistance.
Acknowledgments
We thank members of our laboratories for critical review of the manuscript.
Grant Support
This work was supported by US National Institutes of Health grants CA121113 (V.E.V.), CA006973 (S.B.B., D.M.P., V.E.V.), CA180950 (V.E.V), DE019032 (H.K., V.E.V), the Commonwealth Foundation (V.E.V.), The Bloomberg-Kimmel Institute for Cancer Immunotherapy (J.R.B., D.M.P., V.E.V.), the Dr. Miriam and Sheldon G. Adelson Medical Research Foundation (S.B.B., V.E.V.), the Eastern Cooperative Oncology Group- American College of Radiology Imaging Network (V.A.), MacMillan Foundation (V.A.), the William R. Brody Faculty Scholarship (R.K.) the LUNGevity Foundation (P.M.F.), the Stand Up To Cancer-American Cancer Society Lung Cancer Dream Team Translational Research Grant (SU2C-AACR-DT17-15; P.M.F. and E.G.), the Stand Up to Cancer-Dutch Cancer Society International Translational Cancer Research Dream Team Grant (SU2C-AACR-DT1415; V.E.V.), and the NCI Experimental Therapeutics Clinical Trials Network (H.K.). Stand Up To Cancer is a program of the Entertainment Industry Foundation administered by the American Association for Cancer Research.
P.M.F. receives research funding for clinical trials from Bristol-Myers Squibb, AstraZeneca/MedImmune, Kyowa and Novartis and is a consultant/advisory board member (uncompensated) for Bristol-Myers Squibb, Novartis, AstraZeneca/MedImmune, Celgene and Inivata. J.W. is a consultant for Personal Genome Diagnostics. T.Z. is an employee of Personal Genome Diagnostics. J.N. receives research funding from Merck and AstraZeneca/MedImmune and is a consultant/advisory board member of Bristol-Myers Squibb and AstraZeneca/MedImmune. H.K. receives funding for clinical trials from Merck, AstraZeneca, Plexxikon and Advaxis. W.S. receives research funding from Bristol-Myers Squibb and Merck and is a consultant for Bristol-Myers Squibb, Merck, Novartis and Castle Biosciences. P.I. is a consultant/advisory board member for Genentech, Roche and AstraZeneca. S.B.B. is a professor at the Center for Epigenetics at Van Andel Research Institute, Grand Rapids, Michigan. S.B.B. is a consultant for MDxHealth and receives research funding for clinical trials from Rising Tide and Jim Toth. J.R.B. receives research grants from Bristol-Myers Squibb, AstraZeneca/MedImmune and Merck and is a consultant/advisory board member for Bristol-Myers Squibb, AstraZeneca/MedImmune and Merck. C.Z. receives research grants from Janssen. D.M.P. receives research support from Bristol-Myers Squibb, Compugen and Potenza Therapeutics and is a consultant for Aduro Biotech, Amgen, AstraZeneca/Medimmune, Bayer, Compugen, DNAtrix, Five Prime, GlaxoSmithKline, ImmuneXcite, Jounce Therapeutics, Neximmune, Pfizer, Rock Springs Capital, Sanofi and Vesuvius/Tizona. V.E.V. is a founder of Personal Genome Diagnostics, is a member of its Scientific Advisory Board and Board of Directors, and owns Personal Genome Diagnostics stock, which is subject to certain restrictions under university policy. V.E.V. is a member of the Scientific Advisory Board of Ignyta.
Footnotes
Disclosure of Potential Conflicts of Interest
The terms of these arrangements are managed by the Johns Hopkins University in accordance with its conflict of interest policies.
References
- 1.Vogelstein B, Papadopoulos N, Velculescu VE, Zhou S, Diaz LA, Jr, Kinzler KW. Cancer genome landscapes. Science. 2013;339(6127):1546–58. doi: 10.1126/science.1235122. [DOI] [PMC free article] [PubMed] [Google Scholar]
- 2.Schumacher TN, Schreiber RD. Neoantigens in cancer immunotherapy. Science. 2015;348(6230):69–74. doi: 10.1126/science.aaa4971. [DOI] [PubMed] [Google Scholar]
- 3.Segal NH, Parsons DW, Peggs KS, Velculescu V, Kinzler KW, Vogelstein B, et al. Epitope landscape in breast and colorectal cancer. Cancer Res. 2008;68(3):889–92. doi: 10.1158/0008-5472.CAN-07-3095. [DOI] [PubMed] [Google Scholar]
- 4.Rizvi NA, Hellmann MD, Snyder A, Kvistborg P, Makarov V, Havel JJ, et al. Cancer immunology. Mutational landscape determines sensitivity to PD-1 blockade in non-small cell lung cancer. Science. 2015;348(6230):124–8. doi: 10.1126/science.aaa1348. [DOI] [PMC free article] [PubMed] [Google Scholar]
- 5.Snyder A, Makarov V, Merghoub T, Yuan J, Zaretsky JM, Desrichard A, et al. Genetic basis for clinical response to CTLA-4 blockade in melanoma. The New England journal of medicine. 2014;371(23):2189–99. doi: 10.1056/NEJMoa1406498. [DOI] [PMC free article] [PubMed] [Google Scholar]
- 6.Van Allen EM, Miao D, Schilling B, Shukla SA, Blank C, Zimmer L, et al. Genomic correlates of response to CTLA-4 blockade in metastatic melanoma. Science. 2015;350(6257):207–11. doi: 10.1126/science.aad0095. [DOI] [PMC free article] [PubMed] [Google Scholar]
- 7.Tumeh PC, Harview CL, Yearley JH, Shintaku IP, Taylor EJ, Robert L, et al. PD-1 blockade induces responses by inhibiting adaptive immune resistance. Nature. 2014;515(7528):568–71. doi: 10.1038/nature13954. [DOI] [PMC free article] [PubMed] [Google Scholar]
- 8.Herbst RS, Soria JC, Kowanetz M, Fine GD, Hamid O, Gordon MS, et al. Predictive correlates of response to the anti-PD-L1 antibody MPDL3280A in cancer patients. Nature. 2014;515(7528):563–7. doi: 10.1038/nature14011. [DOI] [PMC free article] [PubMed] [Google Scholar]
- 9.Garon EB, Rizvi NA, Hui R, Leighl N, Balmanoukian AS, Eder JP, et al. Pembrolizumab for the treatment of non-small-cell lung cancer. The New England journal of medicine. 2015;372(21):2018–28. doi: 10.1056/NEJMoa1501824. [DOI] [PubMed] [Google Scholar]
- 10.Topalian SL, Taube JM, Anders RA, Pardoll DM. Mechanism-driven biomarkers to guide immune checkpoint blockade in cancer therapy. Nature reviews. 2016;16(5):275–87. doi: 10.1038/nrc.2016.36. [DOI] [PMC free article] [PubMed] [Google Scholar]
- 11.Gettinger SN, Horn L, Gandhi L, Spigel DR, Antonia SJ, Rizvi NA, et al. Overall Survival and Long-Term Safety of Nivolumab (Anti-Programmed Death 1 Antibody, BMS-936558, ONO-4538) in Patients With Previously Treated Advanced Non-Small-Cell Lung Cancer. Journal of clinical oncology : official journal of the American Society of Clinical Oncology. 2015;33(18):2004–12. doi: 10.1200/JCO.2014.58.3708. [DOI] [PMC free article] [PubMed] [Google Scholar]
- 12.Koyama S, Akbay EA, Li YY, Herter-Sprie GS, Buczkowski KA, Richards WG, et al. Adaptive resistance to therapeutic PD-1 blockade is associated with upregulation of alternative immune checkpoints. Nature communications. 2016;7:10501. doi: 10.1038/ncomms10501. [DOI] [PMC free article] [PubMed] [Google Scholar]
- 13.Maeurer MJ, Gollin SM, Storkus WJ, Swaney W, Karbach J, Martin D, et al. Tumor escape from immune recognition: loss of HLA-A2 melanoma cell surface expression is associated with a complex rearrangement of the short arm of chromosome 6. Clinical cancer research : an official journal of the American Association for Cancer Research. 1996;2(4):641–52. [PubMed] [Google Scholar]
- 14.Shukla SA, Rooney MS, Rajasagi M, Tiao G, Dixon PM, Lawrence MS, et al. Comprehensive analysis of cancer-associated somatic mutations in class I HLA genes. Nat Biotechnol. 2015;33(11):1152–8. doi: 10.1038/nbt.3344. [DOI] [PMC free article] [PubMed] [Google Scholar]
- 15.Zaretsky JM, Garcia-Diaz A, Shin DS, Escuin-Ordinas H, Hugo W, Hu-Lieskovan S, et al. Mutations Associated with Acquired Resistance to PD-1 Blockade in Melanoma. The New England journal of medicine. 2016;375(9):819–29. doi: 10.1056/NEJMoa1604958. [DOI] [PMC free article] [PubMed] [Google Scholar]
- 16.Jones S, Anagnostou V, Lytle K, Parpart-Li S, Nesselbush M, Riley DR, et al. Personalized genomic analyses for cancer mutation discovery and interpretation. Science translational medicine. 2015;7(283):283ra53. doi: 10.1126/scitranslmed.aaa7161. [DOI] [PMC free article] [PubMed] [Google Scholar]
- 17.Cann KL, Dellaire G. Heterochromatin and the DNA damage response: the need to relax. Biochem Cell Biol. 2011;89(1):45–60. doi: 10.1139/O10-113. [DOI] [PubMed] [Google Scholar]
- 18.Cancer Genome Atlas Research N. Comprehensive genomic characterization of squamous cell lung cancers. Nature. 2012;489(7417):519–25. doi: 10.1038/nature11404. [DOI] [PMC free article] [PubMed] [Google Scholar]
- 19.Peng W, Chen JQ, Liu C, Malu S, Creasy C, Tetzlaff MT, et al. Loss of PTEN Promotes Resistance to T Cell-Mediated Immunotherapy. Cancer discovery. 2016;6(2):202–16. doi: 10.1158/2159-8290.CD-15-0283. [DOI] [PMC free article] [PubMed] [Google Scholar]
- 20.Rudolph MG, Stanfield RL, Wilson IA. How TCRs bind MHCs, peptides, and coreceptors. Annual review of immunology. 2006;24:419–66. doi: 10.1146/annurev.immunol.23.021704.115658. [DOI] [PubMed] [Google Scholar]
- 21.Yadav M, Jhunjhunwala S, Phung QT, Lupardus P, Tanguay J, Bumbaca S, et al. Predicting immunogenic tumour mutations by combining mass spectrometry and exome sequencing. Nature. 2014;515(7528):572–6. doi: 10.1038/nature14001. [DOI] [PubMed] [Google Scholar]
- 22.Niknafs N, Beleva-Guthrie V, Naiman DQ, Karchin R. SubClonal Hierarchy Inference from Somatic Mutations: Automatic Reconstruction of Cancer Evolutionary Trees from Multi-region Next Generation Sequencing. PLoS Comput Biol. 2015;11(10):e1004416. doi: 10.1371/journal.pcbi.1004416. [DOI] [PMC free article] [PubMed] [Google Scholar]
- 23.Bertotti A, Papp E, Jones S, Adleff V, Anagnostou V, Lupo B, et al. The genomic landscape of response to EGFR blockade in colorectal cancer. Nature. 2015;526(7572):263–7. doi: 10.1038/nature14969. [DOI] [PMC free article] [PubMed] [Google Scholar]
- 24.Jones S, Chen WD, Parmigiani G, Diehl F, Beerenwinkel N, Antal T, et al. Comparative lesion sequencing provides insights into tumor evolution. Proceedings of the National Academy of Sciences of the United States of America. 2008;105(11):4283–8. doi: 10.1073/pnas.0712345105. [DOI] [PMC free article] [PubMed] [Google Scholar]
- 25.Yachida S, Jones S, Bozic I, Antal T, Leary R, Fu B, et al. Distant metastasis occurs late during the genetic evolution of pancreatic cancer. Nature. 2010;467(7319):1114–7. doi: 10.1038/nature09515. [DOI] [PMC free article] [PubMed] [Google Scholar]
- 26.Campbell PJ, Yachida S, Mudie LJ, Stephens PJ, Pleasance ED, Stebbings LA, et al. The patterns and dynamics of genomic instability in metastatic pancreatic cancer. Nature. 2010;467(7319):1109–13. doi: 10.1038/nature09460. [DOI] [PMC free article] [PubMed] [Google Scholar]
- 27.Matsushita H, Vesely MD, Koboldt DC, Rickert CG, Uppaluri R, Magrini VJ, et al. Cancer exome analysis reveals a T-cell-dependent mechanism of cancer immunoediting. Nature. 2012;482(7385):400–4. doi: 10.1038/nature10755. [DOI] [PMC free article] [PubMed] [Google Scholar]
- 28.Verdegaal EM, de Miranda NF, Visser M, Harryvan T, van Buuren MM, Andersen RS, et al. Neoantigen landscape dynamics during human melanoma-T cell interactions. Nature. 2016;536(7614):91–5. doi: 10.1038/nature18945. [DOI] [PubMed] [Google Scholar]
- 29.Dudley ME, Roopenian DC. Loss of a unique tumor antigen by cytotoxic T lymphocyte immunoselection from a 3-methylcholanthrene-induced mouse sarcoma reveals secondary unique and shared antigens. The Journal of experimental medicine. 1996;184(2):441–7. doi: 10.1084/jem.184.2.441. [DOI] [PMC free article] [PubMed] [Google Scholar]
- 30.Ribas A. Adaptive Immune Resistance: How Cancer Protects from Immune Attack. Cancer discovery. 2015;5(9):915–9. doi: 10.1158/2159-8290.CD-15-0563. [DOI] [PMC free article] [PubMed] [Google Scholar]
- 31.Hugo W, Zaretsky JM, Sun L, Song C, Moreno BH, Hu-Lieskovan S, et al. Genomic and Transcriptomic Features of Response to Anti-PD-1 Therapy in Metastatic Melanoma. Cell. 2016;165(1):35–44. doi: 10.1016/j.cell.2016.02.065. [DOI] [PMC free article] [PubMed] [Google Scholar]
- 32.Brahmer J, Reckamp KL, Baas P, Crino L, Eberhardt WE, Poddubskaya E, et al. Nivolumab versus Docetaxel in Advanced Squamous-Cell Non-Small-Cell Lung Cancer. The New England journal of medicine. 2015;373(2):123–35. doi: 10.1056/NEJMoa1504627. [DOI] [PMC free article] [PubMed] [Google Scholar]
- 33.Alexandrov LB, Nik-Zainal S, Wedge DC, Aparicio SA, Behjati S, Biankin AV, et al. Signatures of mutational processes in human cancer. Nature. 2013;500(7463):415–21. doi: 10.1038/nature12477. [DOI] [PMC free article] [PubMed] [Google Scholar]
- 34.McGranahan N, Furness AJ, Rosenthal R, Ramskov S, Lyngaa R, Saini SK, et al. Clonal neoantigens elicit T cell immunoreactivity and sensitivity to immune checkpoint blockade. Science. 2016;351(6280):1463–9. doi: 10.1126/science.aaf1490. [DOI] [PMC free article] [PubMed] [Google Scholar]
- 35.Sausen M, Leary RJ, Jones S, Wu J, Reynolds CP, Liu X, et al. Integrated genomic analyses identify ARID1A and ARID1B alterations in the childhood cancer neuroblastoma. Nature genetics. 2013;45(1):12–7. doi: 10.1038/ng.2493. [DOI] [PMC free article] [PubMed] [Google Scholar]
- 36.Needleman SB, Wunsch CD. A general method applicable to the search for similarities in the amino acid sequence of two proteins. J Mol Biol. 1970;48(3):443–53. doi: 10.1016/0022-2836(70)90057-4. [DOI] [PubMed] [Google Scholar]
- 37.Cibulskis K, Lawrence MS, Carter SL, Sivachenko A, Jaffe D, Sougnez C, et al. Sensitive detection of somatic point mutations in impure and heterogeneous cancer samples. Nat Biotechnol. 2013;31(3):213–9. doi: 10.1038/nbt.2514. [DOI] [PMC free article] [PubMed] [Google Scholar]
- 38.UCSC. https://genome.ucsc.edu/
- 39.http://genome.ucsc.edu/cgi-bin/hgBlat.
- 40.Szolek A, Schubert B, Mohr C, Sturm M, Feldhahn M, Kohlbacher O. OptiType: precision HLA typing from next-generation sequencing data. Bioinformatics. 2014;30(23):3310–6. doi: 10.1093/bioinformatics/btu548. [DOI] [PMC free article] [PubMed] [Google Scholar]
- 41.Nielsen M, Andreatta M. NetMHCpan-3.0; improved prediction of binding to MHC class I molecules integrating information from multiple receptor and peptide length datasets. Genome Med. 2016;8(1):33. doi: 10.1186/s13073-016-0288-x. [DOI] [PMC free article] [PubMed] [Google Scholar]
- 42.Lundegaard C, Lamberth K, Harndahl M, Buus S, Lund O, Nielsen M. NetMHC-3.0: accurate web accessible predictions of human, mouse and monkey MHC class I affinities for peptides of length 8–11. Nucleic Acids Res. 2008;36:W509–12. doi: 10.1093/nar/gkn202. (Web Server issue) [DOI] [PMC free article] [PubMed] [Google Scholar]
- 43.Lundegaard C, Lund O, Nielsen M. Accurate approximation method for prediction of class I MHC affinities for peptides of length 8, 10 and 11 using prediction tools trained on 9mers. Bioinformatics. 2008;24(11):1397–8. doi: 10.1093/bioinformatics/btn128. [DOI] [PubMed] [Google Scholar]
- 44.Stranzl T, Larsen MV, Lundegaard C, Nielsen M. NetCTLpan: pan-specific MHC class I pathway epitope predictions. Immunogenetics. 2010;62(6):357–68. doi: 10.1007/s00251-010-0441-4. [DOI] [PMC free article] [PubMed] [Google Scholar]
- 45.Kim Y, Sidney J, Pinilla C, Sette A, Peters B. Derivation of an amino acid similarity matrix for peptide: MHC binding and its application as a Bayesian prior. BMC Bioinformatics. 2009;10:394. doi: 10.1186/1471-2105-10-394. [DOI] [PMC free article] [PubMed] [Google Scholar]
- 46.Rammensee H, Bachmann J, Emmerich NP, Bachor OA, Stevanovic S. SYFPEITHI: database for MHC ligands and peptide motifs. Immunogenetics. 1999;50(3–4):213–9. doi: 10.1007/s002510050595. [DOI] [PubMed] [Google Scholar]
- 47.Talevich E, Shain AH, Botton T, Bastian BC. CNVkit: Copy number detection and visualization for targeted sequencing using off-target reads. 2014 doi: 10.1371/journal.pcbi.1004873. bioRxiv doi: http://dxdoiorg/101101/010876. [DOI] [PMC free article] [PubMed]
- 48.Aran D, Sirota M, Butte AJ. Systematic pan-cancer analysis of tumour purity. Nature communications. 2015;6:8971. doi: 10.1038/ncomms9971. [DOI] [PMC free article] [PubMed] [Google Scholar]
- 49.Li Y, Xie X. Deconvolving tumor purity and ploidy by integrating copy number alterations and loss of heterozygosity. Bioinformatics. 2014;30(15):2121–9. doi: 10.1093/bioinformatics/btu174. [DOI] [PMC free article] [PubMed] [Google Scholar]
- 50.Favero F, Joshi T, Marquard AM, Birkbak NJ, Krzystanek M, Li Q, et al. Sequenza: allele-specific copy number and mutation profiles from tumor sequencing data. Annals of oncology : official journal of the European Society for Medical Oncology / ESMO. 2015;26(1):64–70. doi: 10.1093/annonc/mdu479. [DOI] [PMC free article] [PubMed] [Google Scholar]
- 51.Benjamini Y, Hochberg Y. Controlling the False Discovery Rate: A Practical and Powerful Approach to Multiple Testing. Journal of the Royal Statistical Society Series B (methodological) 1995;57(1):289–300. [Google Scholar]
- 52.Carlson CS, Emerson RO, Sherwood AM, Desmarais C, Chung MW, Parsons JM, et al. Using synthetic templates to design an unbiased multiplex PCR assay. Nature communications. 2013;4:2680. doi: 10.1038/ncomms3680. [DOI] [PubMed] [Google Scholar]
- 53.Robins HS, Campregher PV, Srivastava SK, Wacher A, Turtle CJ, Kahsai O, et al. Comprehensive assessment of T-cell receptor beta-chain diversity in alphabeta T cells. Blood. 2009;114(19):4099–107. doi: 10.1182/blood-2009-04-217604. [DOI] [PMC free article] [PubMed] [Google Scholar]
Associated Data
This section collects any data citations, data availability statements, or supplementary materials included in this article.