

SUMMARY
Ca2+ entry into mitochondria is mediated by the Ca2+ uniporter-channel complex containing MCU, the Ca2+-selective pore, and associated regulatory proteins. The roles of MICU proteins are controversial. MICU1 was proposed to be necessary for MCU activity whereas subsequent studies suggested it inhibits the channel in the low-cytoplasmic Ca2+ ([Ca2+]c) regime, a mechanism referred to as “gatekeeping”, that imposes a [Ca2+]c threshold for channel activation at ~1–3 μM. Here we measured MCU activity over a wide range of quantitatively-controlled and recorded [Ca2+]c. MICU1 alone can mediate gatekeeping as well as highly-cooperative activation of MCU activity, whereas the fundamental role of MICU2 is to regulate the threshold and gain of MICU1-mediated inhibition and activation of MCU. Our results provide a unifying model for the roles of the MICU1/2 hetero-dimer in MCU-channel regulation and suggest an evolutionary role for MICU2 in spatially restricting Ca2+ crosstalk between single InsP3R and MCU channels.
Keywords: mitochondria, calcium, uniporter, inositol trisphosphate receptor, nanodomain
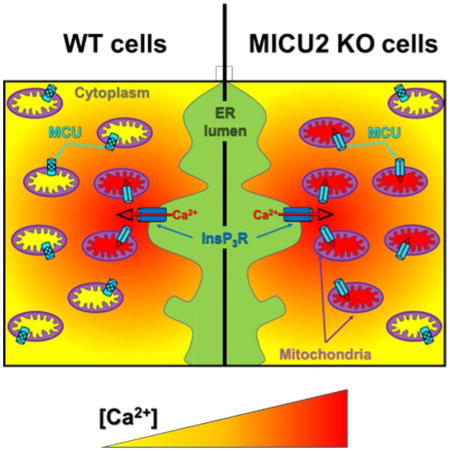
Graphical Abstract
INTRODUCTION
Mitochondrial calcium (Ca2+) uptake plays important roles in regulating cell bioenergetics, cell death and cytoplasmic Ca2+ signaling. The inner-membrane (IMM) voltage (ΔΨm) generated by the respiratory chain provides a tremendous thermodynamic driving force for Ca2+ uptake from the cytoplasm into the matrix. Nevertheless, mitochondrial-matrix Ca2+ concentration ([Ca2+]m) must be tightly controlled to maintain a balance between optimal energy production and toxic effects, including IMM depolarization and activation of the permeability transition pore. The major mechanism for Ca2+ entry into the mitochondrial matrix is the Ca2+ uniporter (Gunter and Gunter, 1994) shown by mitoplast patch-clamp electrophysiology to be a highly-selective Ca2+ channel with high carrying-capacity (Kirichok et al., 2004). Although Ca2+ that enters mitochondria can be extruded by efflux mechanisms, including the Na+/Ca2+ exchanger (NCLX) (Palty et al., 2010), additional mechanisms must be present to ensure that the rate of Ca2+ influx does not exceed extrusion capacity and cause Ca2+ overload. Previously, it was suggested that an intrinsically-low Ca2+affinity of the channel prevented mitochondrial Ca2+ uptake unless the channel was exposed to high cytoplasmic [Ca2+] ([Ca2+]c) that exist in nanodomains associated with activated Ca2+ channels in the plasma membrane or intracellular organelles, especially the endoplasmic reticulum (ER), the major Ca2+ storage organelle in cells. Nevertheless, the uniporter channel was shown to have a very-high Ca2+ affinity, < 20 nM (Kirichok et al., 2004), suggesting that whereas mitochondrial Ca2+ uptake required high [Ca2+]c, it was unlikely to be due to an intrinsic low-Ca2+ affinity, but rather to regulatory mechanisms that keep the channel closed until [Ca2+]c reaches sufficiently high levels.
The molecular identity of the uniporter channel complex was elucidated recently. MCU constitutes the pore-forming subunit (Baughman et al., 2011; De Stefani et al., 2011), and interacts with several proteins to regulate its activity, including Mitochondrial Calcium Uptake protein 1 (MICU1) (Perocchi et al., 2010), its paralogs MICU2 and MICU3 (Plovanich et al., 2013), Mitochondrial Calcium Uniporter Regulator 1 (MCUR1) (Mallilankaraman et al., 2012), and Essential MCU Regulator (EMRE) (Sancak et al., 2013). EMRE is a membrane protein that interacts with and is essential for MCU-channel activity in mammalian cells (Sancak et al., 2013) and may tether MICU1 to the channel complex (Tsai et al., 2016). In humans, MICU1 and MICU2 are widely expressed, whereas MICU3 appears to be largely restricted to the central nervous system (Plovanich et al., 2013). The roles of MICU proteins in MCU regulation are controversial. MICU1 was originally proposed to be necessary for MCU-channel activity (Perocchi et al., 2010). Subsequent studies suggested that it instead plays a critical role in inhibiting MCU activity in the low-[Ca2+]c regime, a mechanism referred to as “gatekeeping”, that imposed a [Ca2+]c threshold for channel activation at ~1–3 μM (Mallilankaraman et al., 2012; Csordás et al, 2013; Patron et al., 2014). Other studies suggested that MICU1 is necessary to promote mitochondrial Ca2+ uptake in response to [Ca2+]c elevations (Perocchi et al., 2010; Csordás et al, 2013; Patron et al., 2014; Kamer and Mootha, 2014; Antony et al., 2016), with some suggesting that it plays dual roles in gatekeeping and cooperative channel-activation (Csordás et al, 2013; Antony et al., 2016). MICU proteins contain two Ca2+-binding EF hands. It is debated whether they play a role in MICU1-mediated channel inhibition in low [Ca2+]c (Mallilankaraman et al., 2012; Hoffman et al., 2013; Kamer and Mootha, 2014). Early studies of MICU1 were complicated by the discovery that its knockdown affected expression of MICU2 (Plovanich et al., 2013; Patron et al., 2014; Kamer and Mootha, 2014). Under physiological conditions, MICU1 forms an obligate hetero-dimer with MICU2, stabilizing MICU2 expression (Patron et al., 2014; Petrungaro et al., 2015). On the other hand, over-expression of MICU1, or knockdown of MICU2, generates MICU1 homo-dimers (Patron et al., 2014; Petrungaro et al., 2015). Conversely, MICU2 does not form homo-dimers in cells, nor can it associate with MCU in the absence of MICU1 (Patron et al., 2014; Kamer and Mootha, 2014). It has been suggested that loss of gatekeeping in MICU1 knock-down cells is due to loss of MICU2 (Patron et al., 2014). In this model, MICU2 is the “true gatekeeper”, inhibiting the channel in its Ca2+-free form, whereas cooperative channel-activation requires Ca2+ binding to MICU1, as well as to MICU2, to relieve channel inhibition. Alternatively, it has been suggested that both MICU1 and MICU2 play roles in gatekeeping, with MICU2 having no role in channel activation (Matesanz-Isabel et al., 2016). Finally, it has been suggested that both MICU1 and MICU2 contribute to setting the threshold for MCU activation (Kamer and Mootha, 2014). The functions of both proteins are controversial in part because over-expression strategies have been used with channel-component stoichiometries not well known, and because MCU-specific Ca2+-uptake rates were not rigorously quantitated over a wide range of quantitatively-controlled and recorded [Ca2+]c. The importance of understanding regulation of MCU-channel activity by MICU proteins is underscored by human loss-of-function mutations in MICU1 that result in apparent mitochondrial-Ca2+ overload and cause early-onset muscle weakness and CNS defects (Logan et al., 2013; Lewis-Smith et al., 2016). Similar pathology and effects on mitochondrial [Ca2+] observed in surviving MICU1_KO mice suggested that constitutive MCU-activity in vivo caused disease pathogenesis (Liu et al., 2016).
Here, we employed cells with MICU1 or MICU2 genetically deleted to address the molecular mechanisms by which MICU1 and MICU2 regulate MCU function, particularly in the previously-uncharacterized [Ca2+]c regime below 500 nM. Our results suggest that MICU1 alone can mediate gatekeeping as well as highly-cooperative activation of MCU channel activity, whereas the fundamental role of MICU2 is to regulate the threshold and gain of MICU1-mediated inhibition and activation of MCU. Our results provide a unifying model for the role of the MICU1/2 hetero-dimer in MCU channel regulation and suggest an evolutionary role for MICU2 in spatially restricting Ca2+ crosstalk between single InsP3R and MCU channels.
RESULTS
MICU1 is Required to Suppress MCU Activity in Low [Ca2+]c
We first examined the role of MICU1 in the previously-unexplored [Ca2+]c range between 100 nM and 300 nM. To measure MCU activity in this low-[Ca2+]c regime, we studied permeabilized cells (Mallilankaraman et al., 2012) in an intracellular-like medium lacking Ca2+ buffers (free [Ca2+] ~20 nM; see Supplementary Experimental Procedures), using the high-affinity indicator Fura-2 to measure [Ca2+]c, and JC-1 or TMRE to simultaneously monitor ΔΨm. Under these conditions, mitochondrial Ca2+ transport plays the dominant role in determining [Ca2+]c since, addition of a Ca2+ bolus to rapidly raise [Ca2+]c to 5 μM was followed by clearance of Ca2+ over 100–200 seconds in wild-type (WT) cells but not in cells with MCU genetically-deleted (Figure S1). Subsequent dissipation of ΔΨm by CCCP caused a rapid [Ca2+]c increase in WT cells, providing further evidence that mitochondria were responsible for Ca2+ uptake in response to a rise of [Ca2+]c (Figure S1).
Upon attainment of a quasi-steady-state [Ca2+]c ~300 sec following thapsigargin (Tg) treatment to eliminate confounding influences of the ER, addition of CGP37157 to inhibit NCLX caused no change in [Ca2+]c in WT or MCU_KO cells (Figure 1A and 1B), indicating that mitochondrial Ca2+ uptake and extrusion were inactive. In contrast, it resulted in a prompt decrease in [Ca2+]c in cells lacking MICU1 (MICU1_KO; Figure 1A and 1B), indicating that Ca2+ uptake was ongoing, balanced by NCLX-mediated extrusion. Clearance of bath Ca2+ in MICU1_KO cells was blocked by Ru360 (1 μM – not shown), indicating that it was mediated by MCU. These results recapitulate previous observations that MCU-mediated Ca2+ uptake in low [Ca2+]c is strongly enhanced in the absence of MICU1 (Mallilankaraman et al., 2012; Csordás et al, 2013; Patron et al., 2014; Liu et al., 2016). Using a genetically-encoded Ca2+ indicator targeted to the mitochondrial matrix (mito-CAR-GECO1; KD = 490 nM; Figures 1C) (Wu et al., 2013), [Ca2+]m in WT cells was ~100 nM whereas it was increased over 3-fold to ~300–400 nM in MICU1_KO cells (Figure 1D). Thus, MICU1 is required to inhibit MCU activity in the low-[Ca2+]c regime, and in its absence the rate of Ca2+ influx is sufficient to raise resting [Ca2+]m.
Figure 1. MICU1, But Not MICU2, is Required to Suppress MCU Activity in Low [Ca2+]c.

(A) Bath [Ca2+] ([Ca2+]c) of wild-type cells (WT (HEK-293T)), MCU_KO, MICU1_KO, MICU1_KO cells with MICU2 re-expressed, and MICU1_KO cells with MICU2 and MICU1-Flag expressed (rescue). Cells were treated with 0.004% digitonin (Dg) to permeabilize plasma membrane, 2 μM thapsigargin (Tg) to block ER Ca2+ uptake, and 20 μM CGP37157 to inhibit mitochondrial Ca2+ efflux, added at t = 50, 100 and 400 sec, respectively, as indicated. Representative traces from n ≥ 5 independent replicates for each cell line shown. As shown in schematic inset, rates of MCU-mediated Ca2+ uptake and NCLX-mediated Ca2+ extrusion are equal in the steady-state. Inhibition of extrusion by CGP37157 reveals ongoing MCU-mediated Ca2+ uptake in MICU1_KO and [MICU1_KO+MICU2] cells, whereas no effect is observed in the other cell types, indicating that MCU was not active.
(B) Quantification of initial mitochondrial Ca2+-uptake rate in response to inhibition of NCLX-mediated Ca2+ efflux for cell lines in (A). Each point represents initial Ca2+ uptake rate from an independent experiment (n = 5 for each condition) determined by single-exponential fit to reduction of [Ca2+]c. Bars: mean +/− SEM (*P < 0.05; **P < 0.01; n.s, not different; Bonferroni’s multiple comparisons test).
(C) Basal mito-CAR-GECO1 fluorescence in WT or MICU1_KO HEK-293T cells stably expressing MICU1 and/or MICU2, imaged at 20× magnification. Surface plots: relative fluorescence intensity histograms.
(D) [Ca2+]m for cell lines in (C), calibrated from mito-CAR-GECO1 fluorescence. Each point represents an independent experiment. (WT: n = 12; MICU1_KO: n = 7; [MICU1_KO+MICU2]: n = 4; MICU1-rescue: n = 5) Bars: mean [Ca2+]m +/− SEM. (*P < 0.05; **P < 0.01; n.s, not different; Bonferroni’s multiple comparisons test).
(E) Western blots of MICU1, MICU2, MCU and β-actin from cells as labeled. Quantification from n = 3 independent experiments normalized for β-actin intensity shown at right. (* P < 0.05; ** P < 0.01; n.s, not different; Student’s t-test).
MICU2 expression was substantially reduced in cells lacking MICU1 (Figure 1E). Accordingly, loss of MCU gatekeeping and constitutively-elevated [Ca2+]m observed in MICU1_KO cells here and other studies could be caused or modified by loss of MICU2. Expression of MICU1-Flag alone in MICU1_KO cells rescued MICU2 expression to endogenous levels only when MICU1-Flag was expressed at above endogenous levels (Figure S2A and S2B). However, gatekeeping was not fully rescued (Figure S2C), suggesting that an optimal MICU1:MICU2 stoichiometry is required. In contrast, stable expression of both MICU1-Flag and MICU2 (Figure 1E and S2B) in MICU1_KO cells (hereafter defined as MICU1-rescue cells) completely rescued gatekeeping (Figure 1A and 1B) and restored [Ca2+]m to WT levels (Figure 1C and 1D). Together, these results demonstrate that MICU1 is required for MCU gatekeeping in the low-[Ca2+]c regime
Gatekeeping of MCU is Cooperatively Relieved When [Ca2+]c Exceeds ~1.3 μM
Physiological [Ca2+]c signals can generate increases in [Ca2+]m, indicating that MCU gatekeeping is relieved when [Ca2+]c is elevated. Nevertheless, quantitative measurements of the precise [Ca2+]c that govern this process are limited. We therefore evaluated the [Ca2+]c-dependence of MCU-mediated Ca2+-uptake over a range of [Ca2+]c. In each experiment, cells were challenged with a calibrated bolus of CaCl2 to increase [Ca2+]c to between 100 nM and 10 μM, and [Ca2+]c was monitored until a steady state was reached (Figure 2A and 2B). ΔΨm remained essentially unchanged when measured with JC-1 (Figure 2A and 2B). TMRE, a ΔΨm probe with faster kinetics, revealed only small transient depolarizations (Figure S3).
Figure 2. Gatekeeping of MCU is Relieved Above ~1.3 μM [Ca2+]c.

(A–B) Mitochondrial Ca2+ uptake in suspensions of permeabilized WT (A) and MICU1_KO (B) cells in response to acute increases of [Ca2+]c to between ~0.1 and 10 μM. Individual traces from independent experiments with different bolus additions shown. Insets show relative ΔΨm over same period. After monitoring uptake for 300 sec, CCCP uncoupled ΔΨm and released matrix Ca2+ content.
(C) Mitochondrial Ca2+-uptake in WT (black traces) and MICU1_KO (red) in response to Ca2+ additions that elevated [Ca2+]c to 0.3–1.5 μM.
(D) Steady-state [Ca2+]c 300 sec after initiation of uptake, plotted as function of initial [Ca2+]c between 0–1.5 μM. Each point represents an independent experiment. Dashed lines: theoretical fits representing no uptake (gray, slope = 1) or 100% uptake (yellow, slope = 0). WT and MICU1-rescue cells demonstrated negligible uptake at [Ca2+]c < 1 μM.
(E) Mitochondrial Ca2+ uptake in WT (black traces) and MICU1_KO (red traces) cells in response to Ca2+ additions that elevated [Ca2+]c to 3–8 μM.
(F) Same as in (D) for [Ca2+]c between 0–8 μM. When initial [Ca2+]c > 2 μM, uptake proceeds until [Ca2+]c reaches ~1.5 μM.
(G) Ca2+-uptake rates in response to acute challenge with [Ca2+]c between 0.1–9 μM. Each point represents an independent experiment. Solid lines: Hill-Equation fits of Ca2+-uptake rate vs. [Ca2+]c plotted on linear scale. Dashed yellow line: upper limit of Ca2+-uptake rate determinations. Error bars: standard deviation in fit parameters A (extent) and τ (time constant). Error bars for some points are too small to be visible.
(H) Linear fits of log10 transformed values in (G) that demonstrate cooperativity of MCU activation and highlight differences in Ca2+-uptake rates at low (< 1 μM) [Ca2+]c. Dashed lines represent upper (yellow) or lower (gray) limits of Ca2+-uptake rate determinations.
In WT cells in the presence of CGP37157, mitochondrial Ca2+ uptake was negligible in response to Ca2+ additions that raised [Ca2+]c to 800 nM, such that the measured [Ca2+]c was approximately equal to that which had been added. Thus, gatekeeping was fully intact up to 800 nM [Ca2+]c (Figure 2C – black traces). Between 800 nM and 1.5 μM Ca2+c, very slow Ca2+ uptake reduced [Ca2+]c < 20% over the subsequent 300 sec. To quantify the [Ca2+]c threshold above which gatekeeping is relieved, the final [Ca2+]c at steady-state was plotted as a function of the initial [Ca2+]c after bolus addition. This relationship was approximately linear with a slope of ~1 for MCU_KO cells, as expected (Figure 2D and 2F). A plot for WT cells also yielded a slope of ~1 in the [Ca2+]c regime up to ~1 μM (Figure 2D), reflecting strong inhibition of MCU channel activity. In contrast, Ca2+ uptake in MICU1_KO cells was robust (Figure 2C – red traces), reflecting lack of gatekeeping, which reduced the steady-state post-pulse [Ca2+]c to below 150 nM (Figure 2C and 2D). Plots of final steady-state [Ca2+]c as a function of the initial [Ca2+]c had slopes of ~0 for both MICU1_KO and [MICU1_KO+MICU2] cells, demonstrating loss of gatekeeping in the absence of MICU1 (Figure 2D). In contrast, WT behavior was recapitulated in MICU1-rescue cells (Figure 2D).
Ca2+ boluses that elevated [Ca2+]c to between 2–10 μM activated Ca2+ uptake in WT cells, which rapidly reduced post-pulse [Ca2+]c to near the gatekeeping threshold of 1.2–1.5 μM within 2–3 minutes (Figures 2E – black traces). Plots of final steady-state [Ca2+]c as a function of the initial [Ca2+]c exhibited a slope of ~0 (no gatekeeping) above this [Ca2+]c threshold (Figure 2F). In contrast, in MICU1_KO cells (Figure 2E – red traces) as well as in MICU1_KO cells with MICU2 re-expressed, Ca2+ uptake reduced steady-state [Ca2+]c to below 150 nM. MICU1-rescue cells recapitulated WT behavior. These results suggest that MICU1-dependent MCU gatekeeping is relieved when [Ca2+]c exceeds a threshold of ~1 μM, but then becomes re-engaged following MCU activation when uptake reduces [Ca2+]c to 1–1.5 μM. Moreover, the transition of MCU from inactive to active states in WT cells is [Ca2+]c dependent, with MCU activity in WT cells surpassing the activity observed in MICU1_KO cells at [Ca2+]c > 5 μM (Figure 2E).
To gain insights into the mechanisms that underlie [Ca2+]c-dependent MCU activation, we measured uptake rates over a wide range of imposed [Ca2+]c. There was a non-zero Ca2+ uptake in MCU_KO cells that increased linearly with [Ca2+]c, mediated by an unknown MCU-independent mechanism. MCU was active in cells lacking MICU1 up to ~5 μM [Ca2+]c, with the uptake rate a linear function of initial [Ca2+]c (Figure 2G), suggesting that uptake in these cells is driven solely by the imposed [Ca2+] gradient across the IMM at constant ΔΨm. In contrast, Ca2+ uptake in WT and MICU1-rescue cells was suppressed relative to MICU1_KO cells until [Ca2+]c exceeded ~5 μM, but then increased with higher [Ca2+]c to rates exceeding those observed in MICU1_KO cells (Figure 2E and 2G). Accordingly, the relationship between the initial [Ca2+]c and rate of MCU-mediated Ca2+ uptake was non-linear (Figure 2G), indicating cooperativity in the transition from “gatekeeping on” to “gatekeeping off” states. This suggests that MICU1 contributes to cooperative activation of MCU, as suggested in some studies, although the cooperativity here did not require Mg2+ (Csordás et al, 2013).
The role of MICU1 in gatekeeping at low (< 1 μM) [Ca2+]c and activation at higher [Ca2+]c is more clearly seen in a logarithmic plot (Figure 2H). A slope of 1.4 was observed for cells lacking MICU1, whereas slopes of 3.1 and 2.5 were observed for WT and MICU1-rescue cells, respectively (Table S1). These findings demonstrate that, in addition to establishing a [Ca2+]c threshold below which MCU activity is suppressed, MICU1 is necessary for the cooperative [Ca2+]c-dependent activation of mitochondrial Ca2+ uptake once the threshold is exceeded.
MICU2 Interacts with MICU1 to Increase the [Ca2+]c Threshold and Reduce the Gain of Cooperative Activation of MCU Activity
MICU1 and MICU2 exist as a disulfide-linked hetero-dimer (Patron et al., 2014; Petrungaro et al., 2015). In non-reducing western blots, a single band with reactivity to both MICU1 and MICU2 antibodies was observed at ~95 kDa in WT cells, representing a MICU1/2 hetero-dimer (Figure S4A). MICU1 was detected as a homo-dimer at ~100 kDa in MICU2_KO cells (Figure S4A). MICU1 was also detected as a ~100 kDa band by co-immunoprecipitation with MCU (Figure S4B), suggesting that the MICU1-homodimer can interact with the MCU complex. In WT cells expressing V5-tagged MCU, MICU2 was co-immunoprecipitated with MCU, whereas MCU failed to pull down MICU2 in the absence of MICU1 (Figure S4C). Thus, MICU1 is required for interaction of MICU2 with the MCU complex, in agreement with previous studies (Patron et al., 2014; Kamer and Mootha, 2014; Petrungaro et al., 2015).
It has been proposed that MICU2 rather than MICU1 is responsible for inhibition of MCU activity in the low-[Ca2+]c regime (Patron et al., 2014). Two results argue against this: First, genetic deletion of MICU2, which did not reduce MICU1 expression (Figure 1E) or abolish interaction of MICU1 with MCU (Figure S4B), had no effect on gatekeeping in the 100–300 nM [Ca2+]c regime (Figure 3A) or on resting [Ca2+]m (Figure 3B and 3C). Second, re-expression of MICU2 in MICU1_KO cells (Figure 1E) failed to rescue loss of gatekeeping (Figure 1A and 3A) or restore [Ca2+]m (Figure 1C–1D and 3B–3C). Thus, MICU2 does not mediate MCU gatekeeping in the low-[Ca2+]c regime, and gatekeeping in MICU2_KO cells was mediated by MICU1 homo-dimers.
Figure 3. MICU1-MICU2 Hetero-dimers Increase the [Ca2+]c Threshold for MCU Activation.

(A) Initial rates of mitochondrial Ca2+ uptake in low [Ca2+]c (100–300 nM) revealed by inhibition of NCLX (as in Figure 1A and 1B). Each point represents an independent experiment (n = 5 for each condition). Bars: mean +/− SEM (* P < 0.05; ** P < 0.01; n.s, not different; Bonferroni’s multiple comparisons test).
(B) Basal mito-CAR-GECO1 fluorescence imaged at 20x magnification. Surface plots: relative fluorescence intensity histograms.
(C) [Ca2+]m calibrated from mito-CAR-GECO1 fluorescence (MICU2_KO: n = 8). Bars: mean [Ca2+]m +/− SEM. (*P < 0.05; **P < 0.01; n.s, not different; Bonferroni’s multiple comparisons test).
(D) Mitochondrial Ca2+ uptake in MICU2_KO cells in response to Ca2+ additions that elevated [Ca2+]c to 0.2–7 μM. Each color represents an independent experiment with a single Ca2+ bolus. Relative ΔΨm for each corresponding trace shown (inset).
(E–F) [Ca2+]c responses to bolus additions of Ca2+ to increase [Ca2+]c to 300–400 nM (E) or 2.5–3.5 μM (F). Representative traces shown from n > 2 independent replicates for each cell line.
(G) Steady-state [Ca2+]c 300 s after initiation of uptake, plotted as function of initial [Ca2+]c between 0.1 – 7 μM. [Ca2+]c achieves steady-state at ~500 nM in MICU2_KO cells compared with 1–1.5 μM in WT cells.
(H–I) Ca2+-uptake rates in response to acute challenge with [Ca2+]c between 0.1–9 μM. Each point represents an independent experiment. Solid lines: Hill-Equation (H) or linear (I) fits of Ca2+-uptake rate vs. [Ca2+]c plotted on linear (H) or log10 (I) scales. Activation of Ca2+ uptake in MICU2_KO cells exhibits similar cooperativity to WT cells, but entire curve is left-shifted.
(J–K) Simultaneous measurements of [Ca2+]c (J) and [Ca2+]m (K) in permeabilized cells in response to successive bolus additions of Ca2+ each increasing [Ca2+]c by 200 nM. Lines (dark colors) represent mean of n = 3 independent experiments with error bars (light colors) representing SEM. Concurrent decrease in [Ca2+]c and increase in [Ca2+]m is observed in MICU2_KO cells above ~400 nM [Ca2+]c.
To further examine the role of MICU2, we measured Ca2+ uptake and ΔΨm in cells challenged with boluses of Ca2+ between 100 nM and 10 μM (Figure 3D and S3). MICU2_KO cells exhibited strong gatekeeping at [Ca2+]c < 500 nM (Figure 3E). Remarkably, the Ca2+-uptake rate increased dramatically when [Ca2+]c was elevated further, exceeding that in WT and MICU1_KO cells (Figure 3F). This behavior was rescued by re-expression of MICU2-Flag. When final steady-state [Ca2+]c was plotted against initial [Ca2+]c, the slope of the line at [Ca2+]c < 500 nM was ~1 (gatekeeping on), but it decreased to a slope of ~0 at higher initial [Ca2+]c (gatekeeping off), to a final steady-state ~500 nM, a level between that observed in WT cells and MICU1_KO cells (Figure 3G). This suggests that MICU2 plays a role in tuning the MICU1-regulated MCU-gatekeeping threshold. To verify that the normal MCU-activation threshold of ~1.3 μM [Ca2+]c was indeed reduced to ~500 nM in MICU2_KO cells, we simultaneously measured Ca2+ clearance from the cytoplasm and uptake into the matrix in permeabilized cells. Below ~1 μM [Ca2+]c, small (~200 nM) Ca2+ pulses produced step-changes in [Ca2+]c and small or negligible changes in [Ca2+]m in WT and MCU_KO cells, respectively, whereas Ca2+ uptake (reduction in [Ca2+]c, Figure 3J), and concurrent increase in [Ca2+]m (Figure 3K) were observed in the MICU2_KO cells when [Ca2+]c reached ~500 nM.
Importantly, MCU-mediated Ca2+ uptake was greater in cells lacking MICU2 not only between 500 nM – 2 μM, but over the entire range of imposed [Ca2+]c, resulting in a markedly left-shifted curve of the [Ca2+]c-dependence of Ca2+ uptake (Figure 3H). Notably, however, the slope of the logarithmic plot was similar: 3.1 and 2.5 for WT and MICU2_KO cells, respectively (Figure 3I and Table S1). Both effects were rescued by re-expression of MICU2 (Figure 3H and 3I, Table S1), which had no effect on MICU1 levels (not shown). These results suggest that MICU2 plays two roles: First, it tunes the threshold for relief of MICU1-mediated gatekeeping in the low-[Ca2+]c regime. Second, it affects the gain of MCU activation, imposing a brake on the MICU1-mediated increase of MCU activity at higher [Ca2+]c by decreasing the apparent Ca2+ affinity of the activation mechanism without strongly affecting its cooperativity.
Cooperative Relief of Gatekeeping Requires Ca2+-Binding to EF-hands of Both MICU1 and MICU2
The ability of MICU1 and MICU2 to sense [Ca2+]c and regulate MCU activity has been attributed to the presence of two Ca2+-binding EF-hand domains in each protein. We investigated the roles of each EF hand in gatekeeping and cooperative activation, using expression constructs in which the EF hands were mutated to disrupt Ca2+ binding (Perocchi et al., 2010; Kamer and Mootha, 2014). MICU2 was stably expressed with each MICU1 EF-hand mutant in MICU1_KO cells to ensure similar expression of each protein. MICU1-Flag immunofluorescence confirmed that all cells in clonal populations uniformly expressed the mutant proteins (not shown) and total expression levels were verified by western blotting (Figure S5A). Whereas Ca2+ stabilizes MICU1-MICU2 hetero-dimers in vitro (Kamer et. al., 2017), in our clonal lines each EF-hand mutant formed proper MICU1/2 hetero-dimers (Figure S5A) that remained associated with MCU (Figure S5B). Upon inhibition of NCLX-mediated Ca2+ extrusion at low [Ca2+]c (< 300 nM), mitochondrial Ca2+ uptake was absent in MICU1-ΔEF1 and MICU1-ΔEF2 cells and very low (<0.1 ΔnM/sec) in -ΔEF1/2 cells (Figure 4A and 4B), indicating that Ca2+-binding to MICU1 EF-hands is not required for gatekeeping. In agreement, resting [Ca2+]m was unchanged in MICU1-ΔEF1, -ΔEF2 or -ΔEF1/2 cells (Figure S5E–F).
Figure 4. Ca2+ Binding to MICU1 EF-hands Promotes Cooperative Activation of MCU.

(A) Responses to CGP37157 (20 μM) in the low-[Ca2+] regime. Representative traces for each cell line (shown in B) for n ≥ 5 independent replicates. Like WT, MICU1 EF-hand mutants show negligible Ca2+ uptake.
(B) Quantification of Ca2+ uptake rates after inhibition of NCLX-mediated efflux for cells in (A). Each point represents an independent experiment (n = 5 for each condition). Bars: mean +/− SEM. (*P < 0.05; **P < 0.01; n.s, not different; Bonferroni’s multiple comparisons test). Mutation of MICU1 EF-hands does not affect gatekeeping at [Ca2+]c < 300 nM.
(C–E) [Ca2+]c for cells in (A, B) after bolus additions of Ca2+ to increase [Ca2+]c to 300–400 nM (C), 2.5–4 μM (D), or 7–9 μM (E). Representative traces shown from n ≥ 2 independent replicates for each cell line with similar peak [Ca2+]c after CaCl2 addition.
(F–G) Ca2+ uptake rate as a function of the peak [Ca2+]c after acute Ca2+ additions. Each point represents an independent experiment. Solid lines: Hill-Equation (F) or linear (G) fits of Ca2+-uptake rate vs. [Ca2+]c plotted on linear (F) or log10 (G) scales. MICU1 EF-hand mutants display loss of cooperative MCU activation.
When [Ca2+]c was elevated to levels that overcame gatekeeping in WT cells, Ca2+ uptake was remarkably reduced in all three MICU1 EF-hand mutant-cell lines, to an extent that no [Ca2+]c steady-state was reached during the subsequent 300 seconds (Figures 4C–4E). MCU activity was suppressed across the full range of [Ca2+]c tested (Figure 4F). Logarithmic plots showed loss of cooperativity in both individual EF-hand mutants as well as in the double mutant, with linear-fit slopes of 1.8, 1.8 and 1.4 respectively (Figure 4G and Table S1). These results indicate that Ca2+-binding to both EF hands of MICU1 is necessary for full cooperative-activation of MCU in response to elevated [Ca2+]c.
Similar experiments were performed using MICU2_KO cells in which MICU2 expression was rescued with -ΔEF1, -ΔEF2, or -ΔEF1/2 mutants. Expression of each mutant protein was uniform across the cell population, western blotting showed formation of MICU1/2 heterodimers (Figure S5C), and each EF-hand mutant associated with MCU (Figure S5D). MCU activity below 300 nM [Ca2+]c was negligible in MICU2-ΔEF1, -ΔEF2, and -ΔEF1/2 cells (Figure 5A–5C), indicating that MICU2 EF hands play no role in gatekeeping, consistent with the lack of effect of MICU2_KO on MCU activity in low (< 500 nM) [Ca2+]c. In contrast, mutation of either MICU2 EF hand had striking effects on Ca2+ uptake in the higher-[Ca2+]c regime. Nearly complete inhibition of MCU activity was observed in MICU2-ΔEF1 and -ΔEF1/2 cells even at [Ca2+]c up to 9 μM (Figure 5D–5E), and to a lesser extent in cells expressing MICU2-ΔEF2. This implicates MICU2 EF1 as a critical Ca2+-binding site required for relief of gatekeeping. Notably, cooperativity of MCU activation was completely lost in MICU2-ΔEF1 (slope = 1.6) and -ΔEF1/2 (slope = 1.2) cells, and to a lesser but significant extent in MICU2-ΔEF2 cells (slope = 2.0) (Figure 5F–5G, Table S1). Thus, within the context of the physiological MICU1/2 hetero-dimer, Ca2+ binding to EF hands in both MICU1 and MICU2 is required for cooperative activation of MCU by [Ca2+]c above the gatekeeping threshold.
Figure 5. Ca2+ Binding to MICU2 EF-hands Tunes MICU1-mediated Cooperative Activation of MCU.

(A) Responses to CGP37157 (20 μM) in low-[Ca2+] regime. Representative traces for each cell line (shown in B) from n ≥ 5 independent replicates.
(B) Quantification of Ca2+-uptake rates in response to CGP37157 for cells in (A). Each point represents an independent experiment (n = 5 for each condition). Bars: mean +/− SEM. (*P < 0.05; **P < 0.01; n.s, not different; Bonferroni’s multiple comparisons test). Absence of MICU2 or mutation of its EF-hands do not affect gatekeeping at [Ca2+]c < 300 nM.
(C–E) [Ca2+]c for cells in (A, B) after bolus additions of Ca2+ to increase [Ca2+]c to 300–500 nM (C), 3–4.5 μM (D), or 7–9 μM (E). Representative traces shown from n ≥ 2 independent replicates for each cell line with similar peak [Ca2+]c after CaCl2 addition.
(F–G) Ca2+ uptake rate as function of peak [Ca2+]c after acute Ca2+ additions. Each data point represents an independent experiment. Solid lines: Hill-Equation (F) or linear (G) fits of Ca2+-uptake rate vs. [Ca2+]c plotted on linear (F) or log10 (G) scales. MICU2 lowers the threshold for MICU1-mediated MCU activation, and Ca2+ binding to its EF-hands is required for cooperative MCU activation.
DISCUSSION
We have quantitatively described the roles of MICU1 and MICU2 in regulating MCU activity in situ over a full range of [Ca2+]c experienced by the channel under resting conditions and during agonist stimulation. We found that each protein plays important but distinct roles in both the inhibition of MCU-channel activity in the low-[Ca2+]c regime and in the highly-cooperative activation of the channel as [Ca2+]c is elevated. Our studies clarify the specific functions of each MICU protein in MCU gatekeeping, and highlight the requirement for Ca2+ binding to three or all four EF-hand domains in the MICU1/2 dimer to activate mitochondrial Ca2+ uptake.
MICU1 and MICU2 have Distinct Roles in MCU Inhibition
In the low-[Ca2+]c regime approximating resting-cytoplasmic conditions, MICU1, but not MICU2, plays a fundamental role in the suppression of MCU activity referred to as “gatekeeping”. In the absence of MICU1, MCU becomes constitutively active, in agreement with previous reports (Mallilankaraman et al., 2012; Csordás et al, 2013; Patron et al., 2014; Liu et al., 2016). Whereas some previous studies were confounded by reduced MICU2 expression in cells with MICU1 knocked-down or deleted, here we observed similar constitutive activity even when MICU2 was re-expressed to normal levels in MICU1_KO cells. Thus, MICU2 is not the dominant mechanism of gatekeeping as previously suggested (Patron et al., 2014). Constitutive MCU activity in MICU1_KO cells activates NCLX-mediated Ca2+ extrusion, but this is insufficient to defend normal resting [Ca2+]m. Thus, in the absence of MICU1, constitutive influx and efflux constitutes an ongoing Ca2+ cycling across the IMM that establishes a new, higher steady-state [Ca2+]m. These observations corroborate those in fibroblasts from patients with genetic defects in MICU1 that result in absence of MICU1 expression (Bhosale et al., 2017). Here, we have for the first time quantified the new steady-state [Ca2+]m in cells lacking MICU1. Perhaps surprisingly, resting [Ca2+]m was ~300–400 nM, which while elevated compared with ~100 nM in WT cells, is not excessively high, suggesting that mitochondria in MICU1_KO cells may not be as Ca2+ over-loaded as has been inferred (Mallilankaraman et al., 2012; Logan et al., 2013; Antony et al., 2016; Liu et al., 2016; Bhosale et al., 2017). Several mechanisms could account for why [Ca2+]m is not elevated to much higher levels. It is possible that NCLX-mediated Ca2+-extrusion can compensate for uninhibited influx through MCU, or that MCU is inhibited by elevated [Ca2+]m, limiting Ca2+ uptake. Indeed, [Ca2+]m regulates MCU Ca2+ currents with a biphasic [Ca2+]m dependence, with a peak-inhibition [Ca2+]m at ~400 nM (Vais et al., 2016), similar to the resting [Ca2+]m measured here in MICU1_KO cells. Measurements of [Ca2+]m may not reflect total matrix Ca2+ content. However, mitochondrial Ca2+ content in hepatocytes (Antony et al., 2016) and brains (Liu et al., 2016) of mice with MICU1 constitutively-deleted were not different or increased by only 50%, respectively, compared with normal cells. Nevertheless, pathogenesis in MICU1_KO animals is consistent with that expected from mitochondrial Ca2+ overload (Liu et al., 2016). The relatively modest matrix free-Ca2+ elevation under resting conditions may not be the (sole) cause of disease pathogenesis in animal models (Antony et al., 2016; Liu et al., 2016) and patients (Logan et al., 2013; Lewis-Smith et al., 2016; Bhosale et al., 2017). Rather, pathogenesis might be caused by sensitized gain-of-function responses to transient [Ca2+]c signals up to the normal threshold of ~1.3 μM.
We found that MICU2 is not required for channel gatekeeping. Deciphering its role has been complicated by the fact that it requires MICU1 for its association with MCU. Here we demonstrated that MICU2 deletion leaves channel inhibition intact, indicating that MICU1 homo-dimers are capable of inhibiting MCU-channel activity in low [Ca2+]c. Although MICU2 is dispensable for inhibition of MCU in the low-[Ca2+]c regime (50–500 nM), it nevertheless plays a role in regulating MICU1-mediated gatekeeping by tuning the normal threshold for relief of channel inhibition. Deletion of MICU2 lowered the [Ca2+]c threshold for relief of inhibition from ~1.3 μM in WT cells to ~500 nM. Thus, in the range of [Ca2+]c between 500 nM and ~1.5 μM, MICU2 plays a critical role by tuning the activity of MICU1 to inhibit MCU (Figure 6A). Under normal conditions with both MICU proteins present in a hetero-dimeric complex, the Ca2+-binding EF hands appear to play little or no role in MCU channel inhibition in the low-[Ca2+]c regime. Since mutation of EF hands did not affect hetero-dimer formation or association with MCU, MICU2 tunes the MICU1-mediated threshold for activation through distinct Ca2+-binding properties of MICU1 homo- vs. hetero-dimers. We previously observed loss of gatekeeping in cells with MICU2 deleted (Vais et al., 2016). However, those measurements used a low-affinity Ca2+ indicator (Fura-2FF; KD = 5.5 μM) that provided inaccurate measurements below 1 μM. By probing Ca2+ uptake using a high-affinity indicator (Fura-2, KD = 140 nM), we determined that the MICU1 homo-dimer inhibits MCU below ~500 nM [Ca2+]c. Lack of appreciation of this role of MICU2 and of the need to study its function under rigorously controlled and quantified [Ca2+]c probably accounts for previous discrepant results regarding its effects on gatekeeping (Patron et al., 2014; Kamer and Mootha, 2014; Vais et al., 2016).
Figure 6. Model for MICU1-MICU2 Regulation of MCU and the Role of MICU2 in Spatially Restricting Mitochondrial Ca2+-uptake.

(A) MICU2 tunes MCU activation by elevating the [Ca2+]c threshold for relief of MICU1-mediated inhibition of MCU.
(B) MICU2 tunes mitochondrial Ca2+ uptake by raising the [Ca2+]c threshold and reducing the gain of MICU1 activation of MCU.
(C) Ca2+ binding to 3–4 EF hands in the MICU1/2 hetero-dimer are required for MCU activation.
(D) MICU2 enforces tighter localization of Ca2+ crosstalk between ER and mitochondria. Assuming [Ca2+]ER = 300 μM, MCU channels associated with a MICU1/2 hetero-dimer must be located within 60 nm of the axis of an open InsP3R channel for cooperative activation and within 120 nm for the gatekeeping threshold-[Ca2+]c to be exceeded, whereas MCU associated with a MICU1 homo-dimer could be over 120 nm and 240 nm away, respectively.
(E–F) Simultaneous measurements of [Ca2+]c (E) and [Ca2+]m (F) in intact WT and MICU2_KO cells in response to 500 μM ATP. Traces representative of n = 5 independent experiments for each condition. MICU2_KO cells exhibit similar transient increase in [Ca2+]m to WT cells despite reduced global [Ca2+]c increase.
(G) Quantification of increase in [Ca2+]m at peak of the transient divided by mean increase in [Ca2+]c (Δ[Ca2+]m/Δ[Ca2+]c). Bars: mean +/− SEM. (P = 0.0004; Student’s t-test). A larger proportion of ER-released Ca2+ enters mitochondria in MICU2_KO cells.
MICU2 Sets the Gain of Cooperative Activation of MCU by MICU1
Activation of MCU is mediated by elevated [Ca2+]c with high cooperativity. As for channel inhibition in low [Ca2+]c, MICU1 plays a dominant role in channel activation. First, channel activation at [Ca2+]c > 5 μM is strongly reduced in cells lacking MICU1. This observation likely accounts for the initial (Perocchi et al., 2010) and subsequent (Csordás et al, 2013; Patron et al., 2014) conclusion that MICU1 mediates channel activation rather than inhibition, since those studies employed high-[Ca2+]c pulses where MICU1 is shown here to play an activating role. Second, cooperativity of channel activation is lost when MICU1 is absent. Third, [Ca2+]c-dependent MCU activation remains highly cooperative in cells with MICU2 deleted. Nevertheless, MICU2 profoundly influences Ca2+-dependent MCU activation. In its absence, activation by MICU1 homo-dimers remains highly cooperative, but the [Ca2+]c-dependence is shifted to much lower concentrations. Thus, a primary function of MICU2 is to set the gain of the cooperative mechanism of channel activation (Figure 6B). Cooperative channel-activation requires Ca2+ binding not only to each of the EF hands in MICU1, but also to those in MICU2. Mutation of EF1 in MICU2 had a more profound effect than mutation of EF2, which is interesting since MICU2 EF1 was implicated in Ca2+-induced MICU2 dimerization in vitro (Li et al., 2016). Thus, cooperativity of [Ca2+]c-dependent MCU activation derives from Ca2+ binding to three or all four EF hands in the MICU1/2 hetero-dimer (Figure 6C).
While this manuscript was in preparation, Kamer et al. (2017) demonstrated that recombinant truncated-MICU1 and full-length MICU2 form a hetero-dimer with high Ca2+ affinity (~650 nM). The apparent Ca2+ affinity of MICU1 was ~300–400 nM, whereas MICU2 had a lower affinity (~1 μM). These results are in good agreement with the apparent affinities of the full-length proteins in situ observed here. A MICU1 apparent-affinity of 300–400 nM is in good agreement with the 500-nM threshold we determined in cells lacking MICU2, and the lower Ca2+ affinity of the MICU1/2 dimer is consistent with the role of MICU2 determined here to raise the [Ca2+]c threshold and lower the apparent Ca2+ affinity of the MICU dimer.
The Cell Physiological Significance of MICU2
It is interesting to note that MICU1 alone is able to accomplish the same things as a MICU1/2 hetero-dimer. MICU1 homo-dimers associate with MCU and mediate channel inhibition in low [Ca2+]c and highly-cooperative activation at elevated [Ca2+]c. MICU2 does not form a homo-dimer, nor does it associate with MCU in the absence of MICU1. Although ratios of MICU1 and MICU2 mRNA levels vary among tissues, it is unknown if MICU1 homo-dimers exist in vertebrate tissues. Paillard et al. (2017) observed different MICU1/MCU expression ratios between cardiac myocytes and hepatocytes, and attributed different mitochondrial Ca2+-uptake properties between these tissues to altered MICU1/MCU ratios. However, the results, i.e. lower threshold and reduced gain in myocytes, could also be accounted for, at least in part, by different ratios of MICU1 homo- versus hetero-dimers, as shown here. It is interesting to consider the physiological implications of the evolution of the MICU1/2 hetero-dimer. Our studies suggest that the fundamental role of MICU2 is to reduce the apparent Ca2+ affinity of MICU1. In the low-[Ca2+]c regime, MICU2 raises the [Ca2+]c threshold for MCU activation from ~500 nM to ~1.3 μM. In the high-[Ca2+]c regime, MICU2 reduces the [Ca2+] sensitivity without affecting the cooperativity of channel activation, enabling strong channel-activation at [Ca2+]c > 4.5 μM compared with ~1.5 μM for MICU1 homo-dimers. In light of the requirement of Ca2+ binding to MICU2 EF hands for channel activation, it is notable that whereas the two MICU1 EF hands are canonical, those in MICU2 are not, with the normal glycines at position 6 replaced with glutamates. This may suggest that the MICU2 EF hands have a lower Ca2+-binding affinity, in agreement with recent measurements (Kamer et al., 2017), that within the context of the MICU1/2 hetero-dimer confers reduced [Ca2+]c-sensitivity.
The cell physiological implication of these effects of MICU2 may be to enforce a more-proximal physical localization between MCU and Ca2+ sources required for mitochondria to sense and take up Ca2+. Using the physiological Ca2+ current through a single open InsP3R Ca2+-release channel, we can compute the spatial profile of [Ca2+]c as a function of distance from the channel according to (Vais et al., 2010). Assuming moderate cytoplasmic buffering (between the values for high and low buffering in Vais et al.) and [Ca2+]ERlumen = 300 μM, modeling predicts that with a MICU1/2 hetero-dimer as part of the MCU complex, an MCU channel needs to be located within ~120 nm from the axis of a single open InsP3R channel for the inhibition threshold to be breached, enabling MCU activation. In contrast, an MCU channel associated with a MICU1 homo-dimer could be twice as far away and become activated (Figure 6D). Thus, the presence of MICU2 requires an MCU channel to be closer to an InsP3R to enable the gatekeeping threshold to be overcome. A MICU1/2 hetero-dimer strongly activates MCU channel activity when [Ca2+]c achieves ~4.5 μM, requiring that the MCU channel be within 60 nm of an InsP3R, whereas a MICU1 homo-dimer-activated MCU channel can be over twice as far away (Figure 6D). Again, the presence of MICU2 spatially restricts Ca2+ crosstalk between single InsP3R and MCU channels. It is predicted, therefore, that stimulation of InsP3-mediated Ca2+ release in cells lacking MICU2 would be associated with a larger proportion of released Ca2+ entering mitochondria.
To test this, we stimulated intact cells with an InsP3-mobilizing agonist and simultaneously measured [Ca2+]c and [Ca2+]m. Notably, the magnitude of the transient increase in global [Ca2+]c was suppressed in MICU2_KO cells compared with WT cells (Figure 6E) whereas the peak increase in [Ca2+]m was similar between the two (Figure 6F). While the most reasonable explanation for the diminished cytoplasmic response in the MICU2_KO cells is enhanced mitochondrial buffering, as predicted by our model, it is possible that it was due to clonal differences in, for example, expression of purinergic receptors. Nevertheless, similar mitochondrial Ca2+ uptake in WT and MICU2_KO cells despite much lower [Ca2+]c in the MICU2_KO cells (Figure 6G) is consistent with our prediction that more Ca2+ can be taken up by mitochondria lacking MICU2 because of a less stringent requirement for close spatial proximity between ER Ca2+ release sites and mitochondrial Ca2+ uptake sites (Figure 6D). Future studies are necessary to determine if indeed the evolutionary imperative for MICU2 is to promote a more strict spatial proximity or Ca2+ crosstalk between ER and mitochondria, and to determine its physiological rationale.
EXPERIMENTAL PROCEDURES
Cell Lines and cDNA Expression Constructs
All HEK-293T cell lines were grown in DMEM containing 10% fetal calf serum (FCS) and 1× anti-biotic/anti-mycotic (complete medium) at 37°C and 5% CO2. MCU_KO, MICU1_KO and MICU2_KO HEK-293T cells were a generous gift from Dr. Vamsi Mootha. See Supplementary Experimental Procedures for detailed information regarding generation of stable cells lines and constructs used.
Simultaneous Determination of Mitochondrial Ca2+ Uptake and Membrane Potential in Permeabilized Cells
Simultaneous measurement of mitochondrial Ca2+ uptake and IMM potential (ΔΨm) in permeabilized HEK-293T cells was performed as described (Mallilankaraman et al., 2012), with fluorescence measurements calibrated to represent bath [Ca2+]. For detailed information see Supplementary Experimental Procedures.
Quantitative Measurement of Basal [Ca2+]m
Basal [Ca2+]m was measured in HEK-293T cells transfected with a mitochondria-targeted version of the fluorescent calcium-indicator protein CAR-GECO1 (mito-CAR-GECO1). For detailed information see Supplementary Experimental Procedures.
Simultaneous Measurement of Cytoplasmic and Mitochondrial [Ca2+] in Response to ATP Stimulation
WT and MICU2_KO (HEK-293T), transiently transfected with mito-CAR-GECO1 48 hr prior to loading with 1 μM Fura-2 AM, For detailed information see Supplementary Experimental Procedures.
Statistical Analyses
Initial Ca2+ uptake rates in permeabilized cells were determined for each experiment using single-exponential fits from the time of CGP37157 or Ca2+ addition (t = 0 sec) to achievement of a new steady-state (t = 300 sec) to obtain parameters A (extent of uptake) and τ (time constant) (Igor 6 Pro). The instantaneous rate of uptake (R) at t = 0 is equal to the first derivative of the fit, and standard deviations (SD) of rates were calculated from standard deviations of A (SDA) and τ (SDτ) as follows:
Independent, normally-distributed rate measurements and mean resting [Ca2+]m from bulk-cell assays were analyzed using one-way ANOVA and Bonferroni’s multiple comparisons t-test. Only pairwise comparisons between WT and each cell line are shown for clarity. Whereas unequal variances between populations are evident, assumption of equal variances rendered it less likely to find significant differences. Western blot quantification of band intensity from n = 3 independent experiments and quantification of the increase in [Ca2+]m divided by the increase in [Ca2+]c (Δ[Ca2+]m/Δ[Ca2+]c) in agonist-stimulated intact cells display normal distributions and approximately equal variances, and were analyzed using Student’s t-test. All statistical tests were performed using GraphPad Prism 7.0. P-values < 0.05 (*) and < 0.01 (**) were considered statistically significant.
Supplementary Material
Acknowledgments
We thank Dr. Vamsi Mootha for providing MICU1_KO, MICU2_KO and MCU_KO cell lines. This work was supported by T32 HL 7954-16 (RP) and NIH R37 GM056238 (JKF).
Footnotes
Supplemental Information includes Supplemental Experimental Procedures and 8 figures and 1 table.
AUTHOR CONTRIBUTIONS
Conceptualization, R.P. and J.K.F.; Investigation, R.P., H.H. and A.R; Writing, R.P. and J.K.F. The authors declare no competing financial interests.
Publisher's Disclaimer: This is a PDF file of an unedited manuscript that has been accepted for publication. As a service to our customers we are providing this early version of the manuscript. The manuscript will undergo copyediting, typesetting, and review of the resulting proof before it is published in its final citable form. Please note that during the production process errors may be discovered which could affect the content, and all legal disclaimers that apply to the journal pertain.
References
- Antony AN, Paillard M, Moffat C, Juskeviciute E, Correnti J, Bolon B, Rubin E, Csordás G, Seifert EL, Hoek JB, Hajnóczky G. MICU1 regulation of mitochondrial Ca2+ uptake dictates survival and tissue regeneration. Nat Commun. 2016;7:10955. doi: 10.1038/ncomms10955. [DOI] [PMC free article] [PubMed] [Google Scholar]
- Baughman JM, Perocchi F, Girgis HS, Plovanich M, Belcher-Timme CA, Sancak Y, Bao XR, Strittmatter L, Goldberger O, Bogorad RL, et al. Integrative genomics identifies MCU as an essential component of the mitochondrial calcium uniporter. Nature. 2011;476:341–345. doi: 10.1038/nature10234. [DOI] [PMC free article] [PubMed] [Google Scholar]
- Bhosale G, Sharpe J, Koh A, Kouli A, Szabadkai G, Duchen MR. Pathological consequences of MICU1 mutations on mitochondrial calcium signalling and bioenergetics. Biochim Biophys Acta. 2017;1864:1009–1017. doi: 10.1016/j.bbamcr.2017.01.015. [DOI] [PMC free article] [PubMed] [Google Scholar]
- Csordás G, Golenár T, Seifert EL, Kamer KJ, Sancak Y, Perocchi F, Moffat C, Weaver D, de la Fuente Perez S, Bogorad R, et al. MICU1 controls both the threshold and cooperative activation of the mitochondrial Ca2+ uniporter. Cell Metab. 2013;17:976–987. doi: 10.1016/j.cmet.2013.04.020. [DOI] [PMC free article] [PubMed] [Google Scholar]
- De Stefani D, Raffaello A, Teardo E, Szabò I, Rizzuto R. A forty-kilodalton protein of the inner membrane is the mitochondrial calcium uniporter. Nature. 2011;476:336–340. doi: 10.1038/nature10230. [DOI] [PMC free article] [PubMed] [Google Scholar]
- Gunter KK, Gunter TE. Transport of calcium by mitochondria. J Bioenerg Biomembr. 1994;26:471–485. doi: 10.1007/BF00762732. [DOI] [PubMed] [Google Scholar]
- Hoffman NE, Chandramoorthy HC, Shamugapriya S, Zhang X, Rajan S, Mallilankaraman K, Gandhirajan RK, Vagnozzi RJ, Ferrer LM, Sreekrishnanilayam K, et al. MICU1 motifs define mitochondrial calcium uniporter binding and activity. Cell Rep. 2013;5:1576–1588. doi: 10.1016/j.celrep.2013.11.026. [DOI] [PMC free article] [PubMed] [Google Scholar]
- Kamer KJ, Mootha VK. MICU1 and MICU2 play nonredundant roles in the regulation of the mitochondrial calcium uniporter. EMBO Rep. 2014;15:299–307. doi: 10.1002/embr.201337946. [DOI] [PMC free article] [PubMed] [Google Scholar]
- Kamer KJ, Grabarek Z, Mootha VK. High-affinity cooperative Ca2+ binding by MICU1-MICU2 serves as an on-off switch for the uniporter. EMBO Rep. 2017:e201643748. doi: 10.15252/embr.201643748. [DOI] [PMC free article] [PubMed] [Google Scholar]
- Kirichok Y, Krapivinsky G, Clapham DE. The mitochondrial calcium uniporter is a highly selective ion channel. Nature. 2004;427:360–364. doi: 10.1038/nature02246. [DOI] [PubMed] [Google Scholar]
- Lewis-Smith D, Kamer KJ, Griffin H, Childs A-M, Pysden K, Titov D, Duff J, Pyle A, Taylor RW, Yu-Wai-Man, et al. Homozygous deletion in MICU1 presenting with fatigue and lethargy in childhood. Neurol Genet. 2016;2:e59. doi: 10.1212/NXG.0000000000000059. [DOI] [PMC free article] [PubMed] [Google Scholar]
- Li D, Wu W, Pei H, Wei Q, Yang Q, Zheng J, Jia Z. Expression and preliminary characterization of human MICU2. Biol Open. 2016;5:962–969. doi: 10.1242/bio.018572. [DOI] [PMC free article] [PubMed] [Google Scholar]
- Liu JC, Liu J, Holmström KM, Menazza S, Parks RJ, Fergusson MM, Yu ZX, Springer DA, Halsey C, Liu, et al. MICU1 serves as a molecular gatekeeper to prevent in vivo mitochondrial calcium overload. Cell Rep. 2016;16:1561–1573. doi: 10.1016/j.celrep.2016.07.011. [DOI] [PMC free article] [PubMed] [Google Scholar]
- Logan CV, Szabadkai G, Sharpe JA, Parry DA, Torelli S, Childs AM, Kriek M, Phadke R, Johnson CA, Roberts NY, et al. Loss-of-function mutations in MICU1 cause a brain and muscle disorder linked to primary alterations in mitochondrial calcium signaling. Nature. 2013;46:188–193. doi: 10.1038/ng.2851. [DOI] [PubMed] [Google Scholar]
- Mallilankaraman K, Cárdenas C, Doonan PJ, Chandramoorthy HC, Irrinki KM, Golenár T, Csordàs G, Madireddi P, Yang J, Müller M, et al. MCUR1 is an essential component of mitochondrial Ca2+ uptake that regulates cellular metabolism. Nat Cell Biol. 2012;14:1336–1343. doi: 10.1038/ncb2622. [DOI] [PMC free article] [PubMed] [Google Scholar]
- Mallilankaraman K, Doonan P, Cárdenas C, Chandramoorthy HC, Müller M, Miller R, Hoffman NE, Gandhirajan RK, Molgó J, Birnbaum MJ, et al. MICU1 is an essential gatekeeper for MCU-mediated mitochondrial Ca2+ uptake that regulates cell survival. Cell. 2012;151:630–644. doi: 10.1016/j.cell.2012.10.011. [DOI] [PMC free article] [PubMed] [Google Scholar]
- Matesanz-Isabel J, Arias-del-Val J, Alvarez-Illera P, Fonteriz RI, Montero M, Alvarez J. Functional roles of MICU1 and MICU2 in mitochondrial Ca2+ uptake. Biochim. Biophys. Acta. 2016;1858:1110–1117. doi: 10.1016/j.bbamem.2016.02.022. [DOI] [PubMed] [Google Scholar]
- Paillard M, Csordás G, Szanda G, Golenár T, Debattisti V, Brtok A, Wang N, Moffat C, Seifert EL, Spät A, Hajnóczky G. Tissue-specific mitochondrial decoding of cytoplasmic Ca2+ signals is controlled by the stoichiometry of MICU1/2 and MCU. Cell Rep. 2017;18:2291–2300. doi: 10.1016/j.celrep.2017.02.032. [DOI] [PMC free article] [PubMed] [Google Scholar]
- Palty R, Silverman WF, Hershfinkel M, Caporale T, Sensi SL, Parnis J, Nolte C, Fishman D, Shoshan-Barmatz V, Herrmann, et al. NCLX is an essential component of mitochondrial Na+/Ca2+ exchange. Proc Natl Acad Sci USA. 2010;107:436–441. doi: 10.1073/pnas.0908099107. [DOI] [PMC free article] [PubMed] [Google Scholar]
- Patron M, Checchetto V, Raffaello A, Teardo E, Vecellio Reane D, Mantoan M, Granatiero V, Szabó I, De Stefani D, Rizzuto R. MICU1 and MICU2 finely tune the mitochondrial Ca2+ uniporter by exerting opposite effects on MCU activity. Mol. Cell. 2014;53:726–737. doi: 10.1016/j.molcel.2014.01.013. [DOI] [PMC free article] [PubMed] [Google Scholar]
- Perocchi F, Gohil VM, Girgis HS, Bao XR, McCombs JE, Palmer AE, Mootha VK. MICU1 encodes a mitochondrial EF hand protein required for Ca2+ uptake. Nature. 2010;467:291–296. doi: 10.1038/nature09358. [DOI] [PMC free article] [PubMed] [Google Scholar]
- Petrungaro C, Zimmermann KM, Küttner V, Fischer M, Dengjel J, Bogeski I, Riemer J. The Ca2+-dependent release of the Mia40-induced MICU1-MICU2 dimer from MCU regulates mitochondrial Ca2+ uptake. Cell Metab. 2015;22:721–733. doi: 10.1016/j.cmet.2015.08.019. [DOI] [PubMed] [Google Scholar]
- Plovanich M, Bogorad RL, Sancak Y, Kamer KJ, Strittmatter L, Li AA, Girgis HS, Kuchimanchi S, De Groot J, Speciner L, et al. MICU2, a paralog of MICU1, resides within the mitochondrial uniporter complex to regulate calcium handling. PLoS ONE. 2013;8:e55785. doi: 10.1371/journal.pone.0055785. [DOI] [PMC free article] [PubMed] [Google Scholar]
- Sancak Y, Markhard AL, Kitami T, Kovacs-Bogdan E, Kamer KJ, Udeshi ND, Carr SA, Chaudhuri D, Clapham DE, Li AA, et al. EMRE is an essential component of the mitochondrial calcium uniporter complex. Science. 2013;342:1379–1382. doi: 10.1126/science.1242993. [DOI] [PMC free article] [PubMed] [Google Scholar]
- Tsai MF, Phillips CB, Ranaghan M, Tsai CW, Wu Y, Willliams C, Miller C. Dual functions of a small regulatory subunit in the mitochondrial calcium uniporter complex. eLife. 2016;5:e15545. doi: 10.7554/eLife.15545. [DOI] [PMC free article] [PubMed] [Google Scholar]
- Vais H, Foskett JK, Mak DOD. Unitary Ca2+ current through recombinant type 3 InsP3 receptor channels under physiological ionic conditions. J Gen Physiol. 2010;136:687–700. doi: 10.1085/jgp.201010513. [DOI] [PMC free article] [PubMed] [Google Scholar]
- Vais H, Mallilankaraman K, Mak DOD, Hoff H, Payne R, Tanis JE, Foskett JK. EMRE is a matrix Ca2+ sensor that governs gatekeeping of the mitochondrial Ca2+ uniporter. Cell Rep. 2016;14:403–410. doi: 10.1016/j.celrep.2015.12.054. [DOI] [PMC free article] [PubMed] [Google Scholar]
- Wu J, Liu L, Matsuda T, Zhao Y, Rebane A, Drobizhev M, Chang Y-F, Araki S, Arai Y, March K, et al. Improved orange and red Ca2+ indicators and photophysical considerations for optogenetic applications. ACS Chem Neurosci. 2013;4:963–972. doi: 10.1021/cn400012b. [DOI] [PMC free article] [PubMed] [Google Scholar]
Associated Data
This section collects any data citations, data availability statements, or supplementary materials included in this article.