

Abstract
UCSF ChimeraX is next‐generation software for the visualization and analysis of molecular structures, density maps, 3D microscopy, and associated data. It addresses challenges in the size, scope, and disparate types of data attendant with cutting‐edge experimental methods, while providing advanced options for high‐quality rendering (interactive ambient occlusion, reliable molecular surface calculations, etc.) and professional approaches to software design and distribution. This article highlights some specific advances in the areas of visualization and usability, performance, and extensibility. ChimeraX is free for noncommercial use and is available from http://www.rbvi.ucsf.edu/chimerax/ for Windows, Mac, and Linux.
Keywords: interactive molecular graphics, biomolecular visualization and analysis, density maps, structural biology, light‐sheet microscopy, integrative hybrid modeling, large‐scale data, virtual reality
Introduction
Over the past few decades, molecular graphics has moved from the purview of structural biologists into the realm of many life scientists. Originally developed to visualize, interpret, and manipulate only atomic‐scale data, molecular modeling is now also used for presentation, education, and computational studies of molecules, macromolecular assemblies, and even larger‐scale data such as from optical microscopy. In recent years, several factors have also greatly affected the development of modeling applications: the rapid increase in size of data sets, the proliferation of web resources, and the rise of parallel computing using commodity hardware.1
In the early stages of molecular graphics systems, the largest data sets that could be visualized interactively were single molecules, perhaps with density maps from X‐ray crystallography. Data size has grown rapidly as new experimental methods have been developed. Cryo‐electron microscopy (cryoEM) has produced electric potential2 (more commonly referred to as density) maps for larger molecules and assemblies.3, 4 As microscopy resolution improves, more and more data sets of varying scales (atomic, molecular, even cellular) have become available. Recent advances in lattice light‐sheet microscopy have enabled the imaging of whole cells at high spatiotemporal (4D) resolution.5 Computational methods have also contributed to the growth. For example, molecular dynamics time series may contain many thousands of coordinate sets, and integrative hybrid modeling6 produces large ensembles of candidate structures. In our experience, no current molecular modeling package handles all of these new and large data types gracefully, generally because the programs were designed for the types of data available when they were first implemented.
In parallel to the growth in data types, the number of web resources, both databases and computational services, has increased steadily as well.7, 8, 9 While the Worldwide Protein Data Bank (wwPDB)10 is still the leading repository for experimentally solved atomic structures, many other repositories are of interest to researchers: ModBase11 for predicted atomic structures; EMDB12 for electron microscopy maps; and sequence and domain databases including UniProt,13 Pfam,14 CATH,15 SCOP,16 and those from NCBI,17, 18 to name just a few. Computational services are also numerous, yet often each requires its own access method and offers data or results in its own format.
In response to these many advances, we are developing a next‐generation interactive molecular graphics system, UCSF ChimeraX. ChimeraX builds on our highly successful UCSF Chimera visualization system,19, 20, 21, 22 which was first released in 2002 and has been cited by over 11,800 journal articles, downloaded over 620,000 times, and has over 22,200 registered users (even though registration is voluntary and does not affect program functionality). Our goal for ChimeraX is to provide an integrated multiscale modeling environment that enables researchers to interactively access, visualize, and analyze structural data of varying resolution on scales ranging from atomic to cellular. Other types of data, such as protein sequences and hybrid‐modeling restraints, may be displayed and analyzed using integrated tools that link the disparate data types. ChimeraX is built using standard software toolkits that utilize advanced Graphics Processing Unit (GPU) capabilities and the parallel computing capabilities of modern hardware. For interacting with external resources, we provide standardized application programming interfaces (APIs) for (1) creating and accessing visualization data; (2) network communications with databases and web services; and (3) inter‐process communications to coordinate with other interactive applications in the environment.
This article is not a comprehensive survey of the available features. ChimeraX includes many capabilities common to molecular modeling applications, such as superposition, calculations, and measurements, multiple display styles, and creating high‐resolution images and movies, that will not be described in detail here. ChimeraX will continue to build upon the strengths of Chimera in areas like interactive fitting to density, map processing, structure analysis, and sequence‐structure crosstalk. For example, it includes commands and graphical interfaces similar to those in Chimera for working with “volume” data (density maps, potential maps, 3D imaging) and volume time series. At the same time, ChimeraX incorporates novel algorithms and previously unavailable features, some of which are highlighted below. Further, ChimeraX is in early development and its capabilities will continue to grow throughout time. Below, we highlight ChimeraX features in three general areas: visualization and usability, performance and scalability, and extensibility with plug‐ins.
Visualization and Usability
The first broad section covers ChimeraX advances in the 3D visualization of structures and other data, crosstalk between 3D data and 2D representations such as plots, and other aspects of the graphical interface. Except where noted otherwise, the features described are included in a ChimeraX download.
Interactive ambient occlusion and other lighting modes
ChimeraX has two directional lights, key and fill, plus ambient lighting. The key light is typically the dominant source of directional light and can cast shadows; the fill light serves as a secondary directional source to brighten regions that would otherwise be dark. The ambient lighting is an approximation to omnidirectional illumination. Shadows cast from a sufficient number of uniformly distributed directions give the effect of ambient shadowing, or ambient occlusion. Ambient occlusion can improve depth perception dramatically by providing a more realistic representation of an object's appearance in surrounding light (e.g., the third and fourth columns in Fig. 1).
Figure 1.
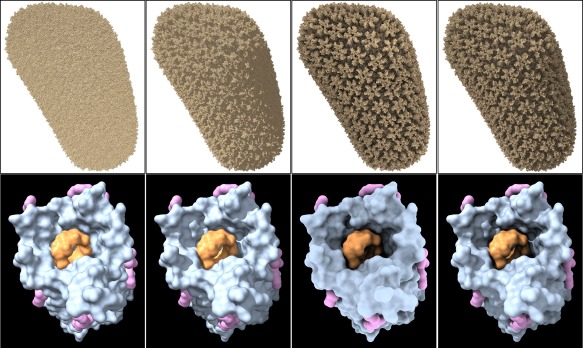
ChimeraX lighting modes. HIV‐1 capsid (PDBid: 3j3q) as all atoms (top row) and cyclodextrin‐admitting outer membrane protein (PDBid: 4d5d) chain A as molecular surfaces (bottom row) in different lighting modes, from left to right: (1) simple lighting, with key, fill, and ambient lights, but no shadows; (2) simple lighting plus directional shadows; (3) ambient occlusion (ambient‐only light, ambient shadowing from 64 directions); (4) full lighting, with key, fill, and ambient lights, directional shadows, and ambient shadowing.
The pioneering application for ambient‐occlusion molecular rendering, QuteMol,23 has many attractive rendering styles; however, it is somewhat limited in options for representation (no ribbons or molecular surfaces), coloring, and data types handled (no density maps or mmCIF input), and is not intended for broader structural analysis. The VMD package24 has a built‐in ray tracer with ambient occlusion rendering, but GPU acceleration for interactivity requires an NVIDIA GPU that supports CUDA. Video games generally use screen‐space ambient occlusion, which is fast enough to accommodate rapid changes in a scene, but prone to artifacts since it uses only the depths of nearby points in rendered views. The screen‐space method has also been implemented for biomolecular visualization, with related enhancements.25
ChimeraX makes interactive, high‐quality ambient‐occlusion rendering generally available, “interactive” meaning fast enough to update in real time as objects are repositioned, and “generally available” meaning fully operational on standard Windows, Mac, and Linux desktop and laptop computers from the last two or three years. No special‐purpose hardware or setup is required. ChimeraX approximates ambient occlusion with shadows from an adjustable number of directions, typically 64, but up to 1024 are permitted. A disadvantage of this approach is that it can be slow (at least compared to screen‐space ambient occlusion) to recompute shadows when models change shape, for example, as conformational changes occur.
Further ChimeraX settings allow tuning ambient occlusion to emphasize larger or smaller features. ChimeraX can use any combination of ambient lighting, ambient occlusion, directional lights, and directional shadows (Figs. 1 and 2).
Figure 2.

Silhouettes and flat lighting. Nucleosome (PDBid: 5jrg) with DNA as molecular surfaces and histone proteins as helix‐tube cartoons, left: simple lighting with silhouettes; right: flat (ambient‐only) lighting with silhouettes.
Individual lighting parameters, including directions and colors, are fully adjustable from the command line. For convenience, however, a few useful combinations are defined as “presets” and made available as single‐click icons in a toolbar. Additional icons simply toggle specific visual effects such as silhouettes, outlines that emphasize borders and discontinuities (Fig. 2), and whether to show directional shadows. Clicking an icon echoes the corresponding command to the Log with a link to its help page, which facilitates learning the command and makes it easy to discover more options.
Molecular surfaces
We have developed a new grid‐based calculation of solvent‐excluded molecular surfaces26 applicable to atomic models of any size. A solvent‐excluded surface is the boundary of the set of points covered by a probe sphere at all positions where it does not intersect atoms of a molecule. A probe radius of 1.4 Å approximates the size of a water molecule. Analytical methods27 can calculate this surface by rolling the probe in contact with the atom spheres, but can fail for large structures (> 10,000 atoms) due to unusual geometries that are not handled by the complex code. The grid method in ChimeraX works for structures of any size and produces a high‐quality appearance (e.g., Fig. 1 bottom row) with the same calculation speed as analytical methods. Separate surfaces are computed for each protein or nucleic‐acid chain in a molecular assembly, and multiple execution threads are used to compute the surfaces in parallel.
Lower‐resolution surfaces can be computed by adding Gaussians centered at each atom and taking a contour surface of the resulting density map (Fig. 3). This allows making surfaces at a specified resolution and is useful to depict the overall architecture of large complexes such as virus capsids. For structures with symmetry, the surface of a single asymmetric unit can be drawn at all symmetry‐equivalent locations to speed up calculation and display.
Figure 3.
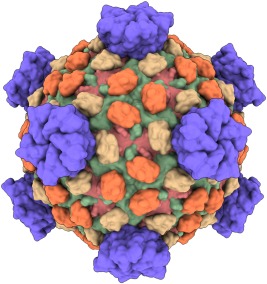
Low‐resolution surfaces. Reovirus capsid proteins (PDBid: 1ej6) shown with 15‐Å‐resolution Gaussian surfaces.
Macromolecular interfaces can be quantified with buried solvent‐accessible surface areas. ChimeraX uses an analytical calculation of solvent‐accessible surface area, the area of the surface traced by the center of the probe sphere in contact with atoms, or equivalently the area of the union of atom spheres with their radii increased by the probe radius. The analytical method calculates the surface area without generating a representation of the surface, so that hundreds of pairwise protein–protein contact areas can be evaluated for a large complex in seconds [e.g., to generate the plot in Fig. 4(B)].
Figure 4.

Contact plot. (A) CRISPR molecular assembly, two copies in the asymmetric unit of X‐ray structure (PDBid: 5cd4). (B) Schematic showing contacts between chains. (C) Interface between RNA (blue) and one CasC protein shown as solvent‐excluded surface (white) with colored contact residues. (D) Residue schematic of RNA/CasC interface.
Molecular surfaces can be colored to match the colors of nearby atoms. A new capability cuts the triangles making up surfaces exactly along the boundary lines between atoms to produce precise color transitions [e.g., Fig. 4(C)]. The boundaries are visually simpler than the saw‐tooth and irregular blended colors that result from not applying this triangle‐division technique.
2D plots that interact with 3D graphics
The value of 2D graphics such as scatter plots, histograms, curves, and network schematics is greatly enhanced when they are coupled to 3D structure views. For example, ChimeraX contact graphs enable efficient exploration of the interfaces in complexes (Fig. 4). A 2D contact plot is a network in which each protein or nucleic‐acid chain in an assembly is shown as a node with size (area) proportional to the surface area of that chain [Fig. 4(B)]. Lines (edges) connect nodes and represent chain contacts, with solid and dotted lines representing larger and smaller buried areas. A force‐based layout algorithm causes larger buried areas to pull the corresponding nodes closer to each other. Each node context menu allows displaying in 3D just that chain and those in contact with it, or moving the contacting chains apart radially. Each edge context menu allows zooming the 3D view to show the interface between the two chains face‐on [Fig. 4(C)], or plotting the interface residues as a 2D projection [Fig. 4(D), compare to the 3D view in Fig. 4(C)].
The extensive capabilities of the Python matplotlib package allow tools to easily create standard plots such as histograms. As an example, the ChimeraX crosslinks tool displays a histogram of the distances between residues of the nuclear pore subcomplex nup84 that have been chemically crosslinked28 (Fig. 5). Crosslinks can be loaded and displayed as dashed lines by opening an integrative hybrid model file (see https://pdb-dev.rcsb.rutgers.edu/). Hovering the cursor over a bar in the crosslink length histogram highlights the associated crosslinks and can be used to explore ones that are excessively long in the structural model. Hybrid modeling techniques6 can produce ensembles of thousands of structures, and the distribution of lengths of an individual crosslink across such an ensemble can also be shown as a histogram. Hovering the cursor over a bar in that histogram instantly shows a representative model in which the crosslink has the given length.
Figure 5.
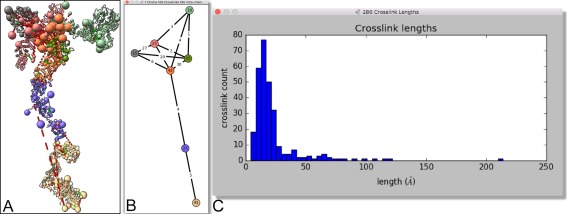
Chemical crosslink plots. (A) Integrative hybrid model of nuclear pore subcomplex nup84 with crosslinks shown as dashed lines. (B) Schematic showing numbers of inter‐ and intra‐protein crosslinks. (C) Histogram of crosslink lengths.
In addition to network diagrams and 2D plots implemented within the program, ChimeraX can integrate with external packages for more sophisticated analyses. For example, the ChimeraX cytoscape tool (available from the Toolshed, see below) interfaces with the widely used network visualization and analysis package Cytoscape.29, 30 The stringdb tool, also available from the Toolshed, finds known protein–protein interactions in the String database31 for a PDB structure open in ChimeraX and uses the cytoscape tool to load those interactions into Cytoscape (Fig. 6). Selections in Cytoscape are reflected in ChimeraX.
Figure 6.
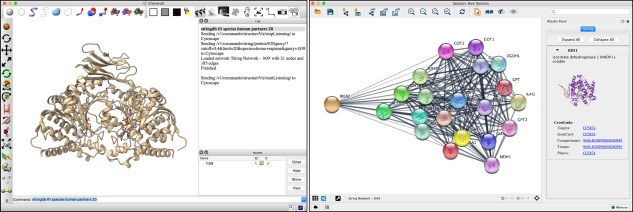
Results of executing the ChimeraX stringdb tool to find protein–protein interaction partners for IDH1 (PDBid: 1t09) and display them in Cytoscape.
New algorithms for ribbons and helix cylinders
Ribbon diagrams32, 33 (also called cartoons) are often used to depict the overall structures of proteins and nucleic acids. ChimeraX provides a smooth ribbon representation using natural cubic splines that pass through backbone atom positions. The splines are further smoothed for a more aesthetic presentation. For example, strands in protein β‐sheets normally have a wavy appearance; ChimeraX, by default, flattens the ribbon of a strand to appear more as a smooth plane (Fig. 7). There may be a gap between the smoothed ribbon and an α‐carbon, which is addressed by displaying a “tether” (a translucent cone) from the ribbon to the atom (Fig. 7). However, the user can turn off smoothing for any specified residues where tethers are not desired.
Figure 7.
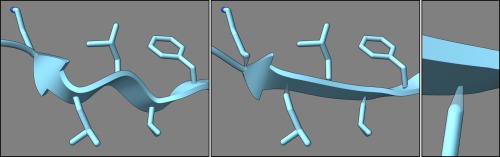
Ribbon and side chains of a β‐strand in chemoreceptor protein (PDBid: 2gbp), from left to right: unsmoothed, smoothed with tethers, tether closeup.
Cylinders are another graphical representation for protein helices. However, since many helices are curved, a straight cylinder may not capture the true geometric nature of a helix. ChimeraX can approximate helices as curved cylinders or tubes along circular arcs (Fig. 2) using algorithms similar to HELANAL.34
Modern windowing system
The ChimeraX user interface is implemented in Qt,35 a well‐supported cross‐platform windowing system with a wealth of functionality. Qt offers a native‐like look and feel on each platform, and allows ChimeraX to offer:
-
3D graphics windows. While displaying 3D graphics is obviously crucial to the central window, 3D graphics can be shown in any of the ChimeraX windows. The “Side View” tool, for instance, uses a 3D window to show the current scene from the side, with the movable clipping planes depicted as vertical lines that can be dragged (Fig. 8, bottom right).
Figure 8.
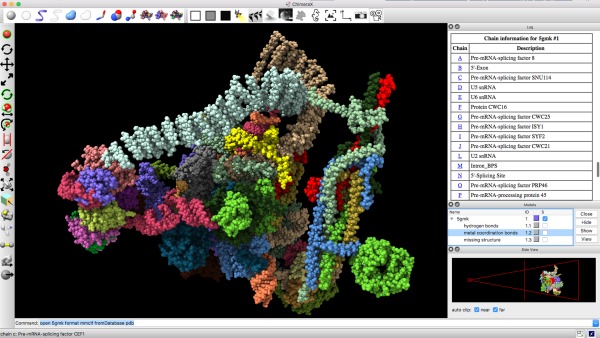 Typical ChimeraX window, with structure (PDBid: 5gmk) in the main 3D display. Toolbars lie across the top and along the left, command and status lines across the bottom. Along the right are three docked tool windows, from top to bottom: Log, Models, and Side View. The Log is showing an HTML table containing chain information, where the chain letters are clickable links that will bring up the sequences of those chains. The Side View contains its own 3D depiction of the structure from the side.
 Full‐featured HTML support. ChimeraX can render hypertext using the full HTML feature set, including Cascading Style Sheets, tables, and embedded images and videos. The built‐in browser is described in the next section, but other ChimeraX windows also employ this capability. For example, instead of the main graphics window, a first‐time ChimeraX user will initially see an HTML window with a welcome banner and a link to quick‐start documentation. A repeat user will see images and names of recently used files, which can be clicked to open the files.
Dockable windows. The various tool windows created by ChimeraX can be “docked” into the main window to create a combined interface (Fig. 8). The window of a tool can be docked onto any side of the main window, and can even be dropped onto an existing tool window, in which case a tabbed interface to switch between them will be created. Once tool windows are docked, the partitions between them can be dragged to adjust their sizes. Conversely, tool windows can be dragged out to create stand‐alone windows. The initial docked/undocked state of the window is under control of the tool creating the window.
Toolbars. Several toolbars are displayed around the ChimeraX main window, with icons to perform various common functions quickly and easily, with a single click. To facilitate learning, the corresponding commands appear in the Log when an icon is clicked.
ChimeraX browser and command‐execution links
ChimeraX includes a built‐in HTML browser, enabled by the support in Qt mentioned above. An important advantage of this browser is that it provides a simple mechanism to execute ChimeraX commands by clicking special links, for example:
<a href=“cxcmd:open 5e7w”>human insulin</a>
where the text “human insulin” appears as a link in the browser, and clicking it would execute the command “open 5e7w” in ChimeraX.
With this mechanism, it is easy to create web pages that use ChimeraX interactively for structure display and other features, as in a scientific presentation or a ChimeraX tutorial. Since the mechanism only works in the built‐in browser, however, ChimeraX must already be installed and used to open the web page. (A warning message can be displayed when the page is being viewed in some other browser.) The Quick Start Guide (http://www.rbvi.ucsf.edu/chimerax/docs/quickstart /) includes many examples of command‐execution links.
The built‐in browser serves as an integrated viewer of the ChimeraX User Guide, which can be opened from the Help menu and browsed top‐down. Alternatively, individual help pages can be invoked with the “help” command, tool context menus, or links in the Log. The browser starts as a separate window, although it can be docked.
The User Guide can also be viewed in other web browsers, and conversely, web pages in general can be viewed in the ChimeraX browser. Arbitrary HTML files and other web content can be opened from within ChimeraX by specifying a URL or a local filename with the “open” command.
Besides the browser, other tool windows may contain HTML with or without the special links. For example, the Log echoes each command as a (standard) link to the help page for that command. Figure 8 includes an example of command‐execution links in the Log.
Support for virtual‐reality headsets
Consumer virtual‐reality (VR) headsets such as the HTC Vive and Oculus Rift enable stereoscopic 360° viewing of molecular and cellular data. ChimeraX supports headsets using the OpenVR toolkit. A user can walk within scenes to view molecular structures, density maps, and microscopy data from any position, as well as scale and reposition the objects with hand controllers such as the Vive's “hand wands” that incorporate position/orientation sensors, trigger switches, and a touchpad. Since the immersive headsets completely fill the field of view, it is difficult to use a traditional mouse and keyboard for input. We are developing alternative user interfaces such as icon panels in the immersive view (Fig. 9) to perform actions and to choose hand‐controller modes.
Figure 9.
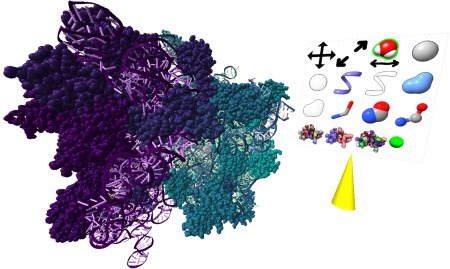
Virtual‐reality view of molecular structure. Dual with hand controllers (not shown) are used to rotate and scale the image or to position a pointer (yellow cone) to select icons for controlling display styles and colors.
Virtual‐reality visualization poses more severe demands on graphics rendering speed than does viewing on a desktop display. To avoid flickering in the headset, which can induce nausea, it is essential to maintain rendering at 90 frames per second, the refresh rate of current VR devices. The current headset displays have resolutions comparable to desktop displays at 2560 by 1440 pixels, and left‐ and right‐eye images are rendered at even higher resolutions to allow for warping to correct for lens distortions. Thus approximately 10 times more rendering speed is needed compared to using desktop displays, limiting the complexity of the data that can be viewed. With current high‐end video graphics such as the NVIDIA Geforce GTX 1080, our implementation renders fast enough for immersive viewing of the E. coli large ribosomal unit (Fig. 9, PDBid: 4v7s showing all 89,372 atoms of protein and ribbons for 8993 residues of RNA).
We are developing hand‐controller actions to use headsets to build atomic models into high‐resolution (3‐Å) electron microscopy maps, where human judgment is often needed to fix problems in side chain placement. Side chains can be grabbed and reoriented in the displayed density, with molecular dynamics flexible fitting then optimizing the positions. The better perception of depth and the local environment in the immersive view allows efficiently moving through a structure and making corrections without the clipping required to perform similar work on traditional computer displays. Interactive refinement with flexible fitting, which can be used with or without VR, is part of the ISOLDE (Interactive Structure Optimization by Local Direct Exploration)36 plugin developed by Tristan Croll. ISOLDE is available from the ChimeraX Toolshed, which is described in the Software Extensibility section below.
Interactive structure analysis is possible with VR headsets driven by a high‐end desktop or laptop computer. Another class of VR headsets utilizes a cell phone as the display. Because of the reduced graphics capabilities of current cell phones, these devices are primarily useful for viewing pre‐recorded scenes. ChimeraX can generate 360° stereoscopic movies or stationary molecular and cellular scenes at the required high resolutions (typically 4096 by 4096 pixels). The output uses the standard equirectangular encoding format where the horizontal axis covers 360° of longitude and the vertical axis covers 180° of latitude. Left‐ and right‐eye views are stacked to produce the top‐bottom stereoscopic format accepted by video‐sharing sites such as YouTube.
Performance
ChimeraX is designed to respond to the rapid increase in both the number of large data sets as well as the sheer size of data sets. Prior to 2014, there were five entries (of 95,754 or 0.005%) in the PDB with 100,000 or more atoms; as of April 2017, there were 537 (of 129,177 or 0.426%). In the early 2010s, cryo‐electron microscopy data sets were measured in gigabytes; with the advent of lattice light‐sheet microscopy, individual 4D data sets are measured in tens of gigabytes, with complete collections measured in terabytes. Both data sets are large, but present different performance issues. The atomic structures in the PDB are described by a variety of data relationships such as atomic connectivity, secondary structure, biological units, journal citations, and so forth. Microscopy data, on the other hand, typically involve less complex relationships but are simply too large to fit into memory for typical computer systems.
ChimeraX, like its predecessor Chimera, is largely implemented using Python, an interpreted programming language. To manipulate these very large datasets interactively, ChimeraX uses memory‐efficient data structures combined with high‐performance algorithms implemented in C++. Input data is typically stored as raw (NumPy37) arrays so there is very little additional overhead in data management. Algorithms for populating, updating, and graphically displaying data sets manipulate these arrays, either directly in Python when the necessary operations are already finely tuned in NumPy, or by custom‐built C++ libraries. ChimeraX includes custom code for parsing data sets, computation, and graphical display.
MacroMolecular Crystallographic Interchange Format (mmCIF)38, 39 is the preferred format for atomic data in ChimeraX. Recently becoming the standard archive format, mmCIF replaces the aged and more limited PDB format and offers a number of advantages:
Support for structures with more than 100,000 atoms or 62 chains.
Computer‐readable assembly information such as unit cell and biological unit.
Improved curation for more reliable data.
mmCIF files keep all data in tables and are not suitable as data structures for interactive manipulation. ChimeraX includes two custom C++ libraries, one for parsing mmCIF tables and another to construct the internal data structures. The former library, following the mmCIF specification as well as some de facto standards and heuristics, converts the input file into in‐memory tables. The latter converts the table data into NumPy arrays (e.g., for bulk data such as coordinates, temperature factor, and occupancy for all atoms) and custom data structures (e.g., for atomic connectivity, assembly data). While the mmCIF specification is both more complex and complete than the PDB specifications, ChimeraX reads mmCIF files as fast or faster than the corresponding PDB files. Even a very large PDB entry consisting of 2,440,800 atoms (3j3q, Fig. 1 top row) may be displayed in less than 10 seconds by ChimeraX on a modern desktop.
Microscopy data offers different performance issues. For example, lattice light‐sheet microscopy data are measured in terabytes and frequently transported not via computer networks but by sending entire disk drives. While analyzing these new data sets is possible using existing software packages such as UCSF Chimera, the effort requires developing custom code, often tuned for individual data sets, as described by Fritz‐Laylin et al.40
Atomic structures and microscopy maps are traditional data sets that have been in use for decades. With the explosion of available data, models from integrative hybrid modeling41 (IHM) are becoming more prevalent, with multiple formats being proposed (https://integrativemodeling.org/rmf/format.html, https://pdb-dev.rcsb.rutgers.edu/about/). IHM models are typically aggregations of traditional data sets derived from the same molecular system, and hence can be large and complex. To support IHM models, ChimeraX includes a hierarchical representation that enables grouping of models into higher‐level logical units (Fig. 10). For example, atomic‐resolution systems may be grouped into proteins, complexes, domains, and so forth; heterogeneous data sets containing atomic‐resolution models, electron density maps, and crosslink information may be organized into models (atomic coordinates or density) and restraints (crosslink distances).
Figure 10.
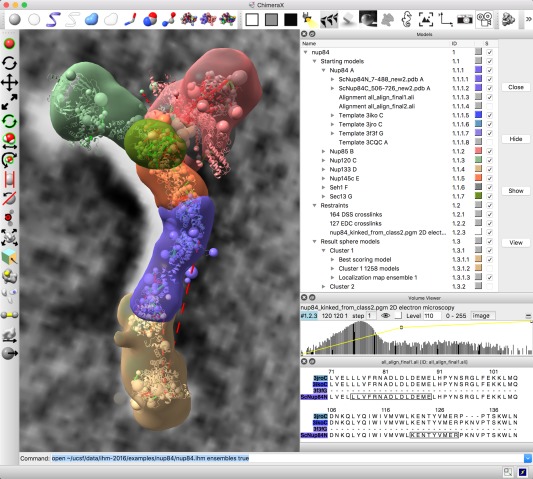
Integrated modeling. ChimeraX window showing starting models, restraints and output from integrative hybrid modeling of the nup84 nuclear pore subcomplex. Hierarchical data organization is shown in upper right including starting comparative models, template structures and sequence alignments for seven components, chemical crosslinking restraints and 2D electron microscopy, and coarse‐grained output ensembles. Graphics shows a best‐scoring model satisfying restraints, large spheres for multi‐residue unordered segments, dashed lines for crosslinks, 2D electron microscopy in background, localization density envelopes for the ensemble of solutions. Lower right panels control electron microscopy rendering and show comparative model and template sequence alignments.
ChimeraX takes advantage of modern hardware features, including multiple CPU cores and GPU‐based computing. Molecular surfaces are created by partitioning atomic structures into disjoint segments; each segment is then computed in a separate execution thread. With multiple threads running in parallel, surface generation is much faster than traditional single‐CPU algorithms. ChimeraX also makes GPU computing available to community developers by embedding OpenMM.42 For example, the ISOLDE flexible‐fitting extension mentioned in the VR section uses OpenMM.
Software Extensibility and Distribution
Community development is a paradigm where access to a software platform is made publicly available so that novel applications may be created more easily by independent developers leveraging the platform's functionality. Many open‐source software projects, for example, Cytoscape30 and UCSF Chimera,22 have benefited from user‐contributed extensions to the distributed platforms. ChimeraX is also designed to facilitate community development and modular distribution of new algorithms and tools. Two critical ingredients in ChimeraX for successful community development are: (a) a stable application programming interface (API) to a rich set of functionality for manipulating data, graphics and user interfaces; and (b) a “toolshed” where developers can deposit new tools and users can download and install these tools.
ChimeraX is implemented using Python, with supporting C++ libraries for performance. The code is arranged as “bundles” – Python packages that contain a set of related functionality. For example, the “alignments” bundle contains support for opening FASTA and MSF files and commands for manipulating sequences and alignments. The Python interface for accessing functionality from code is defined by the APIs, which are documented and follow semantic versioning conventions (i.e., tools developed using APIs from earlier releases of ChimeraX are guaranteed to be compatible with subsequent minor releases). Sample bundles are provided to help developers get started with their projects, including instructions on using basic bundle APIs, as well as installing and testing against a ChimeraX distribution. Because all ChimeraX functionality is available via Python, developers need only the standard distribution and a text editor to create most bundles. There is also support for including C++ code, whether for general performance or to take advantage of platform‐specific features (e.g., the VR bundle is currently only available on Windows).
When a bundle is ready to be shared with others, it can be packaged using the standard Python “wheel” distribution format (www.python.org/dev/peps/pep-0491/). When sharing with only a few users, bundles may be exchanged using electronic mail. However, distributing bundles to the entire ChimeraX user community is a greater challenge. Following the Cytoscape App Store43 model, ChimeraX employs the “ChimeraX Toolshed,” a web‐based central repository where bundle contributions may be deposited, browsed, searched, and downloaded. The Toolshed benefits community developers by providing a simple distribution mechanism that does not require setup or maintenance, and the user community by making new functionality easily discoverable. The Toolshed also helps with ChimeraX distribution by keeping only commonly used bundles in the standard distribution, while making more esoteric bundles available via a simple installation procedure.
To take advantage of the Toolshed, ChimeraX includes code to check periodically for newly deposited bundles. A new deposit may be either an entirely new bundle or an update to an existing one. In either case, users have the option to (a) automatically install it, (b) be notified of its availability, or (c) ignore it. The Toolshed may also be viewed via standard web browsers (https://cxtoolshed.rbvi.ucsf.edu) if users want to check manually without running ChimeraX. By streamlining the installation and update process, ChimeraX allows users to get the “latest and greatest” features with minimal effort.
Status and Future Directions
ChimeraX is available for Windows, Mac, and Linux operating systems (http://www.rbvi.ucsf.edu/chimerax /) and is open source and free for non‐commercial use (commercial use requires a written license agreement). Many capabilities from the predecessor Chimera are being ported to ChimeraX, including interfaces to web services such as for calculating electrostatic potential (APBS44), ligand docking (AutoDock Vina45), comparative modeling (Modeller46), and multiple sequence alignment (Clustal Omega47). A diverse range of new capabilities are under development for 3D light‐sheet microscopy, model building in atomic‐resolution cryoEM density maps, integrative hybrid modeling, interactive analysis using VR headsets, and alternative depictions of multiple sequence alignments.48
Conclusion
We have described several features of ChimeraX, our next‐generation software for visualization and analysis of molecular structures, density maps, 3D microscopy, and associated data. These features include advanced options for high‐quality rendering such as interactive ambient occlusion, reliable molecular surface calculations, and new algorithms for depicting secondary structure using ribbons and curved cylinders. Particular attention has been placed on the ability to efficiently process and manipulate very large structures, including quickly parsing mmCIF files and providing a hierarchical interface to the structural components often contained in complex models. ChimeraX's use of the Qt windowing system provides several advantages, including native support for HTML, with click‐to‐execute links allowing both easy access to functions from tools and simple creation of custom demos. Finally, emphasis has been placed on extensibility so that outside developers can easily create and distribute specialized modules.
Acknowledgments
We thank Tristan Croll from Cambridge University for contributing the ISOLDE flexible‐fitting extension and his willingness to test early versions of the ChimeraX Toolshed. ChimeraX's tools for Integrative Hybrid Modeling have been developed in collaboration with Brinda Vallat and John Westbrook at the Research Collaboratory for Structural Bioinformatics (RCSB) at Rutgers University and Ben Webb and Andrej Sali at UCSF.
Thomas D. Goddard and Conrad C. Huang contributed equally to this work.
Impact: The size, scope, and heterogeneity of data in structural and cellular biology pose significant challenges to the scientific community and to software development. UCSF ChimeraX is a new program for the interactive visualization and analysis of molecular structures and related data such as density maps and 3D light microscopy at potentially very large scales, including time series.
References
- 1. O'Donoghue SI, Goodsell DS, Frangakis AS, Jossinet F, Laskowski RA, Nilges M, Saibil HR, Schafferhans A, Wade RC, Westhof E, Olson AJ (2010) Visualization of macromolecular structures. Nat Methods 7:42. [DOI] [PMC free article] [PubMed] [Google Scholar]
- 2. Wang J, Moore PB (2017) On the interpretation of electron microscopic maps of biological macromolecules. Protein Sci 26:122–129. [DOI] [PMC free article] [PubMed] [Google Scholar]
- 3. Baker ML, Zhang J, Ludtke SJ, Chiu W (2010) Cryo‐EM of macromolecular assemblies at near‐atomic resolution. Nat Protoc 5:1697–1708. [DOI] [PMC free article] [PubMed] [Google Scholar]
- 4. Baker ML, Hryc CF, Zhang Q, Wu W, Jakana J, Haase‐Pettingell C, Afonine PV, Adams PD, King JA, Jiang W, Chiu W (2013) Validated near‐atomic resolution structure of bacteriophage epsilon15 derived from cryo‐EM and modeling. Proc Natl Acad Sci USA 110:12301–12306. [DOI] [PMC free article] [PubMed] [Google Scholar]
- 5. Chen BC, Legant WR, Wang K, Shao L, Milkie DE, Davidson MW, Janetopoulos C, Wu XS, Hammer JA, 3rd , Liu Z, English BP, Mimori‐Kiyosue Y, Romero DP, Ritter AT, Lippincott‐Schwartz J, Fritz‐Laylin L, Mullins RD, Mitchell DM, Bembenek JN, Reymann AC, Bohme R, Grill SW, Wang JT, Seydoux G, Tulu US, Kiehart DP, Betzig E (2014) Lattice light‐sheet microscopy: imaging molecules to embryos at high spatiotemporal resolution. Science 346:1257998. [DOI] [PMC free article] [PubMed] [Google Scholar]
- 6. Sali A, Berman HM, Schwede T, Trewhella J, Kleywegt G, Burley SK, Markley J, Nakamura H, Adams P, Bonvin AM, Chiu W, Peraro MD, Di Maio F, Ferrin TE, Grunewald K, Gutmanas A, Henderson R, Hummer G, Iwasaki K, Johnson G, Lawson CL, Meiler J, Marti‐Renom MA, Montelione GT, Nilges M, Nussinov R, Patwardhan A, Rappsilber J, Read RJ, Saibil H, Schroder GF, Schwieters CD, Seidel CA, Svergun D, Topf M, Ulrich EL, Velankar S, Westbrook JD (2015) Outcome of the first wwPDB hybrid/integrative methods task force workshop. Structure 23:1156–1167. [DOI] [PMC free article] [PubMed] [Google Scholar]
- 7. Rose PW, Beran B, Bi C, Bluhm WF, Dimitropoulos D, Goodsell DS, Prlic A, Quesada M, Quinn GB, Westbrook JD, Young J, Yukich B, Zardecki C, Berman HM, Bourne PE (2011) The RCSB protein data bank: redesigned web site and web services. Nucleic Acids Res 39:392. [DOI] [PMC free article] [PubMed] [Google Scholar]
- 8. McWilliam H, Valentin F, Goujon M, Li W, Narayanasamy M, Martin J, Miyar T, Lopez R (2009) Web services at the european bioinformatics institute‐2009. Nucleic Acids Res 37:6. [DOI] [PMC free article] [PubMed] [Google Scholar]
- 9. Bhagat J, Tanoh F, Nzuobontane E, Laurent T, Orlowski J, Roos M, Wolstencroft K, Aleksejevs S, Stevens R, Pettifer S, Lopez R, Goble CA (2010) BioCatalogue: a universal catalogue of web services for the life sciences. Nucleic Acids Res 38:689. [DOI] [PMC free article] [PubMed] [Google Scholar]
- 10. Berman H, Henrick K, Nakamura H (2003) Announcing the worldwide protein data bank. Nat Struct Biol 10:980. [DOI] [PubMed] [Google Scholar]
- 11. Pieper U, Webb BM, Barkan DT, Schneidman‐Duhovny D, Schlessinger A, Braberg H, Yang Z, Meng EC, Pettersen EF, Huang CC, Datta RS, Sampathkumar P, Madhusudhan MS, Sjolander K, Ferrin TE, Burley SK, Sali A (2011) ModBase, a database of annotated comparative protein structure models, and associated resources. Nucleic Acids Res 39:465. [DOI] [PMC free article] [PubMed] [Google Scholar]
- 12. Tagari M, Newman R, Chagoyen M, Carazo JM, Henrick K (2002) New electron microscopy database and deposition system. Trends Biochem Sci 27:589. [DOI] [PubMed] [Google Scholar]
- 13. The UniProt Consortium (2017) UniProt: the universal protein knowledgebase. Nucleic Acids Res 45:D169. [DOI] [PMC free article] [PubMed] [Google Scholar]
- 14. Finn RD, Coggill P, Eberhardt RY, Eddy SR, Mistry J, Mitchell AL, Potter SC, Punta M, Qureshi M, Sangrador‐Vegas A, Salazar GA, Tate J, Bateman A (2016) The pfam protein families database: towards a more sustainable future. Nucleic Acids Res 44:279. [DOI] [PMC free article] [PubMed] [Google Scholar]
- 15. Dawson NL, Lewis TE, Das S, Lees JG, Lee D, Ashford P, Orengo CA, Sillitoe I (2017) CATH: An expanded resource to predict protein function through structure and sequence. Nucleic Acids Res 45:D295. [DOI] [PMC free article] [PubMed] [Google Scholar]
- 16. Murzin AG, Brenner SE, Hubbard T, Chothia C (1995) SCOP: a structural classification of proteins database for the investigation of sequences and structures. J Mol Biol 247:536–540. [DOI] [PubMed] [Google Scholar]
- 17. Marchler‐Bauer A, Derbyshire MK, Gonzales NR, Lu S, Chitsaz F, Geer LY, Geer RC, He J, Gwadz M, Hurwitz DI, Lanczycki CJ, Lu F, Marchler GH, Song JS, Thanki N, Wang Z, Yamashita RA, Zhang D, Zheng C, Bryant SH (2015) CDD: NCBI's conserved domain database. Nucleic Acids Res 43:222. [DOI] [PMC free article] [PubMed] [Google Scholar]
- 18. NCBI Resource Coordinators (2016) Database resources of the national center for biotechnology information. Nucleic Acids Res 44:7. [DOI] [PMC free article] [PubMed] [Google Scholar]
- 19. Goddard TD, Huang CC, Ferrin TE (2007) Visualizing density maps with UCSF chimera. J Struct Biol 157:281–287. [DOI] [PubMed] [Google Scholar]
- 20. Meng EC, Pettersen EF, Couch GS, Huang CC, Ferrin TE (2006) Tools for integrated sequence‐structure analysis with UCSF chimera. BMC Bioinformatics 7:339. [DOI] [PMC free article] [PubMed] [Google Scholar]
- 21. Goddard TD, Huang CC, Ferrin TE (2005) Software extensions to UCSF chimera for interactive visualization of large molecular assemblies. Structure 13:473–482. [DOI] [PubMed] [Google Scholar]
- 22. Pettersen EF, Goddard TD, Huang CC, Couch GS, Greenblatt DM, Meng EC, Ferrin TE (2004) UCSF chimera–a visualization system for exploratory research and analysis. J Comput Chem 25:1605–1612. [DOI] [PubMed] [Google Scholar]
- 23. Tarini M, Cignoni P, Montani C (2006) Ambient occlusion and edge cueing to enhance real time molecular visualization. IEEE Trans Vis Comput Graph 12:1237–1244. [DOI] [PubMed] [Google Scholar]
- 24. Humphrey W, Dalke A, Schulten K (1996) VMD: visual molecular dynamics. J Mol Graph 14:8. [DOI] [PubMed] [Google Scholar]
- 25. Wahle M, Wriggers W (2015) Multi‐scale visualization of molecular architecture using real‐time ambient occlusion in sculptor. PLoS Comput Biol 11:e1004516. [DOI] [PMC free article] [PubMed] [Google Scholar]
- 26. Lee B, Richards FM (1971) The interpretation of protein structures: estimation of static accessibility. J Mol Biol 55:IN4. [DOI] [PubMed] [Google Scholar]
- 27. Sanner MF, Olson AJ, Spehner JC (1996) Reduced surface: an efficient way to compute molecular surfaces. Biopolymers 38:305–320. [DOI] [PubMed] [Google Scholar]
- 28. Shi Y, Fernandez‐Martinez J, Tjioe E, Pellarin R, Kim SJ, Williams R, Schneidman‐Duhovny D, Sali A, Rout MP, Chait BT (2014) Structural characterization by cross‐linking reveals the detailed architecture of a coatomer‐related heptameric module from the nuclear pore complex. Mol Cell Proteomics 13:2927–2943. [DOI] [PMC free article] [PubMed] [Google Scholar]
- 29. Cline MS, Smoot M, Cerami E, Kuchinsky A, Landys N, Workman C, Christmas R, Avila‐Campilo I, Creech M, Gross B, Hanspers K, Isserlin R, Kelley R, Killcoyne S, Lotia S, Maere S, Morris J, Ono K, Pavlovic V, Pico AR, Vailaya A, Wang PL, Adler A, Conklin BR, Hood L, Kuiper M, Sander C, Schmulevich I, Schwikowski B, Warner GJ, Ideker T, Bader GD (2007) Integration of biological networks and gene expression data using cytoscape. Nat Protoc 2:2366–2382. [DOI] [PMC free article] [PubMed] [Google Scholar]
- 30. Shannon P, Markiel A, Ozier O, Baliga NS, Wang JT, Ramage D, Amin N, Schwikowski B, Ideker T (2003) Cytoscape: a software environment for integrated models of biomolecular interaction networks. Genome Res 13:2498–2504. [DOI] [PMC free article] [PubMed] [Google Scholar]
- 31. Szklarczyk D, Morris JH, Cook H, Kuhn M, Wyder S, Simonovic M, Santos A, Doncheva NT, Roth A, Bork P, Jensen LJ, von Mering C (2017) The STRING database in 2017: quality‐controlled protein‐protein association networks, made broadly accessible. Nucleic Acids Res 45:D368. [DOI] [PMC free article] [PubMed] [Google Scholar]
- 32. Carson M, Bugg CE (1986) Algorithm for ribbon models of proteins. J Mol Graph 4:121–122. [Google Scholar]
- 33. Richardson JS (1981) The anatomy and taxonomy of protein structure. Adv Protein Chem 34:167–339. [DOI] [PubMed] [Google Scholar]
- 34. Bansal M, Kumar S, Velavan R (2000) HELANAL: a program to characterize helix geometry in proteins. J Biomol Struct Dyn 17:811–819. [DOI] [PubMed] [Google Scholar]
- 35.[Anonymous] Qt: cross‐platform development for embedded & desktop. <https://www.qt.io>. Accessed 7 June 2017.
- 36. Croll TI, Andersen GR (2016) Re‐evaluation of low‐resolution crystal structures via interactive molecular‐dynamics flexible fitting (iMDFF): a case study in complement C4. Acta Cryst D72:1006–1016. [DOI] [PubMed] [Google Scholar]
- 37. van der Walt S, Colbert SC, Varoquaux G (2011) The NumPy array: a structure for efficient numerical computation. Cise‐M 13:22–30. [Google Scholar]
- 38. Westbrook JD, Fitzgerald PM (2003) The PDB format, mmCIF, and other data formats. Methods Biochem Anal 44:161–179. [PubMed] [Google Scholar]
- 39. Westbrook JD, Bourne PE (2000) STAR/mmCIF: an ontology for macromolecular structure. Bioinformatics 16:159–168. [DOI] [PubMed] [Google Scholar]
- 40. Fritz‐Laylin LK, Riel‐Mehan M, Chen B, Lord SJ, Goddard TD, Ferrin TE, Johnson G, Betzig E, Mullins RD. Three‐dimensional actin‐based protrusions of migrating neutrophils are intrinsically lamellar and facilitate direction changes. BioRxiv (120444). [DOI] [PMC free article] [PubMed] [Google Scholar]
- 41. Alber F, Dokudovskaya S, Veenhoff LM, Zhang W, Kipper J, Devos D, Suprapto A, Karni‐Schmidt O, Williams R, Chait BT, Rout MP, Sali A (2007) Determining the architectures of macromolecular assemblies. Nature 450:683–694. [DOI] [PubMed] [Google Scholar]
- 42. Eastman P, Pande VS (2015) OpenMM: a hardware independent framework for molecular simulations. Comput Sci Eng 12:34–39. [DOI] [PMC free article] [PubMed] [Google Scholar]
- 43. Lotia S, Montojo J, Dong Y, Bader GD, Pico AR (2013) Cytoscape app store. Bioinformatics 29:1350–1351. [DOI] [PMC free article] [PubMed] [Google Scholar]
- 44. Baker NA, Sept D, Joseph S, Holst MJ, McCammon JA (2001) Electrostatics of nanosystems: application to microtubules and the ribosome. Proc Natl Acad Sci USA 98:10037–10041. [DOI] [PMC free article] [PubMed] [Google Scholar]
- 45. Trott O, Olson AJ (2010) AutoDock vina: improving the speed and accuracy of docking with a new scoring function, efficient optimization, and multithreading. J Comput Chem 31:455–461. [DOI] [PMC free article] [PubMed] [Google Scholar]
- 46. Sali A, Blundell TL (1993) Comparative protein modelling by satisfaction of spatial restraints. J Mol Biol 234:779–815. [DOI] [PubMed] [Google Scholar]
- 47. Sievers F, Wilm A, Dineen D, Gibson TJ, Karplus K, Li W, Lopez R, McWilliam H, Remmert M, Soding J, Thompson JD, Higgins DG (2011) Fast, scalable generation of high‐quality protein multiple sequence alignments using clustal omega. Mol Syst Biol 7:539. [DOI] [PMC free article] [PubMed] [Google Scholar]
- 48. Roca AI (2014) ProfileGrids: a sequence alignment visualization paradigm that avoids the limitations of sequence logos. BMC Proc 8:S6. eCollection 2014. [DOI] [PMC free article] [PubMed] [Google Scholar]