Abstract
The correct spatial distribution of proteins is vital for their function and often mis‐localization or ectopic expression leads to diseases. For more than a decade, the Human Protein Atlas (HPA) has constituted a valuable tool for researchers studying protein localization and expression in human tissues and cells. The centerpiece of the HPA is its unique antibody collection for mapping the entire human proteome by immunohistochemistry and immunocytochemistry. By these approaches, more than 10 million images showing protein expression patterns at a single‐cell level were generated and are publicly available at www.proteinatlas.org. The antibody‐based approach is combined with transcriptomics data for an overview of global expression profiles. The present article comprehensively describes the HPA database functions and how users can utilize it for their own research as well as discusses the future path of spatial proteomics.
Keywords: spatial proteomics, transcriptomics, antibodies, immunohistochemistry, immunofluorescence, single‐cell, protein expression
Importance of Article
The article summarizes recent updates and current status of the Human Protein Atlas, www.proteinatlas.org, which is the largest and most comprehensive database for spatial distribution of proteins in human tissues and cells. An overview of the publicly available database is provided, and its functions and potential implications for use as well as the future path of spatial proteomics are discussed.
Introduction
Proteins are the essential building blocks of life, and resolving the spatial distribution of all human proteins on an organ, tissue, cellular, and sub‐cellular level will greatly increase our understanding of human biology in health and disease. Ever since the completion of the human genome sequence, the ultimate goal has been to understand the dynamic expression of the approximately 20,000 protein‐coding genes and to generate a map of the human proteome. Recent efforts include the Human Proteome Map1 and the Proteomics DB2 based on mass spectrometry of human tissues as well as the initiative from the HUPO Human Proteome Project (HPP), whose more stringent guidelines resulted in a more accurate map.3 Part of the HPP initiative is the Human Protein Atlas (HPA) project, focusing on antibody‐based proteomics and integrated omics.
An “atlas” is defined as a collection of maps or charts that gives a comprehensive view on a certain subject. Under this premise, the goal of the publicly available HPA is to reveal the spatial distribution and expression of every human protein in different human tissues, cancer types, and cell lines. This approach allows looking at single proteins and lists of proteins belonging to structures such as organs and organelles, or categorizing proteins based on expression level and tissue distribution, for example, housekeeping proteins and tissue elevated proteins. Several recent achievements are a first draft of a tissue‐based atlas,4 a sub‐cellular atlas,5 and a pathology atlas.6
The HPA was initiated in 2003, and launched a first version of the public database www.proteinatlas.org in 2005, containing protein expression data based on approximately 700 antibodies.7 Since then, each new release has included both more data and new website functionalities, and major milestones consist of a gene‐centric database with information on all human genes predicted by Ensembl8 and addition of transcriptomics data based on high‐throughput mRNA sequencing.9 Both in‐house generated antibodies and commercial antibodies from different providers are used for immunohistochemistry (IHC) and immunofluorescence (IF). Version 17 contains >25,000 antibodies that have passed rigorous quality tests for antigen specificity and validation, leading to a collection of more than 10 million IHC images and 82,000 high‐resolution IF images. Thereby, more than 86% of the current 19,628 human protein‐coding genes according to Ensembl version 83.3810 are already targeted by at least one antibody. Version 17 of the HPA is divided into three sub‐atlases (Fig. 1): the Tissue Atlas describing expression and localization of proteins across 40 non‐diseased human organs using RNA‐Seq and IHC on tissue microarrays (TMAs); the Pathology Atlas, containing RNA and protein expression data for the 17 major types of human cancer; and the Cell Atlas describing the sub‐cellular locations of proteins to organelles with IF images in 22 cell lines and cell line‐specific gene expression across 56 different cell lines. The different sub‐atlases are interconnected and complement each other. This enables the user to explore a protein's tissue and organ distribution, sub‐cellular localization, and relation to cancer by toggling between the different sub‐atlases. The HPA provides an important resource for both basic and clinical research, and in the present article, the different parts and functions of the publicly available HPA webpage and primary data are presented and discussed.
Figure 1.
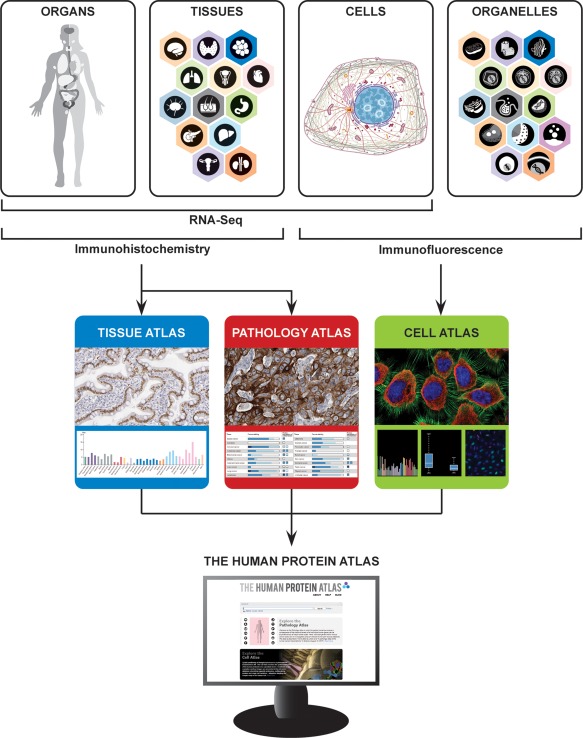
Schematic overview of the HPA. The HPA analyzes the human genome on different levels: in organs, tissues, cells, and organelles. Organs and tissues are stained using IHC, providing the basis for the Tissue Atlas and Pathology Atlas, while cells and organelles are analyzed with IF in the Cell Atlas. The proteomic analysis is combined with RNA‐Seq on the organ, tissue, and cellular level, and all data is freely accessible on the HPA web portal, www.proteinatlas.org.
Antibody Validation
The experimentally determined protein locations in the HPA are only as good as its main reagent, the antibodies. Antibodies require high sensitivity and specificity to achieve reliable data, thus providing the best estimate of protein expression across tissues and cells. Consequently, antibody validation is a crucial part of the HPA. All antibodies produced within the HPA project have to pass quality assurance steps before being used in IHC and IF.11 First, plasmid inserts are sequenced to assure that the correct protein epitope signature tag (PrEST) sequence is cloned. Second, the size of the resulting recombinant protein (including the specific PrEST) is thereafter analyzed using mass spectrometry to assure that the correct antigen has been produced and purified. Third, to control for cross‐reactivity, affinity purified antibodies are tested for sensitivity and specificity on protein arrays consisting of glass slides with spotted PrEST fragments. HPA antibodies that meet these three criteria have to pass at least one additional assay before they are published on the Atlas. All of them as well as commercially available antibodies are tested by Western blot analysis of protein lysates from a limited number of tissues and cell lines. Images generated using IHC and IF are critically evaluated and compared with available experimental gene/protein characterization data. Antibodies that pass these standard validation methods are subsequently formally validated based on the recommendations of the International Working Group for Antibody Validation committee,12 suggesting different “pillars” as standard for antibody validation. These pillars consist of genetic methods (e.g., siRNA knockdown), independent antibodies targeting different epitopes of the same antigen, orthogonal strategies comparing differentially expressed proteins (e.g., tissues with low and high expression) using an antibody‐independent method, or expression of a fluorescent protein‐tagged protein. The methods are described in detail on the HPA webpage (www.proteinatlas.org/about/antibody+validation) and related assays can be found on the respective gene page. Based on how the antibody performs in different validation assays, all annotations are scored for their reliability at a four‐tiered scale: “validated”, “supported”, “approved”, and “uncertain”. The current counts for the four categories based on the 16,990 genes with at least one available antibody in the HPA are 1548 validated (9.1%), 6012 supported (35.8%), 6927 approved (40.8%), and 779 uncertain (14.7%) genes. For genes where the reliability score differs between the Tissue Atlas and Cell Atlas, the score with highest reliability is considered in the counts. In the categories “approved” and “uncertain”, the number of false annotation or off‐target binding is naturally higher, but the effect on global proteomic analyses is small.5 Nevertheless, the user can filter for the reliability in the search field and download data only from genes with a certain reliability score. The number of genes with validated and supported antibodies will increase in upcoming releases of the HPA.
How to Get Started
In all three sub‐atlases, each gene has its own summary page, which can be accessed in two different ways (Fig. 2). The most straightforward way is the search function [Fig. 2(A)], which can be used for free text searches such as gene name, gene synonyms, gene descriptions or external gene and protein identifiers (UniProt, Ensembl, NCBI Entrez Gene) as well as for searches based on protein classes, Gene Ontology identifiers and descriptions, antibody identifiers and image annotations. For more complex queries, the “Fields” function allows a specific search for a list of genes that match selected characteristics. For example, the search can be for a certain protein class, such as, enzymes and receptors, predicted secreted proteins, or potential drug targets; or the search can be within the primary data generated in the HPA about protein expression, or antibody validation in different assays. It is not only possible to include (or exclude) proteins localized to a certain tissue or organelle, but to refine the search by combining several criteria such as adding cell cycle dependent sub‐cellular expression and RNA expression. A search performed via free text or “Fields” generates a gene‐centric list of results, which can be organized in a comprehensive manner dependent on information of interest by using the “Show/hide columns” function. A gene page is accessed by clicking on a gene of interest, and the different sub‐atlases are reached through the corresponding thumbnail images [Fig. 2(B)].
Figure 2.
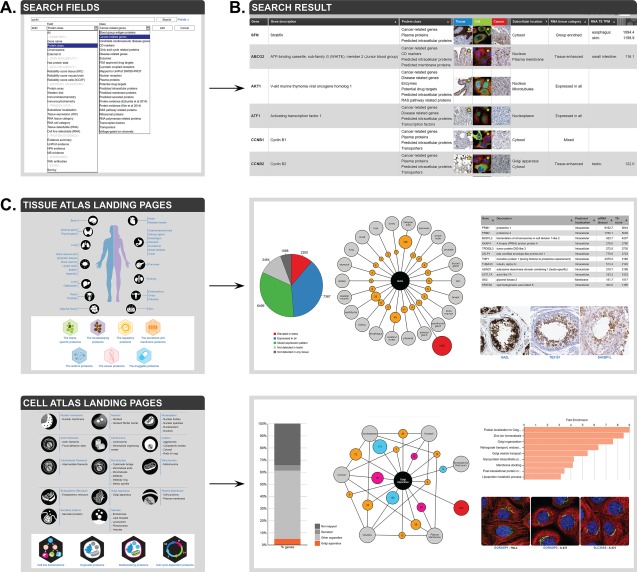
Overview of different search strategies in the HPA. (A) Using the search fields allows for combining different criteria to a refined search for a particular group of proteins. (B) A search results in a list of genes meeting the criteria, with links to primary data in the different sub‐atlases. (C) Landing pages in the Tissue Atlas (top) and the Cell Atlas (bottom) contain numerous clickable charts, figures, images, and tables that allow for further investigation of certain proteins of interest.
The second way to get to a gene page is through landing pages [Fig. 2(C)], which are interactive knowledge chapters discussing the proteome of a single compartment, such as a single tissue or organelle. They contain a brief description of the tissue/organelle, summarize the HPA data, and present example images of the different cell types and morphologies. In addition, network plots show how the tissue/organelle is connected with other tissues/organelles by proteins with a similar expression or multilocalization. A key feature of the landing pages is their interactivity. Every image, number, or plot is a clickable and leads either directly to a list of genes, a gene summary page, or a specific tissue or cell image. More information on the landing pages in the different sub‐atlases is described below.
Tissue Atlas
The major Tissue Atlas release in 2014 included addition of RNA‐Seq data, with each gene page on the Tissue Atlas containing a comprehensive summary of expression both on the mRNA and protein level.4 The protein expression data, currently covering 15,297 (78%) of the protein‐coding genes, is derived from antibody‐based protein profiling using IHC on TMAs. Altogether 76 different cell types, corresponding to 44 non‐diseased human tissue types covering all major parts of the human body, have been analyzed manually and the data is presented as histology‐based annotation of protein expression levels. In addition to the standard setup, extended tissue profiling is performed for selected proteins, to give a more complete overview of where the protein is expressed. Extended tissue samples include mouse brain, human lactating breast, eye, and additional samples of adrenal gland, skin and brain. The current version contains 3452 such images, and upcoming versions will include both more genes and more types of organs with extended tissue profiling.
Figure 3 summarizes the layout of a Tissue Atlas gene page, exemplified by the gene CCNB1. On top of the gene page [Fig. 3(A)], three boxes are found. “General information” summarizes gene information from Ensembl, protein class, predicted localization and number of transcripts. By clicking on “Show more”, Entrez information and more external links to available gene identifiers are provided. Each heading with an “i”‐sign is clickable with a short description of the content. “HPA information” provides a summary of RNA tissue category based on both internally generated RNA‐Seq data (HPA), as well as two external RNA expression datasets; RNA‐Seq data from the Genotype‐Tissue Expression (GTEx) consortium13 and CAGE data from the FANTOM5 consortium.14 The RNA tissue categories group all human protein‐coding genes based on pattern of expression, including expressed in all, tissue enriched, group enriched, tissue enhanced, mixed or not detected, as described previously in.9 RNA tissue categories are calculated separately for the three different RNA expression datasets, including 37 tissues from HPA, 31 tissues from GTEx, and 35 tissues from FANTOM5, altogether covering 40 of the 44 tissues analyzed with IHC. Other information provided in the “HPA information” box includes “Protein evidence” generated from several independent sources. “Protein expression” is a short summary of the overall protein expression profile in non‐diseased tissues, including sub‐cellular localization and tissue distribution. In the “Data reliability” box, the “Data reliability description” summarizes the knowledge‐based interpretation of the primary data, while “Reliability score” shows a 4‐tiered reliability score (see more under Antibody validation section) and ID:s of the antibodies used in the assay. Clicking on “Show more” leads into the “Antibody validation” page with detailed information on all antibody validation assays.
Figure 3.
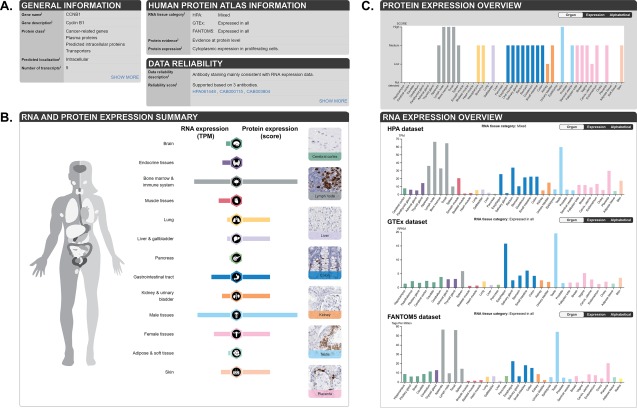
Overview of a gene page in the Tissue Atlas. (A) On top of the page, general gene/protein information as well as the HPA data are summarized. (B) Summary of RNA and protein expression in 13 different groups of tissues, including examples of IHC stained tissues. (C) The plots depict protein expression levels in 44 non‐diseased tissues, as well as RNA expression levels from three different sources: the HPA (37 tissues), the GTEx consortium (31 tissues), and FANTOM5 (35 tissues).
Below the three information boxes, the “RNA and protein expression summary” is shown [Fig. 3(B)], providing an overview of data generated in the HPA project. The analyzed tissues are divided into 13 different groups according to common functional features, and each group is clickable for access to lists of included tissues. On the right panel of the “RNA and protein expression summary”, images of selected tissues give a visual summary of the protein expression. Below are separate panels showing tissue specific expression in all analyzed tissues both on the protein level (“Protein expression overview”) and the RNA level (“RNA expression overview”) in the three different RNA expression datasets [Fig. 3(C)]. Clicking on a tissue name or bar provides access to the detailed data page.
The detailed data page (Fig. 4) is unique for each analyzed tissue and shows images of the stained tissue samples, together with expression level of the analyzed cell types. As here exemplified by testis, three images each for the three different antibodies used in the assay are displayed, with protein expression summarized as highly expressed in a subset of cells in seminiferous ducts and not detected in Leydig cells [Fig. 4(A)]. All images are clickable for an enlarged high‐resolution view, allowing for visual examination of the protein expression in the context of neighboring cells [Fig. 4(B)]. Below, details on the RNA expression data is shown [Fig. 4(C)], with data on expression in each of the analyzed individuals of the three different RNA expression datasets (HPA, GTEx and FANTOM5). For the samples analyzed in the HPA dataset, a hematoxylin and eosin stained image from a consecutive section of the tissue material used for RNA‐Seq is provided, including estimated fractions of the cell types present in the sample. This gives the user a possibility to evaluate and further understand the RNA expression data, which is based on a mixture of different cell types, and compare the information with cell‐type specific protein expression profiles.
Figure 4.
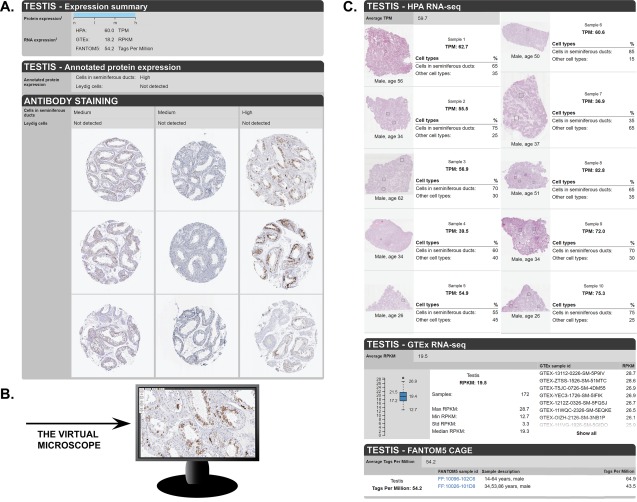
Examples of a detailed tissue page in the Tissue Atlas. (A) On top of the page, a summary of protein and RNA expression levels in a particular tissue (here: testis) is shown. Below are annotated protein expression levels in the different cell types, as well as the primary antibody staining data for different antibodies, including three TMA cores per tissue and antibody. (B) Clicking on an image opens up an enlarged view that can be used like virtual microscope. (C) The samples used for analysis of RNA expression from three different datasets (HPA, GTEx, and FANTOM5) are shown, as well as individual values for each sample in the particular tissue.
Numerous comprehensive landing pages on the HPA (www.proteinatlas.org/humanproteome) describe the proteome and transcriptome of each organ, as well as sub‐proteomes corresponding to particular functional groups of genes, as summarized previously4, 15 [Fig. 2(C)]. The tissue and organ proteome landing pages, such as the lung‐specific proteome,16 the liver‐specific proteome,17 the testis‐specific proteome,18 etc. include catalogs of proteins expressed in a tissue‐restricted manner, based on HPA RNA‐Seq data. Such proteins are believed to play an important role in the organ physiology and provide the basis for organ‐specific research in health and disease. Each landing page contains complete lists of expression of all genes in a certain organ, clickable with direct links to search results or Tissue Atlas gene summary pages, where proteins of interest can be explored further. Network plots show group enriched genes, highlighting genes that are simultaneously elevated in a group of 2–7 tissues, compared to all other analyzed tissues. The plots aid in finding common features between different organs, and further elucidating the function of group enriched genes.
Other landing pages found in the Tissue Atlas are the sub‐proteomes that summarize certain functional groups of genes. Such proteomes include “the druggable proteome”, “the secretome and membrane proteome”, “the cancer proteome”, “the regulatory proteome”, and “the isoform proteome”, as described previously in Uhlén et al.4 All sub‐proteome landing pages summarize general knowledge about each proteome, provide immunohistochemical examples and contain numerous clickable lists with access to Tissue Atlas primary data.
Pathology Atlas
The previous Cancer Atlas contained protein expression data for the 20 most common types of cancer stained with IHC on TMAs using the same workflow as for the Tissue Atlas. In version 17 of the HPA, the Cancer Atlas changed its name to Pathology Atlas together with a major re‐design and release of new data, showing the association of all human genes with clinical outcome.6 In the Pathology Atlas, a systems level approach was used to analyze the human genome with respect to clinical outcome based on genome‐wide expression data from the Cancer Genome Atlas.19 RNA‐Seq data and clinical metadata from 8,000 individual patients corresponding to 17 of the 20 major cancer types included in the HPA were used for determining the correlation between RNA expression levels and overall survival time for each gene in each cancer type. More than 500,000 Kaplan‐Meier plots allow for unbiased identification of prognostic genes. Via search fields and Pathology Atlas landing pages, lists of prognostic genes with a high significance (P < 0.001) are highlighted. The prognostic genes are further divided into favorable genes, where high RNA expression correlates with longer survival time, and unfavorable genes, where high RNA expression correlates with shorter survival times. The RNA‐Seq data are also used for categorization of all genes in the same manner as in the Tissue Atlas, allowing for identification of genes elevated in a certain cancer type compared to other cancers. An overview of a gene summary page in the Pathology Atlas is shown in Figure 5, exemplified by CCNB1. For genes where a significant prognostic association is found, Kaplan‐Meier plots for the cancer types where the gene is prognostic are shown in the “Prognostic summary” section [Fig. 5(A)]. Below, RNA expression levels across the 17 cancer types [Fig. 5(B)] are summarized. In the “Protein expression” section, examples of IHC stained cancer tissues are shown, and a summary of protein expression levels across different cancer types analyzed with IHC is provided [Fig. 5(C)]. The IHC analysis of cancer tissues is performed on up to 12 individuals each from the 17 cancer types analyzed with RNA‐Seq, as well as three additional cancer types; however, the individual samples are not linked between the RNA‐Seq and IHC analyses. Every cancer tissue has a detailed data page providing access to survival analysis data and RNA expression levels for each patient [Fig. 5(D)], as well as clickable high‐resolution IHC images of cancer tissues, up to 12 individuals per cancer type [Fig. 5(E)].
Figure 5.
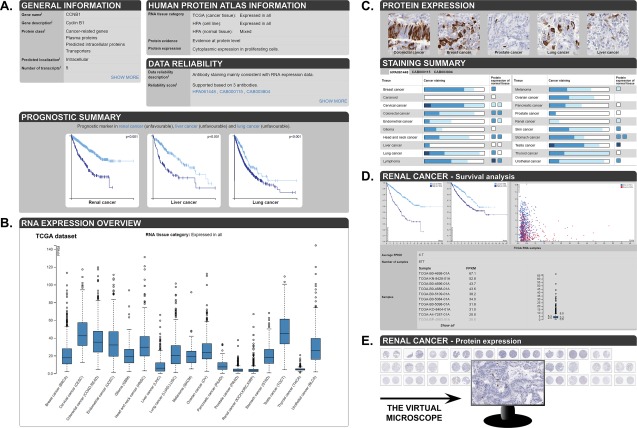
Overview of a gene page in the Pathology Atlas. (A) On top of the page, general gene/protein information as well as the HPA data are summarized. Below, Kaplan‐Meier plots are shown for cancer types showing a significant prognostic association (here: renal, liver and lung cancer). (B) Box plots summarize the RNA expression levels across 17 different cancer types. (C) The protein expression section displays examples of IHC stained cancer tissues and the blue bars summarize cancer tissue staining pattern as well as protein expression of the corresponding non‐diseased tissue. (D) The detailed page shows survival analysis in a particular cancer type (here: renal cancer), as well as individual RNA expression values for each sample. (E) Primary antibody staining data for different antibodies are displayed. Clicking on an image opens up an enlarged view that can be used like virtual microscope.
Pathology Atlas landing pages are presented for each cancer type, providing a comprehensive overview of the genomic and proteomic landscape of each type of cancer, allowing access to cancer tissue elevated genes and prognostic genes.
Cell Atlas
The first version of the Cell Atlas was released in 200720 and the major update in 2016 significantly increased the number of analyzed proteins as well as its functionality.5 The Cell Atlas contains spatial distribution of 12,003 proteins (61% of the human proteome) based on high‐resolution IF images. The proteins are mapped to 32 sub‐cellular structures, which led to the description of 13 major organelle proteomes. An intriguing finding was the large number of multilocalizing proteins. More than half of the analyzed proteins (51.3%, 6163 proteins) were detected in multiple compartments. Main and additional locations of multilocalizing proteins were annotated depending on the signal intensity and appearance in different cell lines. The high‐resolution of the IF images allows to detect variations in the signal between single cells. These cell‐to‐cell variations can either be in the signal strength indicating different protein abundances in different cells; or the protein localization varies between cells. In total 1855 (15%) of the proteins in the Cell Atlas show these single‐cell variations (SCVs), many of which are linked to the cellular progression through the cell cycle. Two different approaches were used to find a cell cycle dependency in protein expression: First, selected proteins were stained in the U‐2 OS FUCCI cell line (Fluorescence Ubiquitination Cell Cycle Indicator21) that allows monitoring the cell cycle by expressing two differently colored fluorescent‐tagged proteins depending on the position during the cell cycle. The expression of 189 proteins (including CCNB1) was determined by this approach. The second approach was an innovative computational model resolving the cell cycle position based on the features of the microtubules and nucleus, which was integrated for 20 genes, for example ANLN.
The layout of the gene page in the Cell Atlas resembles the page in the Tissue Atlas and Pathology Atlas as illustrated in Figure 6 with the CCNB1 gene as example. Most notable is the schematic cell [Fig. 6(A)] highlighting the protein's sub‐cellular location. The box with the “HPA information” summarizes the experimentally generated data. This includes RNA expression category based on TPM values in cell lines (calculated in the same manner as the RNA tissue categories), protein evidence, main/additional locations, and single‐cell variations. Additional assays and custom data can expand the list. In the case of CCNB1, these assays include expression data during the cell cycle based on the FUCCI cell line, expression in mouse cells, and antibody validation by siRNA‐mediated knockdown22 and co‐expression with a GFP‐tagged protein version.23, 24 Custom data are one of the new additions to the Cell Atlas. They are connected to affiliated research projects and provide additional information outside the normal Cell Atlas data. Currently, there are 14 different assays providing custom data. Prominent assays are the staining of proteins in the FUCCI cell line for SCVs, or co‐localization studies with markers for peroxisomes, lysosomes, or endosomes to refine the “vesicle” annotation, or with the cis‐Golgi marker for more precise intraorganellar localizations (Fig 7).
Figure 6.
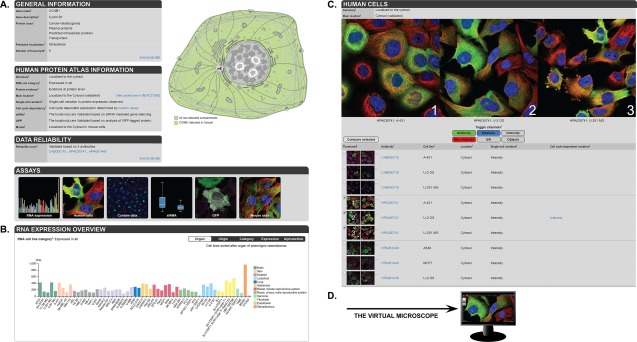
Overview of a gene page in the Cell Atlas. (A) On top of the page, general gene/protein information as well as the HPA data are summarized. A schematic cell on the right highlights the sub‐cellular localization in green (here: cytosol). Miniature images show the different assays that were performed for this particular protein. (B) The plot depicts RNA expression levels in 56 analyzed cell lines. (C) Three high‐resolution IF images using different antibodies and cell lines can be selected and compared by clicking on the checkbox or by drag and drop. Single‐cell variations in gene expression are indicated and specified for variation in expression level (intensity) or spatial changes. (D) Clicking on an image opens up an enlarged view that can be used like a virtual microscope.
Figure 7.
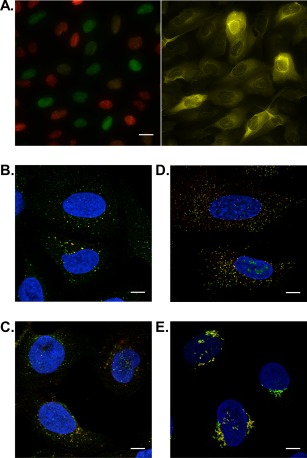
Examples of custom data in the Cell Atlas. (A) IF staining in the U‐2 OS FUCCI cell lines expressing Cdt1 (red) in G1 phase and Geminin (green) in S and G2 phases (left panel) reveals that CCNB1 expression peaks during S/G2 phase (right panel). Co‐localization studies using IF help to distinguish organelles comprised by the vesicle annotation or provide information about intraorganellar distribution. A yellow color indicates co‐localization revealing a localization of (B) ANKFY1 to endosomes (organelle marker EEA1), (C) TMEM192 to lysosomes (marker LAMP1), and (D) PEX14 to peroxisomes (marker ABCD3). (E) The Golgi apparatus is divided into several compartments. The Golgi‐associated protein ZFPL1 is only found in the cis‐Golgi compartment, as it co‐localizes with the marker cis‐Golgi protein GOLGA2. Scale bar 20 µm in (A) and 10 µm in (B–E).
Further down on the gene page [Fig. 6(B)] RNA expression in 56 analyzed cell lines is shown, divided into 12 color‐coded groups according to the organ where they were obtained. Similar to the Tissue Atlas expression tables, the cell line RNA expression table is sortable by different categories. Hovering over a cell line displays the results of the RNA‐Seq and detailed information about the cell line. This transcriptomic data serve as a powerful tool for cell line selection for studying a protein or pathway of interest.
Next, the “Human Cell” section represents the core element of the Cell Atlas [Fig. 6(C)]. Here, high‐resolution IF images show the sub‐cellular localization of proteins in different cell lines. The used cell lines were selected from a panel of 22 lines based on RNA expression level, but always including U‐2 OS as reference. The optimized main protocol for IF staining contained a fixation step with paraformaldehyde, and cells were imaged manually or automatically on a confocal laser scanning microscope.25 The images consist of four channels (protein of interest and marker for nucleus, microtubules, and ER), which can be toggled on and off. In addition, there are channels for signal intensity and objects that show the cell area and reveal the cell cycle position if applicable. Three images can be compared at the same time. Clicking on the checkbox or a drag and drop of the thumbnail on the large image will select the image. All images are also clickable for an enlarged view [Fig. 6(D)].
The landing pages in the Cell Atlas (www.proteinatlas.org/humancell) are interactive pages serving as starting point to explore the human cellular and organellar proteomes and provide background information and analyses of the data in the Cell Atlas [Fig. 2(C)]. The landing pages of the 13 organellar proteomes summarize the findings in the Cell Atlas for each organelle and depict images for different morphologies and sub‐structures of the respective organelle. Intriguing sections on the landing pages are the network plots showing proteins localizing to multiple organelles, highlighting combinations significantly overrepresented or underrepresented compared to the probability of observing that combination based on the frequency of each annotation and a hypergeometric test (P ≤ 0.05).
Four landing pages have a more general character or comprise proteins with certain characteristics to a new proteome. The “cell line transcriptome” page describes the diversity of the 56 cell lines in the Cell Atlas based on RNA‐Seq data. The “organelle proteome” landing page is a summary of all organelle and sub‐structure proteomes that are described within the Cell Atlas and puts them in a global context. The organelles are also merged to three color‐coded meta‐compartments: Nucleus (blue), Cytoplasm (green), and Secretory Pathway (red). Since the majority of proteins are detected in two or more organelles, a landing page is dedicated to this “multilocalizing proteome”. It provides information about multilocalizing proteins and has more detailed analyses than the respective organelle landing page. The “cell cycle dependent proteome” has its focus on proteins whose SCV are related to the progression in the cell cycle. It has a section about general cell‐to‐cell variations observed across the organelles as well as describes the two approaches how a cell cycle dependency is measured in the Cell Atlas.
Download Function
Data listed on the Search page with genes corresponding to the current search result can be downloaded in different formats, including XML, RDF, and TAB. The HPA also provides different downloadable files with the complete primary protein data from the Tissue, Pathology and Cell Atlas, as well as RNA expression levels in tissues and cells. All downloadable files are found on www.proteinatlas.org/about/download. The downloadable data allows for large‐scale bioinformatics analyses using the HPA data as reference datasets. Upcoming releases of HPA will include both new data and more versatile download functions, as well as more advanced search functionalities
Outlook of the HPA
The HPA represents the largest and most comprehensive database for spatial distribution of proteins in tissues and cells, providing an invaluable resource for exploration of expression patterns at a single‐cell resolution. The overall aim is to generate a spatial map of all human protein‐coding genes, and integrate the spatial information with other genomic and proteomic strategies for complete understanding of the biology, molecular repertoire, and architecture of every human cell. In the Tissue and Pathology Atlas, proteins are mapped to various cell types in the context of neighboring cells, allowing for exploration of cell type‐specific expression patterns, differences in expression between organs, as well as identification of proteins up or down‐regulated in corresponding cancer tissues. The new Pathology Atlas data with information on how all human genes are related to patient survival opens up for identification of potential biomarkers that allow for pursuing better diagnostic schemes and designing personalized cancer treatment regimes. The major goal of the Cell Atlas is to map the sub‐cellular distribution of all human proteins over the course of a cell cycle in a canonical human cell.
The overall coverage of protein data in the HPA is 86% of all human protein‐coding genes. In most cases, antibodies are available for the non‐described proteins, but the currently available samples do not express the proteins. The way to solve this issue is the addition of new tissues, new cell lines including primary cells and induced pluripotent stem cells, or looking at early developmental stages. Moreover, both IHC scoring parameters and sub‐cellular localization classifications will be refined to add more cells types, more organelles, and provide intra‐organellar locations. Finally, extended antibody validation strategies applying the aforementioned approaches will contribute to increase the reliability and so the overall quality of the HPA primary data.
In summary, the HPA significantly contributes to a deeper understanding of how proteins form organelles, cells, tissues, and organs and constitutes a tremendous resource for both basic and clinical research.
Availability
The HPA is freely accessible at www.proteinatlas.org and licensed under a Creative Commons Attribution‐NonCommercial‐NoDerivatives 4.0 International License. Data and functionalities are updated annually.
Acknowledgments
The entire staff of the HPA project and the Science for Life Laboratory is acknowledged for valuable contributions. This work was supported by the Knut and Alice Wallenberg Foundation.
References
- 1. Kim MS, Pinto SM, Getnet D, Nirujogi RS, Manda SS, Chaerkady R, Madugundu AK, Kelkar DS, Isserlin R, Jain S, Thomas JK, Muthusamy B, Leal‐Rojas P, Kumar P, Sahasrabuddhe NA, Balakrishnan L, Advani J, George B, Renuse S, Selvan LD, Patil AH, Nanjappa V, Radhakrishnan A, Prasad S, Subbannayya T, Raju R, Kumar M, Sreenivasamurthy SK, Marimuthu A, Sathe GJ, Chavan S, Datta KK, Subbannayya Y, Sahu A, Yelamanchi SD, Jayaram S, Rajagopalan P, Sharma J, Murthy KR, Syed N, Goel R, Khan AA, Ahmad S, Dey G, Mudgal K, Chatterjee A, Huang TC, Zhong J, Wu X, Shaw PG, Freed D, Zahari MS, Mukherjee KK, Shankar S, Mahadevan A, Lam H, Mitchell CJ, Shankar SK, Satishchandra P, Schroeder JT, Sirdeshmukh R, Maitra A, Leach SD, Drake CG, Halushka MK, Prasad TS, Hruban RH, Kerr CL, Bader GD, Iacobuzio‐Donahue CA, Gowda H, Pandey A (2014) A draft map of the human proteome. Nature 509:575–581. [DOI] [PMC free article] [PubMed] [Google Scholar]
- 2. Wilhelm M, Schlegl J, Hahne H, Gholami AM, Lieberenz M, Savitski MM, Ziegler E, Butzmann L, Gessulat S, Marx H, Mathieson T, Lemeer S, Schnatbaum K, Reimer U, Wenschuh H, Mollenhauer M, Slotta‐Huspenina J, Boese JH, Bantscheff M, Gerstmair A, Faerber F, Kuster B (2014) Mass‐spectrometry‐based draft of the human proteome. Nature 509:582. [DOI] [PubMed] [Google Scholar]
- 3. Omenn GS, Lane L, Lundberg EK, Beavis RC, Overall CM, Deutsch EW (2016) Metrics for the Human Proteome Project 2016: progress on identifying and characterizing the human proteome, including post‐translational modifications. J Proteome Res 15:3951–3960. [DOI] [PMC free article] [PubMed] [Google Scholar]
- 4. Uhlén M, Fagerberg L, Hallström BM, Lindskog C, Oksvold P, Mardinoglu A, Sivertsson Å, Kampf C, Sjöstedt E, Asplund A, Olsson I, Edlund K, Lundberg E, Navani S, Szigyarto CA, Odeberg J, Djureinovic D, Takanen JO, Hober S, Alm T, Edqvist PH, Berling H, Tegel H, Mulder J, Rockberg J, Nilsson P, Schwenk JM, Hamsten M, von Feilitzen K, Forsberg M, Persson L, Johansson F, Zwahlen M, von Heijne G, Nielsen J, Pontén F (2015) Tissue‐based map of the human proteome. Science 347:6220. [DOI] [PubMed] [Google Scholar]
- 5. Thul PJ, Åkesson L, Wiking M, Mahdessian D, Geladaki A, Ait Blal H, Alm T, Asplund A, Björk L, Breckels LM, Bäckström A, Danielsson F, Fagerberg L, Fall J, Gatto L, Gnann C, Hober S, Hjelmare M, Johansson F, Lee S, Lindskog C, Mulder J, Mulvey CM, Nilsson P, Oksvold P, Rockberg J, Schutten R, Schwenk JM, Sivertsson Å, Sjöstedt E, Skogs M, Stadler C, Sullivan DP, Tegel H, Winsnes C, Zhang C, Zwahlen M, Mardinoglu A, Pontén F, von Feilitzen K, Lilley KS, Uhlén M, Lundberg E (2017) A subcellular map of the human proteome. Science 356:eaal3321. [DOI] [PubMed] [Google Scholar]
- 6. Uhlén M, Zhang C, Lee S, Sjöstedt E, Fagerberg L, Bidkhori G, Benfeitas R, Arif M, Liu Z, Edfors F, Sanli K, von Feilitzen K, Oksvold P, Lundberg E, Hober S, Nilsson P, Mattsson J, Schwenk JM, Brunnström H, Glimelius B, Sjöblom T, Edqvist PH, Djureinovic D, Micke P, Lindskog C, Mardinoglu A, Ponten F (2017) A pathology atlas of the human cancer transcriptome. Science 357:6352. eaan2507. [DOI] [PubMed] [Google Scholar]
- 7. Uhlén M, Björling E, Agaton C, Szigyarto CA, Amini B, Andersen E, Andersson AC, Angelidou P, Asplund A, Asplund C, Berglund L, Bergström K, Brumer H, Cerjan D, Ekström M, Elobeid A, Eriksson C, Fagerberg L, Falk R, Fall J, Forsberg M, Björklund MG, Gumbel K, Halimi A, Hallin I, Hamsten C, Hansson M, Hedhammar M, Hercules G, Kampf C, Larsson K, Lindskog M, Lodewyckx W, Lund J, Lundeberg J, Magnusson K, Malm E, Nilsson P, Odling J, Oksvold P, Olsson I, Oster E, Ottosson J, Paavilainen L, Persson A, Rimini R, Rockberg J, Runeson M, Sivertsson A, Sköllermo A, Steen J, Stenvall M, Sterky F, Strömberg S, Sundberg M, Tegel H, Tourle S, Wahlund E, Waldén A, Wan J, Wernérus H, Westberg J, Wester K, Wrethagen U, Xu LL, Hober S, Pontén F (2005) A human protein atlas for normal and cancer tissues based on antibody proteomics. Mol Cell Proteom 4:1920–1932. [DOI] [PubMed] [Google Scholar]
- 8. Uhlén M, Oksvold P, Fagerberg L, Lundberg E, Jonasson K, Forsberg M, Zwahlen M, Kampf C, Wester K, Hober S, Wernerus H, Björling L, Ponten F (2010) Towards a knowledge‐based human protein atlas. Nat Biotech 28:1248–1250. [DOI] [PubMed] [Google Scholar]
- 9. Fagerberg L, Hallström BM, Oksvold P, Kampf C, Djureinovic D, Odeberg J, Habuka M, Tahmasebpoor S, Danielsson A, Edlund K, Asplund A, Sjöstedt E, Lundberg E, Szigyarto CA, Skogs M, Takanen JO, Berling H, Tegel H, Mulder J, Nilsson P, Schwenk JM, Lindskog C, Danielsson F, Mardinoglu A, Sivertsson A, von Feilitzen K, Forsberg M, Zwahlen M, Olsson I, Navani S, Huss M, Nielsen J, Ponten F, Uhlén M (2014) Analysis of the human tissue‐specific expression by genome‐wide integration of transcriptomics and antibody‐based proteomics. Mol Cell Proteom 13:397–406. [DOI] [PMC free article] [PubMed] [Google Scholar]
- 10. Yates A, Akanni W, Amode MR, Barrell D, Billis K, Carvalho‐Silva D, Cummins C, Clapham P, Fitzgerald S, Gil L, Girón CG, Gordon L, Hourlier T, Hunt SE, Janacek SH, Johnson N, Juettemann T, Keenan S, Lavidas I, Martin FJ, Maurel T, McLaren W, Murphy DN, Nag R, Nuhn M, Parker A, Patricio M, Pignatelli M, Rahtz M, Riat HS, Sheppard D, Taylor K, Thormann A, Vullo A, Wilder SP, Zadissa A, Birney E, Harrow J, Muffato M, Perry E, Ruffier M, Spudich G, Trevanion SJ, Cunningham F, Aken BL, Zerbino DR, Flicek P (2016) Ensembl 2016. Nucleic Acids Res 44:D710–D716. [DOI] [PMC free article] [PubMed] [Google Scholar]
- 11. Nilsson P, Paavilainen L, Larsson K, Odling J, Sundberg M, Andersson AC, Kampf C, Persson A, Al‐Khalili Szigyarto C, Ottosson J, Björling E, Hober S, Wernérus H, Wester K, Pontén F, Uhlén M (2005) Towards a human proteome atlas: High‐throughput generation of mono‐specific antibodies for tissue profiling. Proteomics 5:4327–4337. [DOI] [PubMed] [Google Scholar]
- 12. Uhlén M, Bandrowski A, Carr S, Edwards A, Ellenberg J, Lundberg E, Rimm DL, Rodriguez H, Hiltke T, Snyder M, Yamamoto T (2016) A proposal for validation of antibodies. Nat Methods 13:823–827. [DOI] [PMC free article] [PubMed] [Google Scholar]
- 13. GTEx Consortium (2015) The Genotype‐Tissue Expression (GTEx) pilot analysis: Multitissue gene regulation in humans. Science 348:648–660. [DOI] [PMC free article] [PubMed] [Google Scholar]
- 14. Yu NY, Hallström BM, Fagerberg L, Ponten F, Kawaji H, Carninci P, Forrest AR, Fantom Consortium Hayashizaki Y, Uhlén M, Daub CO (2015) Complementing tissue characterization by integrating transcriptome profiling from the Human Protein Atlas and from the FANTOM5 consortium. Nucleic Acids Res 43:6787–6798. [DOI] [PMC free article] [PubMed] [Google Scholar]
- 15. Lindskog C (2015) The potential clinical impact of the tissue‐based map of the human proteome. Expert Rev Proteom 12:213–215. [DOI] [PubMed] [Google Scholar]
- 16. Lindskog C, Fagerberg L, Hallström B, Edlund K, Hellwig B, Rahnenführer J, Kampf C, Uhlén M, Pontén F, Micke P (2014) The lung‐specific proteome defined by integration of transcriptomics and antibody‐based profiling. faseb J 28:5184–5196. [DOI] [PubMed] [Google Scholar]
- 17. Kampf C, Mardinoglu A, Fagerberg L, Hallström BM, Edlund K, Lundberg E, Pontén F, Nielsen J, Uhlén M (2014) The human liver‐specific proteome defined by transcriptomics and antibody‐based profiling. faseb J 28:2901–2914. [DOI] [PubMed] [Google Scholar]
- 18. Djureinovic D, Fagerberg L, Hallström B, Danielsson A, Lindskog C, Uhlén M, Pontén F (2014) The human testis‐specific proteome defined by transcriptomics and antibody‐based profiling. Mol Human Reprod 20:476–488. [DOI] [PubMed] [Google Scholar]
- 19. Cancer Genome Atlas Research Network Weinstein JN, Collisson EA, Mills GB, Shaw KR, Ozenberger BA, Ellrott K, Shmulevich I, Sander C, Stuart JM (2013) The Cancer Genome Atlas Pan‐Cancer analysis project. Nat Genet 45:1113–1120. [DOI] [PMC free article] [PubMed] [Google Scholar]
- 20. Barbe L, Lundberg E, Oksvold P, Stenius A, Lewin E, Björling E, Asplund A, Pontén F, Brismar H, Uhlén M, Andersson‐Svahn H (2008) Toward a confocal subcellular atlas of the human proteome. Mol Cell Proteom 7:499–508. [DOI] [PubMed] [Google Scholar]
- 21. Sakaue‐Sawano A, Kurokawa H, Morimura T, Hanyu A, Hama H, Osawa H, Kashiwagi S, Fukami K, Miyata T, Miyoshi H, Imamura T, Ogawa M, Masai H, Miyawaki A (2008) Visualizing spatiotemporal dynamics of multicellular cell‐cycle progression. Cell 132:487–498. [DOI] [PubMed] [Google Scholar]
- 22. Stadler C, Hjelmare M, Neumann B, Jonasson K, Pepperkok R, Uhlén M, Lundberg E (2012) Systematic validation of antibody binding and protein subcellular localization using siRNA and confocal microscopy. J Proteom 75:2236–2251. [DOI] [PubMed] [Google Scholar]
- 23. Stadler C, Rexhepaj E, Singan VR, Murphy RF, Pepperkok R, Uhlén M, Simpson JC, Lundberg E (2013) Immunofluorescence and fluorescent‐protein tagging show high correlation for protein localization in mammalian cells. Nat Methods 10:315–323. [DOI] [PubMed] [Google Scholar]
- 24. Skogs M, Stadler C, Schutten R, Hjelmare M, Gnann C, Björk L, Poser I, Hyman A, Uhlén M, Lundberg E (2016) Antibody validation in bioimaging applications based on endogenous expression of tagged proteins. J Proteome Res 16:147–155. [DOI] [PubMed] [Google Scholar]
- 25. Stadler C, Skogs M, Brismar H, Uhlén M, Lundberg E (2010) A single fixation protocol for proteome‐wide immunofluorescence localization studies. J Proteom 73:1067–1078. [DOI] [PubMed] [Google Scholar]


