

Abstract
PDBsum is a web server providing structural information on the entries in the Protein Data Bank (PDB). The analyses are primarily image‐based and include protein secondary structure, protein‐ligand and protein‐DNA interactions, PROCHECK analyses of structural quality, and many others. The 3D structures can be viewed interactively in RasMol, PyMOL, and a JavaScript viewer called 3Dmol.js. Users can upload their own PDB files and obtain a set of password‐protected PDBsum analyses for each. The server is freely accessible to all at: http://www.ebi.ac.uk/pdbsum.
Keywords: PDBsum, protein structure analysis, PDB, protein database, 3D protein structure, schematic diagrams, molecular interactions, enzymes
Introduction
Between the inception of the Protein Data Bank1 (PDB) in 1971, and the emergence of the World Wide Web (WWW) in the early 1990s, the analysis of protein structures was a rather cumbersome business. The data for each experimentally determined structural model were available as text files deposited by the experimentalists. Viewing the structures was not a problem, as there were a number of molecular graphics viewers available at the time. However, finding entries of interest, or getting an idea of what was in the PDB, was far trickier and involved the nontrivial task of parsing the free‐form text of the PDB header records. As the numbers of structures grew, this became an increasingly unwieldy process, repeated in labs all over the world.
PDBsum2 was among the early web servers to take advantage of the new WWW technology by creating a catalog of the structural information in the PDB. It was developed at University College London (UCL) in 1995, and aimed to provide a largely pictorial compendium of the proteins and their complexes in the PDB. The illustrations included many structural analyses not available elsewhere. The other early servers included PDBBrowse,3 created by the curators of the PDB archive, which had a good search facility but which presented its results in text form only, with no pictures. The Swiss‐3Dimage collection4 and the IMB Jena Image Library of Biological Macromolecules5 focused on beautiful images of protein structures, while other databases specialized in particular aspects of structure—such as the fold classification systems of SCOP6 and CATH.7
The development of PDBsum continued at UCL8 until its transfer to the European Bioinformatics Institute (EBI) in 2001. Further improvements and additions have been made since then.9, 10, 11 Of course, the other servers have improved markedly also. The most powerful are run by two of the members of the wwPDB12—the consortium that currently runs the PDB archive. These are: the Research Collaboratory for Structural Bioinformatics13 (RCSB) with its server at http://www.rcsb.org,14 and PDB Europe (PDBe) with its server at https://www.ebi.ac.uk/pdbe.15 Both offer a comprehensive and detailed coverage of all PDB entries together with some powerful resources for structural analysis.
Here, we focus on PDBsum, describing its main features and principal differences from the other servers.
Features
Figures 1, 2, 3 illustrate some of the pictorial analyses presented in PDBsum. The example given is for PDB entry 5trd, a riboflavin kinase from Thermoplasma acidophilum, solved by X‐ray crystallography at 1.85Å resolution in 2016.16 The majority of the analyses use software developed in the Thornton Group over the past 25 years, initially at UCL and then at EBI.
Figure 1.
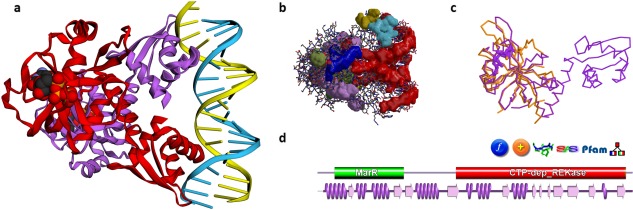
Some PDBsum analyses for PDB entry 5trd—a riboflavin kinase from Thermoplasma acidophilum. (A) Thumbnail image of the structure, as shown using 3Dmol.js on the entry's PDBsum page; (B) clefts in the structure, shown here as solid surfaces colored according to volume, with the largest shown in red; (C) 3D superposition based on a SAS sequence alignment between the 5trd protein, in purple, and, in orange, 2vbs, a partial structure comprising the first domain of riboflavin kinase from Methanocaldococcus jannaschii; d. domain representation of the 5trd protein, with the small purple wiring diagram underneath representing the protein's structural coverage, and the various icons above it leading to further analyses, as described in the main text.
Figure 2.
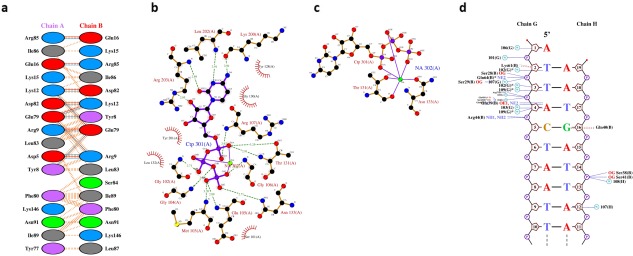
PDBsum's interaction plots for PDB entry 5trd. (A) Plot of hydrogen bonds (blue lines), nonbonded contacts (orange tick‐marks), and salt bridges (red lines) between residues on either side of the protein‐protein interface; (B) LIGPLOT diagram showing the protein residues that interact with the CTP (cytidine‐5′‐triphosphate) ligand, with hydrogen bonds shown by the green dashed lines and nonbonded contacts by the brown rays, and; (C) as in (B), but for residues interacting with the bound sodium ion; (D) NUCPLOT diagram of protein‐DNA interactions, with H‐bonds as blue dashed lines and nonbonded contacts as brown dashed lines.
Figure 3.
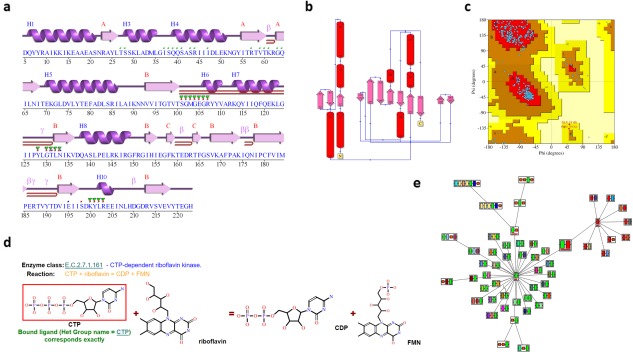
More PDBsum analyses for PDB entry 5trd. (A) Schematic “wiring diagram” of the protein's secondary structure—including strands (pink arrows), helices (purple springs), and other motifs in red (e.g., β‐hairpins, γ‐turns, etc); (B) schematic diagram illustrating the protein's topology in terms of how the β‐strands (pink arrows) are arranged into β‐sheets, and the relative disposition of the α‐helices (red cylinders); (C) Ramachandran plot from PROCHECK showing the distribution of the protein's main chain φ‐ψ torsion angles (blue squares) relative to the “core” (red) and “allowed” (brown) regions, with residues falling in the “generously allowed” (dark yellow) and “disallowed” (pale yellow) regions plotted as red squares and labeled; (D) enzyme reaction diagram for E.C. 2.7.1.161 showing the reactants and products involved. The substrate molecule, CTP, is highlighted in red as it is present in the 5trd structure; (E) ArchSchema network of related domain architectures, the enlarged, gray box representing the two‐domain architecture of 5trd (green and red boxes), and the other architectures featuring either the green or red domains.
Pictorial overviews
Figure 1(A) shows the thumbnail view of the 5trd entry as given on the entry's PDBsum page. Previously the images were static ones, generated using the PyMOL molecular graphics program,17 but have recently been replaced by a JavaScript molecular viewer called 3Dmol.js,18 developed at the University of Pittsburgh School of Medicine. The thumbnail can be rotated and zoomed for a better view. There are also options to view the rendered structure in other molecular viewers: RasMol,19 Jmol,20 PyMOL, Strap,21 and a pop‐up version of the 3Dmol.js viewer.
Figure 1(B,C) show two other views of the 3D structure. The first [Fig. 1(B)] depicts surface clefts as solid colored regions. PDBsum uses the SURFNET program22 to calculate cleft regions, coloring them according to their relative volume. The largest cleft is colored red, and often turns out to be the protein's binding site.23 This automatically generated image only gives a rough idea of the sizes and locations of the clefts. A better depiction can be obtained using the RasMol or Jmol options on the Clefts page to get an interactive version of the structure and its clefts.
The image in Figure 1(C) is a structural superposition of the 5trd protein with one of its homologs in the PDB. Related proteins can be found using the Sequences Annotated by Structure24 (SAS) server, either via the SAS links in PDBsum [e.g., the SAS icon in Fig. 1(D)], or by going directly to the server at http://www.ebi.ac.uk/thornton-srv/databases/sas. SAS uses FASTA25 to perform a sequence search of the protein's sequence against all those in the PDB, returning an alignment annotated by structural features (such as residues involved in ligand binding, residue similarity, etc). The matched PDB entries can be superposed and viewed in RasMol or Jmol, as in Figure 1(C).
Protein domains
Most proteins comprise one or more domains, defined either in terms of sequence, as is done by Pfam,26 or structure, as is done by CATH27 and SCOP.28 The combination of a protein's domains is its “domain architecture”, with some architectures being particularly common while others are rare. PDBsum shows both the Pfam [Fig. 1(D)] and CATH domains, where known. The protein in the 5trd entry contains two Pfam domains: one belonging to the MarR family (involved in DNA‐binding, shown in green), and the other a CTP‐dependent riboflavin kinase domain (red). Clicking either of these takes you to a list of other proteins in the PDB containing that domain. The small domain diagram [Fig. 1(D)], found on the PDB entry's home page, also shows a miniature version (in purple) of the secondary structure diagram of Figure 3(A). This provides an idea of the “structural coverage” of the PDB entry—that is, how much of the protein sequence is actually represented by the 3D structure. In many cases, only a part of the protein can be structurally characterized, perhaps just a single domain. Clicking on the orange “+” icon, just above the domain diagram in Figure 1(D), lists all other PDB entries for the same protein. Sometimes this can let you find a more complete structure if the entry you are looking at is only a partial one.
Interactions
Figure 2(A–C) show a protein‐protein, protein‐ligand, and protein‐metal interaction diagram for entry 5trd, respectively. These are generated using the HBPLUS29 and LIGPLOT30 programs. The protein‐DNA plot in Figure 2(D) is created with NUCPLOT.31 In each plot, the interactions shown are hydrogens bonds and nonbonded contacts.
Secondary structure
The protein's secondary structure assignments and topology diagram [Fig. 3(A,B)] are computed using PROMOTIF32 and HERA,33 respectively. Additional plots, not shown in this figure, depict other structural motifs computed by PROMOTIF, such as β‐ and γ‐turns, β‐hairpins and β‐bulges.
PROCHECK analysis
PDBsum also includes a full PROCHECK34 assessment of each protein's geometry, highlighting regions that are in some way unusual (and possibly wrong). The Ramachandran plot [Fig. 3(C)], for example, can quickly indicate how many of the structure's residues lie in “disallowed” conformations, thus providing an idea of its overall quality.
Enzyme reaction
If the protein is an enzyme, as is the case for entry 5trd, a reaction diagram is shown [Fig. 3(D)] as obtained from the Kyoto Encyclopedia of Genes and Genomes35 (KEGG). The diagram shows the reactant molecules operated on by the enzyme and the resultant products. If any of the molecules corresponds to one of the ligands bound to the protein structure they are highlighted by a red box. In Figure 3(D), the CTP reactant molecule (cytidine‐5′‐triphosphate) is boxed in red, indicating this molecule is present in the 5trd structure. Where the ligand is not an exact match, but is similar to one of the reaction molecules, the molecule is enclosed by a blue box and a similarity score reported.
Domain architecture
As mentioned above, the 5trd protein has a domain architecture comprising two Pfam domains. Figure 3(E) shows a network of related architectures, each containing one or other of these two domains, either on their own or in combinations with others. The plot is a dynamic one, generated by the ArchSchema36 program. The enlarged node just above the center in Figure 3(E) represents the architecture of the 5trd protein, with the green and red boxes corresponding to its two domains. To the left are architectures involving the green MarR domain, and to the right are those containing the red kinase domain. Three types of satellite nodes can be added to the diagram. The first type represent proteins in UniProt37 having the particular domain architecture, the second type are PDB entries, and the third are enzyme classes.
Other analyses
Other analyses performed by PDBsum, but not shown in Figures 1, 2, 3, include calculation of protein pores and tunnels by the Mole 2.0 program,38 and validation of any bound ligands by MotiveValidator.39 The latter checks ligand molecules for completeness, atom naming discrepancies, and chirality issues, linking to ValidatorDB40 for interactive viewing of possible errors.
Data download
Although the majority of the PDBsum analyses are pictorial, it is straightforward to access the raw data for further analysis if required. All data are stored in simple text files that can be accessed over the web using a utility such as wget. PDBsum's documentation describes some of these files, but further information can be requested from the authors. PDBsum has a Downloads page where some of the information across the entire database can be downloaded (e.g., ligands, E.C. numbers, and so on).
User‐submitted structures
Users can upload their own structures for analysis via the Generate link on the PDBsum home page. A unique PDB code and password are e‐mailed when the analyses are complete, giving access to a set of PDBsum pages with all the features described above. This may be particularly useful for newly solved structural models, prior to their submission to the PDB, or for analysis of a homology built model or docked complex. The uploaded file must be in correct PDB format. For space reasons, the results are deleted after roughly 3 months.
Shortcomings
One current problem with PDBsum is that its programs, many of which were written many years ago, can only handle PDB‐format files. Some of the newer, very large structures deposited in the PDB, such as complete ribosomes, are beyond the capability of the old file format and so cannot be processed by PDBsum. For these, users are redirected to the PDBe and RCSB web servers instead.
Related servers
PDBsum forms the core for several other Thornton Group servers, including the SAS and ArchSchema servers already mentioned. Two of the others are essentially subsets of PDBsum. The first is the Enzyme Structures Database, or EC→PDB, which classes all enzymes in the PDB according to the Enzyme Commission (E.C.) hierarchy, allowing one to browse from the highest E.C. class down to the list of PDB entries at each of the lowest subclasses. The E.C. assignments are obtained from SIFTS.41 The second server is DrugPort which identifies all “drug targets” in the PDB and any drug molecules that occur as ligands in PDB structures. The drug targets are as defined by the DrugBank42 database.
Next, the ProFunc server43 takes submitted protein structures and suggests possible functions for them. It uses a cocktail of sequence‐ and structure‐based methods to identify similar proteins at either a global or local level. The known functions of the matched proteins may provide clues to the function of the query, particularly when several different methods are in agreement. A PDBsum page is generated for every structure submitted to ProFunc.
Finally, LigSearch predicts small molecule ligands that might bind to a given protein (submitted as a sequence or structure). It, too, is intimately linked to PDBsum.
Conclusion
Although now somewhat long in the tooth, and superseded in many respects by the intensively developed servers of the RCSB and PDBe, the PDBsum server still has some useful and unique features to offer. Perhaps of particular use is the facility allowing users to submit their own structures and retrieve a full set of PDBsum analyses, including full PROCHECK results, interaction plots, and domain architecture networks. The server is freely available at http://www.ebi.ac.uk/pdbsum.
Conflict of interests
None declared.
Summary: PDBsum is an atlas of proteins for which a 3D structural model has been obtained by experiment. For each, it provides a number of schematic diagrams to visualize different aspects of the protein molecule(s) in the structure, together with the molecules they interact with (e.g., bound ligands or RNA/DNA).
References
- 1. Bernstein FC, Koetzle TF, Williams GJ, Meyer EF, Jr , Brice MD, Rodgers JR, Kennard O, Shimanouchi T, Tasumi M (1977) The Protein Data Bank: a computer‐based archival file for macromolecular structures. J Mol Biol 112:535–542. [DOI] [PubMed] [Google Scholar]
- 2. Laskowski RA, Hutchinson EG, Michie AD, Wallace AC, Jones ML, Thornton JM (1997) PDBsum: a Web‐based database of summaries and analyses of all PDB structures. Trends Biochem Sci 22:488–490. [DOI] [PubMed] [Google Scholar]
- 3. Stampf DR, Felder CE, Sussman JL (1995) PDBbrowse–a graphics interface to the Brookhaven Protein Data Bank. Nature 374:572–574. [DOI] [PubMed] [Google Scholar]
- 4. Peitsch MC, Wells TN, Stampf DR, Sussman JL (1995) The Swiss‐3DImage collection and PDB‐Browser on the World‐Wide Web. Trends Biochem Sci 20:82–84. [DOI] [PubMed] [Google Scholar]
- 5. Suhnel J (1996) Image library of biological macromolecules. Comput Appl Biosci 12:227–229. [DOI] [PubMed] [Google Scholar]
- 6. Murzin AG, Brenner SE, Hubbard T, Chothia C (1995) SCOP: a structural classification of proteins database for the investigation of sequences and structures. J Mol Biol 247:536–540. [DOI] [PubMed] [Google Scholar]
- 7. Orengo CA, Michie AD, Jones S, Jones DT, Swindells MB, Thornton JM (1997) CATH: a hierarchic classification of protein domain structures. Structure 5:1093–1108. [DOI] [PubMed] [Google Scholar]
- 8. Laskowski RA (2001) PDBsum: summaries and analyses of PDB structures. Nucleic Acids Res 29:221–222. [DOI] [PMC free article] [PubMed] [Google Scholar]
- 9. Laskowski RA, Chistyakov VV, Thornton JM (2005) PDBsum more: new summaries and analyses of the known 3D structures of proteins and nucleic acids. Nucleic Acids Res 33:D266–D268. [DOI] [PMC free article] [PubMed] [Google Scholar]
- 10. Laskowski RA (2009) PDBsum new things. Nucleic Acids Res 37:D355–D359. [DOI] [PMC free article] [PubMed] [Google Scholar]
- 11. de Beer TA, Berka K, Thornton JM, Laskowski RA (2014) PDBsum additions. Nucleic Acids Res 42:D292–D296. [DOI] [PMC free article] [PubMed] [Google Scholar]
- 12. Berman H, Henrick K, Nakamura H, Markley JL (2007) The worldwide Protein Data Bank (wwPDB): ensuring a single, uniform archive of PDB data. Nucleic Acids Res 35:D301–D303. [DOI] [PMC free article] [PubMed] [Google Scholar]
- 13. Berman HM, Westbrook J, Feng Z, Gilliland G, Bhat TN, Weissig H, Shindyalov IN, Bourne PE (2000) The Protein Data Bank. Nucleic Acids Res 28:235–242. [DOI] [PMC free article] [PubMed] [Google Scholar]
- 14. Rose PW, Prlic A, Altunkaya A, Bi C, Bradley AR, Christie CH, Costanzo LD, Duarte JM, Dutta S, Feng Z, Green RK, Goodsell DS, Hudson B, Kalro T, Lowe R, Peisach E, Randle C, Rose AS, Shao C, Tao YP, Valasatava Y, Voigt M, Westbrook JD, Woo J, Yang H, Young JY, Zardecki C, Berman HM, Burley SK (2017) The RCSB protein data bank: integrative view of protein, gene and 3D structural information. Nucleic Acids Res 45:D271–D281. [DOI] [PMC free article] [PubMed] [Google Scholar]
- 15. Velankar S, van Ginkel G, Alhroub Y, Battle GM, Berrisford JM, Conroy MJ, Dana JM, Gore SP, Gutmanas A, Haslam P, et al. (2016) PDBe: improved accessibility of macromolecular structure data from PDB and EMDB. Nucleic Acids Res 44:D385–D395. [DOI] [PMC free article] [PubMed] [Google Scholar]
- 16. Rodionova IA, Vetting MW, Li X, Almo SC, Osterman AL, Rodionov DA (2017) A novel bifunctional transcriptional regulator of riboflavin metabolism in Archaea. Nucleic Acids Res 45:3785–3799. [DOI] [PMC free article] [PubMed] [Google Scholar]
- 17. DeLano WL (2002) The PyMOL Molecular Graphics System. Palo Alto, CA: DeLano Scientific. [Google Scholar]
- 18. Rego N, Koes D (2015) 3Dmol.js: molecular visualization with WebGL. Bioinformatics 31:1322–1324. [DOI] [PMC free article] [PubMed] [Google Scholar]
- 19. Sayle RA, Milner‐White EJ (1995) RASMOL: biomolecular graphics for all. Trends Biochem Sci 20:374. [DOI] [PubMed] [Google Scholar]
- 20. Herraez A (2006) Biomolecules in the computer: Jmol to the rescue. Biochem Mol Biol Educ 34:255–261. [DOI] [PubMed] [Google Scholar]
- 21. Gille C, Frommel C (2001) STRAP: editor for structural alignments of proteins. Bioinformatics 17:377–378. [DOI] [PubMed] [Google Scholar]
- 22. Laskowski RA (1995) SURFNET: a program for visualizing molecular surfaces, cavities, and intermolecular interactions. J Mol Graph 13:323–330, 307–308. [DOI] [PubMed] [Google Scholar]
- 23. Laskowski RA, Luscombe NM, Swindells MB, Thornton JM (1996) Protein clefts in molecular recognition and function. Protein Sci 5:2438–2452. [DOI] [PMC free article] [PubMed] [Google Scholar]
- 24. Milburn D, Laskowski RA, Thornton JM (1998) Sequences annotated by structure: a tool to facilitate the use of structural information in sequence analysis. Protein Eng 11:855–859. [DOI] [PubMed] [Google Scholar]
- 25. Pearson WR (1990) Rapid and sensitive sequence comparison with FASTP and FASTA. Methods Enzymol 183:63–98. [DOI] [PubMed] [Google Scholar]
- 26. Finn RD, Coggill P, Eberhardt RY, Eddy SR, Mistry J, Mitchell AL, Potter SC, Punta M, Qureshi M, Sangrador‐Vegas A, et al. (2016) The Pfam protein families database: towards a more sustainable future. Nucleic Acids Res 44:D279–D285. [DOI] [PMC free article] [PubMed] [Google Scholar]
- 27. Sillitoe I, Lewis TE, Cuff A, Das S, Ashford P, Dawson NL, Furnham N, Laskowski RA, Lee D, Lees JG, et al. (2015) CATH: comprehensive structural and functional annotations for genome sequences. Nucleic Acids Res 43:D376–D381. [DOI] [PMC free article] [PubMed] [Google Scholar]
- 28. Andreeva A, Howorth D, Chothia C, Kulesha E, Murzin AG (2014) SCOP2 prototype: a new approach to protein structure mining. Nucleic Acids Res 42:D310–D314. [DOI] [PMC free article] [PubMed] [Google Scholar]
- 29. McDonald IK, Thornton JM (1994) Satisfying hydrogen bonding potential in proteins. J Mol Biol 238:777–793. [DOI] [PubMed] [Google Scholar]
- 30. Wallace AC, Laskowski RA (1995) Thornton JM. LIGPLOT: a program to generate schematic diagrams of protein‐ligand interactions. Protein Eng 8:127–134. [DOI] [PubMed] [Google Scholar]
- 31. Luscombe NM, Laskowski RA, Thornton JM (1997) NUCPLOT: a program to generate schematic diagrams of protein‐nucleic acid interactions. Nucleic Acids Res 25:4940–4945. [DOI] [PMC free article] [PubMed] [Google Scholar]
- 32. Hutchinson EG, Thornton JM (1996) PROMOTIF–a program to identify and analyze structural motifs in proteins. Protein Sci 5:212–220. [DOI] [PMC free article] [PubMed] [Google Scholar]
- 33. Hutchinson EG, Thornton JM (1990) HERA–a program to draw schematic diagrams of protein secondary structures. Proteins 8:203–212. [DOI] [PubMed] [Google Scholar]
- 34. Laskowski RA, MacArthur MW, Moss DS, Thornton JM (1993) PROCHECK ‐ a program to check the stereochemical quality of protein structures. J Appl Cryst 26:283–291. [Google Scholar]
- 35. Kanehisa M, Furumichi M, Tanabe M, Sato Y, Morishima K (2017) KEGG: new perspectives on genomes, pathways, diseases and drugs. Nucleic Acids Res 45:D353–D361. [DOI] [PMC free article] [PubMed] [Google Scholar]
- 36. Tamuri AU, Laskowski RA (2010) ArchSchema: a tool for interactive graphing of related Pfam domain architectures. Bioinformatics 26:1260–1261. [DOI] [PubMed] [Google Scholar]
- 37. The UniProt C (2017) UniProt: the universal protein knowledgebase. Nucleic Acids Res 45:D158–D169. [DOI] [PMC free article] [PubMed] [Google Scholar]
- 38. Sehnal D, Svobodova Varekova R, Berka K, Pravda L, Navratilova V, Banas P, Ionescu CM, Otyepka M, Koca J (2013) MOLE 2.0: advanced approach for analysis of biomacromolecular channels. J Cheminform 5:39. [DOI] [PMC free article] [PubMed] [Google Scholar]
- 39. Varekova RS, Jaiswal D, Sehnal D, Ionescu CM, Geidl S, Pravda L, Horsky V, Wimmerova M, Koca J (2014) MotiveValidator: interactive web‐based validation of ligand and residue structure in biomolecular complexes. Nucleic Acids Res 42:W227–W233. [DOI] [PMC free article] [PubMed] [Google Scholar]
- 40. Sehnal D, Svobodova Varekova R, Pravda L, Ionescu CM, Geidl S, Horsky V, Jaiswal D, Wimmerova M, Koca J (2015) ValidatorDB: database of up‐to‐date validation results for ligands and non‐standard residues from the Protein Data Bank. Nucleic Acids Res 43:D369–D375. [DOI] [PMC free article] [PubMed] [Google Scholar]
- 41. Velankar S, Dana JM, Jacobsen J, van Ginkel G, Gane PJ, Luo J, Oldfield TJ, O'Donovan C, Martin MJ, Kleywegt GJ (2013) SIFTS: structure integration with function, taxonomy and sequences resource. Nucleic Acids Res 41:D483–D489. [DOI] [PMC free article] [PubMed] [Google Scholar]
- 42. Law V, Knox C, Djoumbou Y, Jewison T, Guo AC, Liu Y, Maciejewski A, Arndt D, Wilson M, Neveu V, et al. (2014) DrugBank 4.0: shedding new light on drug metabolism. Nucleic Acids Res 42:D1091–D1097. [DOI] [PMC free article] [PubMed] [Google Scholar]
- 43. Laskowski RA, Watson JD, Thornton JM (2005) ProFunc: a server for predicting protein function from 3D structure. Nucleic Acids Res 33:W89–W93. [DOI] [PMC free article] [PubMed] [Google Scholar]