Abstract
Purpose
The limited number of 3D patient‐based breast phantoms available could be augmented by synthetic breast phantoms in order to facilitate virtual clinical trials (VCTs) using model observers for breast imaging optimization and evaluation.
Methods
These synthetic breast phantoms were developed using Principal Component Analysis (PCA) to reduce the number of dimensions needed to describe a training set of images. PCA decomposed a training set of M breast CT volumes (with millions of voxels each) into an M‐1‐dimensional space of eigenvectors, which we call eigenbreasts. Each of the training breast phantoms was compactly represented by the mean image plus a weighted sum of eigenbreasts. The distribution of weights observed from training was then sampled to create new synthesized breast phantoms.
Results
The resulting synthesized breast phantoms demonstrated a high degree of realism, as supported by an observer study. Two out of three experienced physicist observers were unable to distinguish between the synthesized breast phantoms and the patient‐based phantoms. The fibroglandular density and noise power law exponent of the synthesized breast phantoms agreed well with the training data.
Conclusions
Our method extends our series of digital breast phantoms based on breast CT data, providing the capability to generate new, statistically varying ensembles consisting of tens of thousands of virtual subjects. This work represents an important step toward conducting future virtual trials for task‐based assessment of breast imaging, where it is vital to have a large ensemble of realistic phantoms for statistical power as well as clinical relevance.
Keywords: breast phantoms, eigenbreasts, mammography, tomosynthesis, virtual clinical trials
1. Introduction
1.A. Virtual clinical trials
Enrolling patients in clinical trials for medical imaging is time consuming, costly, and difficult. Thus, there is considerable interest in conducting virtual trials as an alternative method for the optimization and assessment of medical imaging systems.1, 2
Typically, virtual clinical trials (VCTs) consist of three main parts: virtual patients, a virtual imaging system, and a set of virtual radiologists. Computerized phantoms modeling the human anatomy and physiology can serve as the virtual patients. The virtual imaging system is provided by computer algorithms that model the imaging physics, acquisition, and reconstruction which enables simulation of image data from the patient models. Finally, model observers implement a task‐based statistical assessment approach to analyze the simulated data thereby serving as the virtual radiologists.
Similar to an actual clinical trial, a large number of virtual patients or phantoms are needed to achieve the desired statistical power. In addition, the phantoms must provide a realistic representation of the background anatomy and include accurate lesion models; otherwise, the results obtained from them would not be indicative of clinical reality. The work presented here demonstrates a method to generate large numbers of realistic virtual breast phantoms from a limited number of training cases. This represents an important step toward conducting VCTs to rigorously evaluate three‐dimensional (3D) breast imaging systems.
1.B. Previous breast models
In previous work, we have presented a population of breast phantoms based on segmented breast CT (bCT) data3 (seen in Fig. 1) and a method to deform the phantoms to achieve a realistic compressed shape using Finite Element (FE) analysis.4 Since the phantoms were developed from segmented bCT data, they have a high level of anatomical realism. However, clinical bCT data is still not widely available and the segmentation process is computationally expensive. Thus, it is difficult to directly scale‐up these patient‐based breast phantoms for VCTs, where large quantities of phantoms would be necessary to tune the model observers and account for nonstationary of the data statistics over different locations with‐in the breast.5, 6, 7
Figure 1.
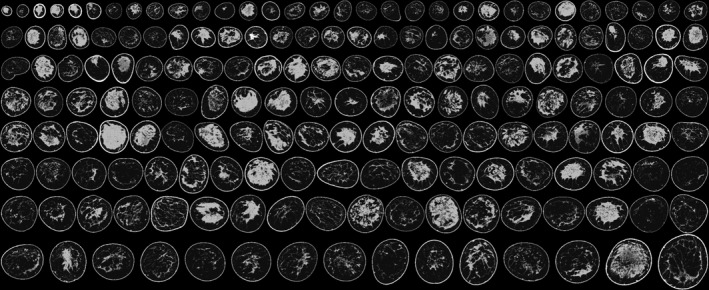
Population of existing breast phantoms developed from segmenting breast CT data into six materials. The segmentations are displayed as a middepth coronal slice and ordered from small to large.
Here, we present methods to extend these breast phantoms and create large ensembles of synthesized virtual subjects based on smaller training sets of subjects. Large ensembles of realistic phantoms would enable future virtual trials for task‐based assessment of breast imaging with appropriate statistical power and clinical relevance.
Other popular breast phantoms have used anatomically informed geometric rules to generate large populations of virtual models. Bakic developed a widely used rule‐based breast phantom with a breast tissue model composed of a large scale tissue region model, adipose compartment model, and breast ductal network model.8 This compartment model has also been extended to replace some of the adipose compartments with a power law noise model.9 A more complex breast phantom has recently been presented that models breast shape, glandular tissue compartments, ductal network, interglandular fat lobules, Cooper's ligaments, vasculature, and compression.10 The advantage of these rule‐based phantoms is infinite mathematical diversity and relatively fast computational speed.
1.C. Eigenanalysis
Principal Component Analysis (PCA) is a statistical technique used to reduce the dimensionality of a dataset and identify the principal modes of variation. Here, PCA was used to decompose a set of M training images into orthonormal principal components or basis images such that the kth eigenvalue, λ k ,
| (1) |
is maximized subject to the orthonormal condition on the eigenvectors, u k
| (2) |
This eigen decomposition is applied to a covariance matrix C built from the training set of images, which are first rearranged from a 3D image to a vector.
| (3) |
where Φ i is the difference between each training image , and the average of the training images, Ψ,
| (4) |
The original training images, Γ i , can be represented efficiently by the mean image Ψ, and a vector of M−1 weighting factors, w i , applied to the eigenvectors.
| (5) |
The eigenvectors form a subspace of the entire image space where images similar to the training images are clustered.
This idea of applying PCA to images was popularized for use in facial recognition by Turk and Pentland, which can be referenced for additional implementation details.11 They referred to the eigenvectors from a training set of face images as eigenfaces. In a similar manner, we refer to eigenbreasts for our application in breast phantoms.12
PCA has also become widely utilized in computer vision and medical imaging for statistical shape13 and active appearance models.14 There has been limited use of PCA to generate synthetic medical images. Rose and Taylor (who helped pioneer statistical shape and active appearance models) performed PCA on a small number of low resolution mammograms to develop a generative model of mammographic appearance using a steerable pyramid decomposition.15 Berks et al. also used PCA to simulate breast masses.16 To the best of our knowledge, this is the first study where PCA was performed on a large training set of 3D patient based breast phantoms. The use of 3D breast phantoms contains additional structural information that is not present in mammography. This separation of structural information along with the use of clean segmented images allowed for the use of PCA directly in contrast to the decomposition required for mammographic images by Rose and Taylor.
2. Methods
2.A. Existing set of breast phantoms
The training set selected from our existing population of patient‐based breast phantoms3 represents a diverse range of breast sizes and fibroglandular densities as seen in Table 1.
Table 1.
Distribution of volume and fibroglandular density of the 177 breast phantoms used in training
| Min | Max | Mean | Std. | |
|---|---|---|---|---|
| Volume (mL) | 25 | 1576 | 613 | 285 |
| Fibroglandular density (%) | 4.3 | 61.6 | 20.8 | 12.4 |
These breast phantoms represented the fibroglandular tissue with four tissue classes in addition to adipose and skin classes. The material classes were arranged from least to most attenuating where the intermediate classes were defined to have compositions of 25%, 50%, 75%, and 100% fibroglandular tissue. These material classes were represented in the phantoms with six integer intensities as seen in Table 2.
Table 2.
Breast phantom material classes
| 1 | 2 | 3 | 4 | 5 | 6 |
|---|---|---|---|---|---|
| Adipose | 25/75 | 50/50 | 75/25 | 100/0 | Skin |
| Where x/x represents fibroglandular/adipose | |||||
The fibroglandular density of the breast phantom was calculated as:
| (6) |
where V i indicates the volume of tissue designated as belonging to class i and V breast represents the volume of the breast excluding the skin.
2.B. Template compressed breasts
To facilitate PCA, the overall size and shape variation had to be controlled. The presence or absence of breast tissue in corresponding areas, due to differences in size and shape, would dominate the eigen analysis and corrupt the texture differences we are interested in. Thus, the differences in overall size and shape were removed by mapping all the breasts to a consistent (template) breast geometry. However, since the breast volume varied so greatly, it was deemed more appropriate to create multiple subgroups of patients rather than mapping small and large breasts to a single size. The template breast was essentially the outer shell of a typical breast selected from each of the subgroups of breast phantoms.
The template breasts were deformed to a compressed geometry, using the finite element method described in Sturgeon et al.4 This compressed geometry would facilitate use in VCTs for breast tomosynthesis or mammography. Details of the mapping between the patient and template geometries will be described in Section 2.D.
2.C. Size/density clusters
In order to determine how to group the breast phantoms with template shapes of various compressed thicknesses it was necessary to approximate the compressed thickness of the breast phantoms. Information on compressed thickness was not available for the bCT dataset that the phantoms were base on.
The relationship between compressed thickness (breast size) and fibroglandular density has been well established through the work of Dance et al.17 When grouping the breast phantoms, we decided to include breast density and target points on the Dance curve at compressed thicknesses of 5, 6, 7, and 8 cm to serve as the centers of our groups. We refer to these clusters centered at points on the Dance curve as size/density clusters. As a surrogate for compressed thickness, the mean breast thickness was scaled by a constant factor, determined empirically, to achieve the best fit between our data and that observed by Dance et al.
Each size/density cluster was selected to contain the 40 nearest neighbors to a point on the Dance curve corresponding to target thickness. The fibroglandular density and breast thickness were both normalized based on the observed ranges prior to calculating distances between the training cases and the target cluster centers. The choice to use a quantity of 40 training cases per cluster was influenced by the availability and distribution of the training cases along with memory limitations when computing the eigenbreasts.
Since breast density tends to decrease after menopause, Dance et al. used two separate age groups to represent the premenopausal and postmenopausal women. We used the curve for the younger age group. This would result in denser breasts at a given compressed thickness, which would in turn yield a more challenging detection task.
2.D. Mapping to the template shapes
Each breast in the size/density cluster was mapped to the corresponding compressed template shape. This removed the size and shape variation within the cluster. The mapping was performed utilizing the mesh scheme developed for our finite element modeling application, which automatically discretized the domain (interior volume) of a given breast phantom with a hexahedral mesh consisting of approximately 60,000 elements.4 This essentially created point correspondences and facilitated an element‐by‐element mapping between the current uncompressed breast and the desired compressed shape.
When mapping from the segmented bCT to a compressed template shape, it was important to consider breast geometry. Of our initial set of 200 phantoms, 23 were excluded due to geometric issues including: the breast bottoming out (10), prominent concavities (12) or motion artifacts (1).
2.E. Eigen analysis for statistical breast phantoms
Once each cluster of breast phantoms was mapped to a consistent shape, the size and shape variation had been removed. So, the variation in anatomical textures within each cluster could then be analyzed through PCA. The MATLAB (MathWorks, Natick, MA, USA) function eig was used to perform the PCA, comparable functions are available in other scientific computing packages. This provides orthonormal basis image volumes (eigenbreasts), which can compactly represent the training set of images and their variation. Recall from Eq. (5) that each of the training images could be represented efficiently in the M−1 dimensional eigenspace as a weighted sum of the eigenbreasts and the mean image. This can be represented graphically as seen in Fig. 2.
Figure 2.

Graphical representation of Eq. (5), showing that any of the training images could be represented as a weighted sum of the eigenbreasts and the mean image. For illustration, a simple projection of the volumetric images was shown.
The eigenbreasts are the orthogonal basis images, which represent the principal modes of variation observed in the training set of breast phantoms. Due to the orthogonality, the eigenbreasts can also be thought of as the axes of a high dimensional eigenspace. The weights, representing the training images, form a cluster in M−1‐dimensions, which can be thought of as the ‘breastspace’ or an area in the eigenspace where breast‐like objects could be found. New weights corresponding to new breast phantoms were obtained by sampling the weighting factors observed in the training set of breast phantoms. The weighting factors were assumed to have a normal distribution, where the mean and standard deviation observed in the training set were used as an estimate for the population. The distribution of the newly synthesized breast phantoms can be represented in the ‘breastspace’ as illustrated in Fig. 3.
Figure 3.
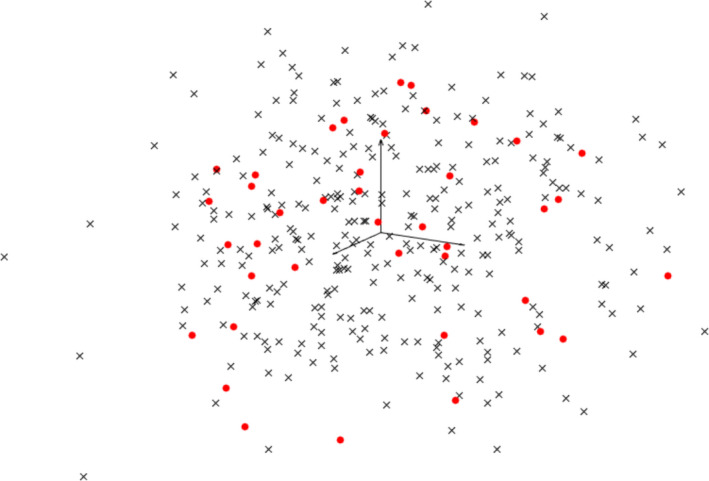
Simplified illustration of the 39‐D eigenspace (shown as a projection to the first 3 eigenvectors/eigenbreasts). Weights corresponding to the training image are shown as dots along with 300 synthesized cases shown as x's. [Color figure can be viewed at wileyonlinelibrary.com]
Ordinarily, neighboring points in the eigenspace would not necessarily correspond to breasts of similar densities. To help improve the grouping by breast density, the breast composition (percentage of voxels in each fibroglandular level) was concatenated to the vector of voxel intensities per phantom, prior to the eigen decomposition. The breast composition terms were also used to threshold the float image (created from sampling the eigenspace) while enforcing the desired distribution of fibroglandular classes.
One‐hundred and fifty new breast phantoms were created for each of the four clusters, resulting in a total of 600 statistically generated (synthesized) breast phantoms.
2.F. Validation of the synthesized breast phantoms
2.F.1. Fibroglandular density
The synthesized breast phantoms should have a similar distribution of fibroglandular density as the training set. To verify this, a Student's t‐test was performed for each cluster.
2.F.2. Noise power spectra
It has been shown that the anatomical noise in mammographic images have a noise power spectra (NPS) that can be modeled by a power law: .18 Despite its limitations,19 β has been used as a measure of realism or a metric to compare breast phantoms to breast imaging data.20, 21, 22 We will continue is use.
Rather than determining the β for projection images, we have compared the 3D power law noise of the phantoms in order to validate their utility for tomographic imaging as well as mammography. The β to describe anatomical noise in bCT has a β bCT = β mammo − 1 relationship to the β of mammography.23 To determine the power law exponent β, the 3D NPS was measured in the phantoms for 50 cubic VOIs, with an edge length of 16 mm, randomly placed to lie entirely within the breast. The power law was fit to the NPS over frequencies from 0.07 to 0.45 cycles/mm.
2.F.3. Realism/observer study
To validate the appearance and realism of the statistically generated breast phantoms, a two‐alternative forced‐choice (2AFC) observer study was conducted with three medical physicists/senior medical imaging researchers. In this study, participants were shown ROIs, 3.8 cm by 3.8 cm, of pseudo mammographic projections (parallel projections without x‐ray physics) and informed that one image came from a phantom based on real patient data and the other from a statistically generated model. They were then asked to choose which image was from the real patient data.
The four size/density clusters were treated as separate observer studies such that the thickness and fibroglandular densities were consistent within each study. Each observer study consisted of 40 pairs of patient‐based and statistically generated phantoms.
3. Results
3.A. Size/density clusters
A scaling factor of 0.81 was found to provide the best fit between our phantoms and the cubic relationship between breast thickness and fibroglandular density observed by Dance et al.17 as seen in Fig. 4. This scaling factor was used to provide an estimate of the compressed thickness based on the mean uncompressed thickness of the breast.
Figure 4.
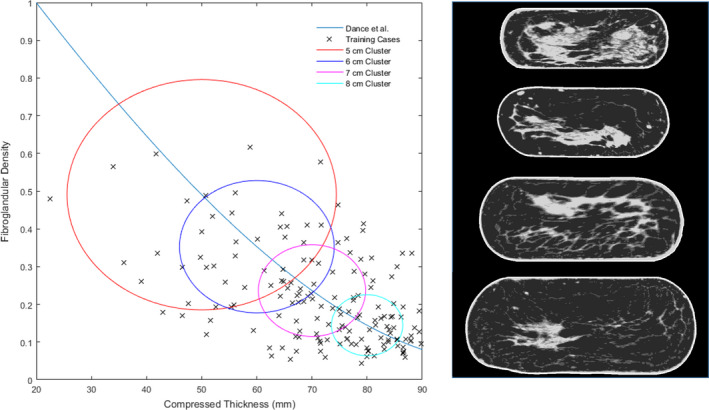
The 4 size/density clusters are shown along with a sample case from each cluster mapped to their corresponding compressed template at thicknesses of 5, 6, 7, and 8 cm. The relationship between breast thickness and fibroglandular density observed by Dance et al. is also shown. [Color figure can be viewed at wileyonlinelibrary.com]
The target thicknesses of 5, 6, 7, and 8 cm and corresponding fibroglandular densities were used to create clusters of the 40 nearest training cases. Using this clustering scheme it was possible for training cases to be included in multiple clusters. The resulting clusters can be seen in Fig. 4.
3.B. Creation of eigenbreasts
Sample eigenbreasts can be seen in Fig. 5. For illustrative purposes, they were shown as a pseudo mammographic projection (simple summation of gray levels in the craniocaudal direction without x‐ray physics).
Figure 5.

The first eight of the 39 eigenbreasts (created from the 8 cm cluster of breasts) are shown in a pseudo mammographic projection, with a simple summation of the 3D image in the craniocaudal direction. The eigenbreasts were float images containing positive and negative values.
3.C. Synthesized breast phantoms
A total of 600 new synthesized breast phantoms composed of four breast density groups were generated as a weighted summation of the eigenbreasts and the mean image. The weighting factors applied to each eigenbreast was uniformly sampled from the distribution observed in the training cases. The algorithm was implemented in MATLAB and took approximately 25 s to generate a new case with an Intel 3.4 GHz processor and 32 GB of RAM.
Examples of the sample training cases in Fig. 6 can be seen along with synthesized breast phantoms in Fig. 7. When comparing the central slice images, the fine structures in the synthesized cases can be seen to be less connected than in the training cases. Despite these differences, the synthesized breast phantoms demonstrate a high degree of realism as confirmed by an observer study in Section 3.F. The population of synthesized breast phantoms also closely matches the density profiles of the training set.
Figure 6.
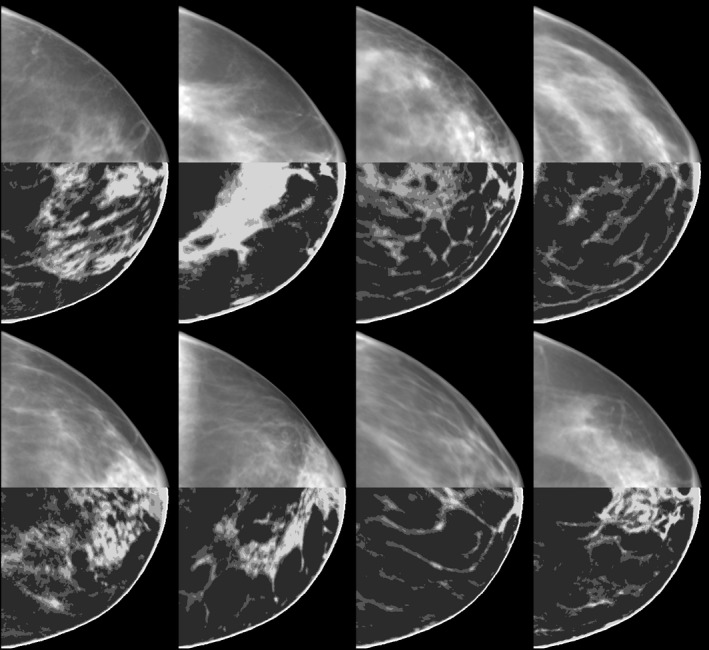
Sample training cases, from the 8 cm cluster, shown as a simple projection (without x‐ray physics) in the top half and a central slice of the volumetric image in the bottom half. Only a subset of the 40 training breasts are shown.
Figure 7.
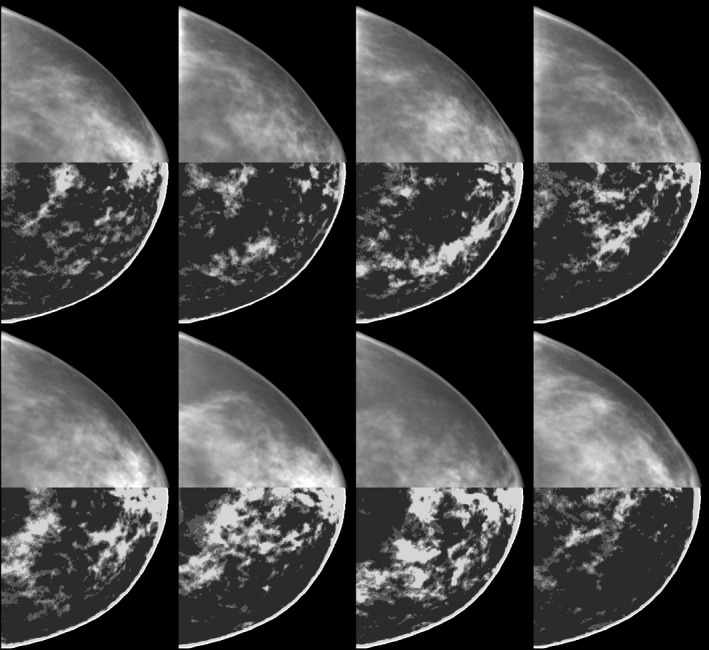
Synthesized breast phantoms generated from the eigenbreasts illustrated in Fig. 5. To give a sense of the 3D voxelized structure of these phantoms, a simple projection (without x‐ray physics) is shown for the top half of each breast along with a central slice in the bottom half.
3.D. Fibroglandular density
The fibroglandular density of the synthesized breast phantoms compared well with the training set of phantoms as seen in Table 3. There was no statistically significant difference between the distributions of fibroglandular densities for any of the size/density clusters. The p values varied across the breast thicknesses, but this could be explained largely by the differences in the distribution of fibroglandular densities observed in each training set as seen in Fig. 4.
Table 3.
Fibroglandular density for the training sets and synthesized phantoms
| 5 cm | 6 cm | 7 cm | 8 cm | |||||
|---|---|---|---|---|---|---|---|---|
| Mean | SE | Mean | SE | Mean | SE | Mean | SE | |
| Training set | 0.33 | 0.09 | 0.28 | 0.07 | 0.20 | 0.04 | 0.14 | 0.04 |
| Synthesized | 0.33 | 0.07 | 0.29 | 0.05 | 0.21 | 0.03 | 0.14 | 0.03 |
| P value | 0.90 | 0.58 | 0.32 | 0.19 | ||||
3.E. Noise power spectra
The power law exponent β was found to agree closely with the published value of 2.06 observed for segmented bCT data.23 The values for β can be compared for the training sets and synthesized phantoms in Table 4. Here, the standard error includes the variation within the 50 VOIs per case as well as the variation across cases, 2,000 VOIs per thickness in the training set and 7,500 VOIs per thickness in the synthesized.
Table 4.
Power‐law noise β for the training sets and synthesized breast phantoms
| 5 cm | 6 cm | 7 cm | 8 cm | |||||
|---|---|---|---|---|---|---|---|---|
| Mean | SE | Mean | SE | Mean | SE | Mean | SE | |
| Training set | 2.09 | 0.46 | 2.09 | 0.44 | 2.01 | 0.44 | 1.86 | 0.46 |
| Synthesized | 1.98 | 0.28 | 1.97 | 0.29 | 1.89 | 0.32 | 1.78 | 0.36 |
3.F. Observer study
The observer study, summarized in Table 5, demonstrated that it was difficult to tell the difference between the synthesized phantoms and the patient based ones, with two of three observers having no significant difference than chance. This indicates that the synthesized phantoms had a high degree of realism. A sample case from the observer study can be seen in Fig. 8.
Table 5.
Observer performance of correctly identifying the patient based simulated mammogram from the synthesized image
| Percent correct/P value | |||||
|---|---|---|---|---|---|
| 5 cm | 6 cm | 7 cm | 8 cm | Overall | |
| Observer 1 | 0.50/1.00 | 0.50/1.00 | 0.58/0.43 | 0.55/0.64 | 0.53/0.48 |
| Observer 2 | 0.63/0.15 | 0.13/1.4 E −6 | 0.30/0.02 | 0.48/0.87 | 0.38/3.3 E −3 |
| Observer 3 | 0.60/0.27 | 0.40/0.27 | 0.53/0.87 | 0.53/0.87 | 0.51/0.81 |
Bold values indicates a performance that was statistically different from chance.
Figure 8.
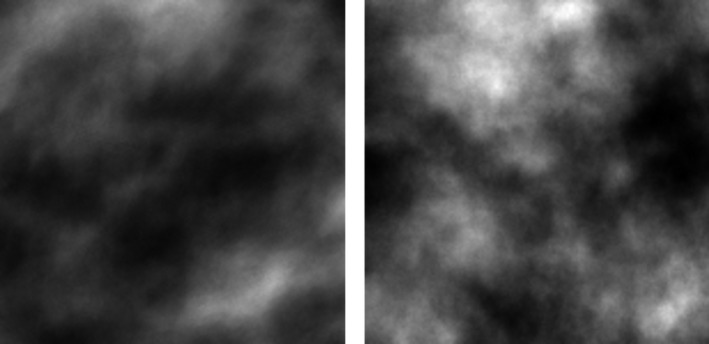
Sample case from the observer study with the real patient‐based case shown on the left.
3.G. Sample ROIs
The realism and variability of the synthesized breast phantoms can best be appreciated visually. A representative sample of ROIs are shown in Fig. 9.
Figure 9.
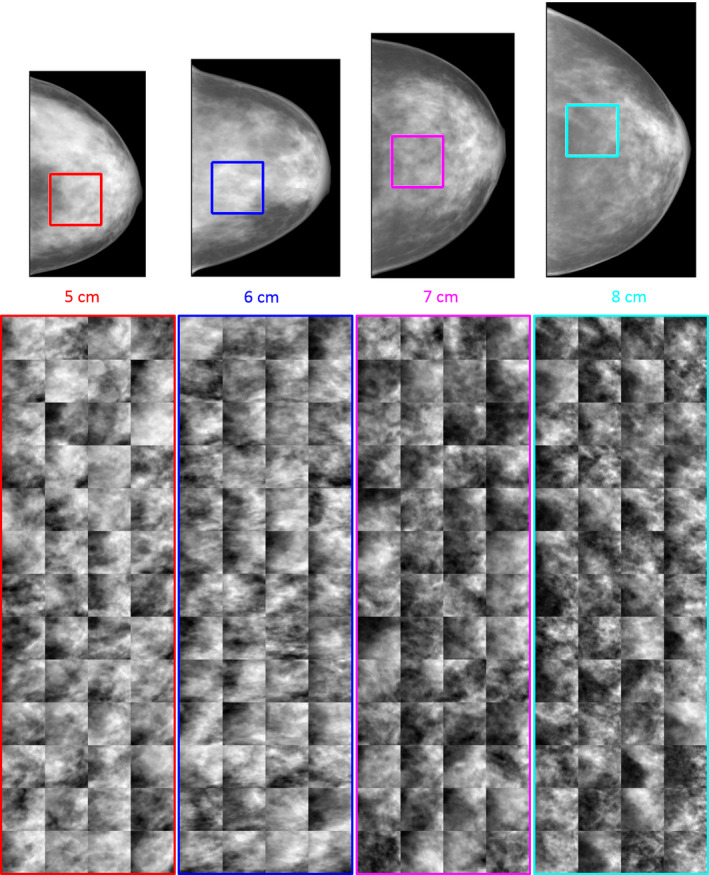
Simulated mammographic projection from the synthetic breast phantoms are shown to scale (top) with ROIs indicating the region shown for 52 unique cases in each of the 4 clusters (bottom). [Color figure can be viewed at wileyonlinelibrary.com]
4. Discussion
There is increasing interest in using anthropomorphic virtual phantoms in medical imaging.24, 25, 26, 27, 28, 29 In breast imaging, such phantoms may be used in model observer studies to optimize several new technologies now in various stages of clinical adoption such as digital breast tomosynthesis, contrast‐enhanced mammography, and dedicated breast CT.30, 31, 32, 33, 34, 35, 36 The US FDA has allowed for the use of virtual simulation techniques for a model observer study in medical device clearance, such as the Siemens SAFIRE CT reconstruction algorithm.37 However, the incorporation of anatomical variations into a model observer study for regulatory evaluation of breast imaging has not been realized and it is still a work in progress. The development of the virtual breast phantom in this work is one step closer to realizing the important goal. In previous work, we presented a cohort of approximately 200 patient‐based phantoms.3 Although that dataset is the largest of its type, VCTs may require cases numbering in the thousands or even tens of thousands.5, 6, 7 It would be prohibitively difficult to acquire and process images from such large numbers of actual human subjects. Instead, the method presented to synthesize new breast phantoms has the potential to augment the limited availability of patient‐based 3D phantoms. Compared to the patient‐based phantoms from which they were developed, the synthesized phantoms agreed in several key metrics including: fibroglandular density, noise power spectra, and visual appearance of pseudo mammographic projections.
It would be difficult to claim that our synthesized breast phantoms are truly representative of the population as a whole due to the limited number of cases available for training. However, this work demonstrated the ability to create multiple subpopulations of synthesized breast phantoms based on targeted clusters of training cases. Both the breast volume and density could potentially be further diversified, if appropriate training cases were available, to represent any arbitrary study sample.
The 5 cm cluster included a wider range of compressed thicknesses and fibroglandular densities than the other clusters of breast phantoms for training as indicated by the larger diameter in Fig. 4. This region seems to be rather sparsely sampled and clearly there were not enough training cases in this region to justify a 4 cm cluster of breast phantoms. It could be beneficial to obtain additional patient training sets to provide a better sampling of this region. Including additional cases will also provide more modes of variation in the eigen analysis and thus greater variability in the synthesized breast phantoms.
The clustering of the size/density groups by targeting a prespecified compressed thickness and corresponding fibroglandular density was just one possible method of choosing subgroups of the training ensemble. This method took advantage of compressed template geometries that were already available and allowed for training sets with an equal number of cases. An alternative would be to use a k‐means clustering of all the data in order to not have repeated or excluded cases between groups.
There was an inherent difference in the methods to estimate breast density between our bCT based phantoms and population of patient mammograms of Dance et al. This difference could result a shift in the estimated compressed thicknesses, which were obtained by fitting our data to the Dance curve. However, this shift would likely be relatively small compared to the range of compressed thicknesses included in a given size/density cluster. In future studies, we intend to use a higher resolution bCT dataset, which have corresponding mammograms and known compressed thicknesses.
Each of the synthesized phantoms are currently fixed to an template breast shape for each size‐density cluster, but other breast shapes can be selected from the existing patient‐based phantoms or specified by rule‐based techniques.8, 10, 20 In addition, breast densities are currently based on empirical measurements from the patient‐based phantoms, but those values can be varied simply by re‐scaling to increase or decrease the overall density to provide variations on the same underlying parenchymal pattern.
The power law exponent, β, for the synthesized phantoms was generally within the range observed in the training set. However, the mean β values of the synthesized phantoms were consistently lower than that of their corresponding training sets. This may be caused by the loss of larger, lower frequency anatomical details that are not as well represented by the current PCA approach. The differences are relatively small and fall within the typical variability of power law studies, but this relationship is an area for future study.
Fine structures in individual slices tended to become discontinuous as seen when comparing Figs. 6 and 7. If a fine fibroglandular structure is isolated in a training case where all/most of the other cases have a uniform adipose region, then this structure could be well preserved in one of the eigenbreasts. However, in practice these structures do tend to become somewhat discontinuous. These differences were less apparent when projecting through the phantoms to create the simulated mammograms. Visual inspection of the synthesized breast phantoms demonstrated a high degree of realism. This was confirmed by an observer study which showed simulated mammograms from the patient‐based and synthesized phantoms to be nearly indistinguishable for two of the three medical physicists. The level of experience for these physicists was sufficient for this general task.
The bCT images used in this study had a mean voxel size of 258 μm, which makes the simulated mammographic projections seem blurry when compared to actual mammograms with pixel sizes of 70 to 100 μm. To supplement the inherently lower resolution phantoms, these statistically generated synthetic phantoms may be augmented with rule‐based models of coopers ligaments and vasculature such as developed by Elangovan, Graff, or Bakic.8, 10, 20, 38
We have used 3D printing to develop some physical breast phantoms based on our segmented bCT datasets.21, 39 However, due to the relatively high cost of the 3D printing it is unlikely that the need for diverse physical breast phantoms will exceed the number of virtual breast phantoms available from segmented bCT images. So, the eigenbreast technique is more appropriate for model observer studies where large quantities of cases are evaluated.
In future work, much larger numbers of additional cases will be generated for an upcoming virtual trial of lesion detectability in digital breast tomosynthesis. At which time, the required training set size and local statistical properties of the resulting phantoms will be evaluated in the context of the observer study.
5. Conclusions
This work represents the first use of PCA to create a large set of realistic breast phantoms from a relatively smaller set of patient based data. The statistically generated breast phantoms were similar to the original patient‐based phantoms in terms of density and power law beta value, and were indistinguishable by two out of three experienced physicist observers.
We have also demonstrated that the patient based training sets can be designed to target specified fibroglandular density profiles. The resulting ensembles of statistically generated computational phantoms have the potential to support future VCTs for breast imaging evaluation.
Conflict of Interest
The authors have no relevant conflicts of interest to disclose.
Acknowledgments
This work was supported in part by NIH Grant No. RO1‐EB001838.
References
- 1. Eck B, Fahmi R, Brown KM, Raihani N, Wilson DL. Comparison of computational to human observer detection for evaluation of CT low dose iterative reconstruction. SPIE Medical Imaging; 2014. [DOI] [PMC free article] [PubMed]
- 2. Yu L, Leng S, Chen L, Kofler JM, Carter RE, McCollough CH. Prediction of human observer performance in a 2‐alternative forced choice low‐contrast detection task using channelized Hotelling observer: impact of radiation dose and reconstruction algorithms. Med Phys. 2013;40:041908. [DOI] [PMC free article] [PubMed] [Google Scholar]
- 3. Erickson DW, Wells JR, Sturgeon GM, et al. Population of 224 realistic human subject‐based computational breast phantoms. Med Phys. 2016;43:23–32. [DOI] [PMC free article] [PubMed] [Google Scholar]
- 4. Sturgeon GM, Kiarashi N, Lo JY, Samei E, Segars W. Finite‐element modeling of compression and gravity on a population of breast phantoms for multimodality imaging simulation. Med Phys. 2016;43:2207–2217. [DOI] [PMC free article] [PubMed] [Google Scholar]
- 5. Lee C, Baek J, Park S. Investigation on location‐dependent detectability of a small mass for digital breast tomosynthesis evaluation. SPIE Medical Imaging; 2016.
- 6. Park S, Zhang G, Myers KJ. Comparison of channel methods and observer models for the task‐based assessment of multi‐projection imaging in the presence of structured anatomical noise. IEEE Trans Med Imaging. 2016;35:1431–1442. [DOI] [PubMed] [Google Scholar]
- 7. Wen G, Markey MK, Park S. Model observer design for multi‐signal detection in the presence of anatomical noise. Phys Med Biol. 2016;62:1396–1415. [DOI] [PubMed] [Google Scholar]
- 8. Bakic PR, Albert M, Brzakovic D, Maidment AD. Mammogram synthesis using a 3D simulation. I. Breast tissue model and image acquisition simulation. Med Phys. 2002;29:2131–2139. [DOI] [PubMed] [Google Scholar]
- 9. Lau BA, Reiser I, Nishikawa RM, Bakic PR. A statistically defined anthropomorphic software breast phantom. Med Phys. 2012;39:3375–3385. [DOI] [PMC free article] [PubMed] [Google Scholar]
- 10. Graff CG. A new open‐source multi‐modality digital breast phantom. SPIE Medical Imaging; 2016.
- 11. Turk M, Pentland A. Eigenfaces for recognition. J Cogn Neurosci. 1991;3:71–86. [DOI] [PubMed] [Google Scholar]
- 12. Sturgeon GM, Tward DJ, Ketcha M, et al. Eigenbreasts for statistical breast phantoms. SPIE Medical Imaging; 2016.
- 13. Cootes TF, Taylor CJ, Cooper DH, Graham J. Active shape models‐their training and application. Comput Vis Image Underst. 1995;61:38–59. [Google Scholar]
- 14. Cootes TF, Edwards GJ, Taylor CJ. Active appearance models. IEEE Trans Pattern Anal Mach Intell. 2001;23:681–685. [Google Scholar]
- 15. Rose C, Taylor C. A generative statistical model of mammographic appearance. Proceedings of Medical Image Understanding and Analysis; 2004.
- 16. Berks M, Caulkin S, Rahim R, Boggis C, Astley S. Statistical appearance models of mammographic masses. International Workshop on Digital Mammography; 2008.
- 17. Dance D, Skinner C, Young K, Beckett J, Kotre C. Additional factors for the estimation of mean glandular breast dose using the UK mammography dosimetry protocol. Phys Med Biol. 2000;45:3225. [DOI] [PubMed] [Google Scholar]
- 18. Burgess AE, Jacobson FL, Judy PF. Human observer detection experiments with mammograms and power‐law noise. Med Phys. 2001;28:419–437. [DOI] [PubMed] [Google Scholar]
- 19. Burgess AE. Bach, breasts, and power‐law processes. Medical Imaging 2001; 2001.
- 20. Bakic PR, Zhang C, Maidment AD. Development and characterization of an anthropomorphic breast software phantom based upon region‐growing algorithm. Med Phys. 2011;38:3165–3176. [DOI] [PMC free article] [PubMed] [Google Scholar]
- 21. Kiarashi N, Nolte AC, Sturgeon GM, et al. Development of realistic physical breast phantoms matched to virtual breast phantoms based on human subject data. Med Phys. 2015;42:4116–4126. [DOI] [PubMed] [Google Scholar]
- 22. Cockmartin L, Bosmans H, Marshall N. Comparative power law analysis of structured breast phantom and patient images in digital mammography and breast tomosynthesis. Med Phys. 2013;40:081920. [DOI] [PubMed] [Google Scholar]
- 23. Metheany KG, Abbey CK, Packard N, Boone JM. Characterizing anatomical variability in breast CT images. Med Phys. 2008;35:4685–4694. [DOI] [PMC free article] [PubMed] [Google Scholar]
- 24. Segars W, Sturgeon G, Mendonca S, Grimes J, Tsui BM. 4D XCAT phantom for multimodality imaging research. Med Phys. 2010;37:4902–4915. [DOI] [PMC free article] [PubMed] [Google Scholar]
- 25. Long DJ, Lee C, Tien C, et al. Monte Carlo simulations of adult and pediatric computed tomography exams: validation studies of organ doses with physical phantoms. Med Phys. 2013;40:013901. [DOI] [PMC free article] [PubMed] [Google Scholar]
- 26. Lee C, Lodwick D, Hurtado J, Pafundi D, Williams JL, Bolch WE. The UF family of reference hybrid phantoms for computational radiation dosimetry. Phys Med Biol. 2009;55:339. [DOI] [PMC free article] [PubMed] [Google Scholar]
- 27. Xu XG. An exponential growth of computational phantom research in radiation protection, imaging, and radiotherapy: a review of the fifty‐year history. Phys Med Biol. 2014;59:R233. [DOI] [PMC free article] [PubMed] [Google Scholar]
- 28. Tian X, Li X, Segars WP, Frush DP, Samei E. Prospective estimation of organ dose in CT under tube current modulation. Med Phys. 2015;42:1575–1585. [DOI] [PMC free article] [PubMed] [Google Scholar]
- 29. Li X, Segars WP, Samei E. The impact on CT dose of the variability in tube current modulation technology: a theoretical investigation. Phys Med Biol. 2014;59:4525. [DOI] [PMC free article] [PubMed] [Google Scholar]
- 30. Gong X, Glick SJ, Liu B, Vedula AA, Thacker S. A computer simulation study comparing lesion detection accuracy with digital mammography, breast tomosynthesis, and cone‐beam CT breast imaging. Med Phys. 2006;33:1041–1052. [DOI] [PubMed] [Google Scholar]
- 31. Sechopoulos I, Ghetti C. Optimization of the acquisition geometry in digital tomosynthesis of the breast. Med Phys. 2009;36:1199–1207. [DOI] [PubMed] [Google Scholar]
- 32. Reiser I, Nishikawa R. Task‐based assessment of breast tomosynthesis: effect of acquisition parameters and quantum noisea). Med Phys. 2010;37:1591–1600. [DOI] [PMC free article] [PubMed] [Google Scholar]
- 33. Das M, Gifford HC, O'Connor JM, Glick SJ. Evaluation of a variable dose acquisition technique for microcalcification and mass detection in digital breast tomosynthesis. Med Phys. 2009;36:1976–1984. [DOI] [PMC free article] [PubMed] [Google Scholar]
- 34. Young S, Bakic PR, Myers KJ, Jennings RJ, Park S. A virtual trial framework for quantifying the detectability of masses in breast tomosynthesis projection data. Med Phys. 2013;40:051914. [DOI] [PMC free article] [PubMed] [Google Scholar]
- 35. Zeng R, Park S, Bakic P, Myers KJ. Evaluating the sensitivity of the optimization of acquisition geometry to the choice of reconstruction algorithm in digital breast tomosynthesis through a simulation study. Phys Med Biol. 2015;60:1259. [DOI] [PubMed] [Google Scholar]
- 36. Zeng R, Park S, Bakic PR, Myers KJ. Is the outcome of optimizing the system acquisition parameters sensitive to the reconstruction algorithm in digital breast tomosynthesis? International Workshop on Digital Mammography; 2012.
- 37. U.S. Food & Drug Administration . 510(k) K103424. In: Division of Radiological Devices, ed. 2011.
- 38. Elangovan P, Mackenzie A, Dance DR, et al. Design and validation of realistic breast models for use in multiple alternative forced choice virtual clinical trials. Phys Med Biol. 2017;62:2778. [DOI] [PubMed] [Google Scholar]
- 39. Sikaria D, Musinsky S, Sturgeon GM, et al. Second generation anthropomorphic physical phantom for mammography and DBT: Incorporating voxelized 3D printing and inkjet printing of iodinated lesion inserts. SPIE Medical Imaging; 2016.


