Abstract
Purpose
To study the impact of target geometrical and linac operational parameters, such as target material and thickness, electron beam size, repetition rate, and mean current on the ability of the radiotherapy treatment head to deliver high‐dose‐rate x‐ray irradiation in the context of novel linear accelerators capable of higher repetition rates/duty cycle than conventional clinical linacs.
Methods
The depth dose in a water phantom without a flattening filter and heat deposition in an x‐ray target by 10 MeV pulsed electron beams were calculated using the Monte‐Carlo code MCNPX, and the transient temperature behavior of the target was simulated by ANSYS. Several parameters that affect both the dose distribution and temperature behavior were investigated. The target was tungsten with a thickness ranging from 0 to 3 mm and a copper heat remover layer. An electron beam with full width at half maximum (FWHM) between 0 and3 mm and mean current of 0.05–2 mA was used as the primary beam at repetition rates of 100, 200, 400, and 800 Hz.
Results
For a 10 MeV electron beam with FWHM of 1 mm, pulse length of 5 μs, by using a thin tungsten target with thickness of 0.2 mm instead of 1 mm, and by employing a high repetition rate of 800 Hz instead of 100 Hz, the maximum dose rate delivered can increase two times from 0.57 to 1.16 Gy/s. In this simple model, the limiting factor on dose rate is the copper heat remover's softening temperature, which was considered to be 500°C in our study.
Conclusions
A high dose rate can be obtained by employing thin targets together with high repetition rate electron beams enabled by novel linac designs, whereas the benefit of thin targets is marginal at conventional repetition rates. Next generation linacs used to increase dose rate need different target designs compared to conventional linacs.
Keywords: dose distribution, flattening‐filter‐free (FFF), target temperature, x‐ray target
1. Introduction
The biological effect on both tumor and normal tissues between conventional and high dose rate radiation has been investigated for several decades but is still a topic of debate.1, 2, 3, 4, 5 Recent in vivo studies investigating FLASH ultra‐high dose rate radiotherapy (≥ 40 Gy/s, FLASH) suggest that such high dose rates can reduce the occurrence of early and late complications affecting normal tissues while maintaining high kill rates in cancerous tissue.6, 7, 8, 9, 10 This evidence, together with the desire for shorter overall treatment time, pushes for the development of systems that can deliver very high dose rates.
High dose rate radiation is facilitated by both novel radiotherapy concepts and new linac developments. One approach to provide increased radiation output is through removal of the flattening filter, which provides increases of 100% and 200% in output relative to the flattened beam modes at 6 MV and at 10 MV respectively.11, 12 Hundreds of medical linacs with flattening filter free (FFF) functionality, such as the TrueBeam linac (Varian Medical Systems, Inc., Palo Alto, CA, USA) have been recently installed.13 Stereotactic ablative radiotherapy (SABR) in particular benefits from high dose rate delivery because of large doses per fraction that otherwise require long delivery times, which may adversely impact uncertainty from patient motion over a treatment session.14 Scanning beam hadron therapy (e.g., protons) may deliver extremely high dose rates within each pulse (>1010 Gy/s with laser driven sources).15
For radiotherapy systems working in FFF mode, the dose characteristics have been intensively studied both experimentally and numerically.16, 17, 18 However, little research has been published on the temperature behavior of the x‐ray target, which is one of the key parameters that limit the dose rate. Elevated temperatures at the target may result in target fatigue, recrystallization, creep, and vaporization.19, 20 Previous work investigating tungsten‐rhenium alloy megavoltage x‐ray targets 21 shows that the heat load is limited by both the surface temperature of the cooling tubes and by the mechanical fatigue of the target surface.
A motivation of this work is novel linear accelerator technology that has the potential to achieve much higher dose rates through high pulse repetition rates and duty cycles to produce high average beam current. Recently developed designs for electron linear accelerators operating in the therapeutic energy range enable pulse repetition rates of 1 kHz or higher 22, 23 compared to conventional repetition rates of 100–300 Hz.
In this work, the transient temperature behavior of tungsten (W) targets was simulated via the Monte‐Carlo code MCNPX 24 and the finite element analysis software ANSYS.25 The geometrical parameters, i.e., the thickness of the target, and the linac operational parameters, including the electron beam size, the pulse repetition rate, and mean current are studied by simulating both the target temperature and the dose distribution in a water phantom placed at 100 cm from the target. The goal of the work is to provide insights into target design optimization for high dose rate radiotherapy systems.
2. Materials and methods
2.A. Geometry and parameters for dose calculation
Figure 1 shows the geometry of the treatment head used for dose calculation, using a very simple design intended to understand basic principles. The target is composed of a tungsten layer and a 1 mm thick copper cooling layer with a diameter of 1 cm. The tungsten thickness varies from 0 (copper cooling layer serves as the target) to 3 mm and its effect on both the temperature and the dose distribution is investigated. Downstream of the target, there is a 5 mm thick copper plate used to remove the transmitted electrons. In previous studies on treatment heads working in FFF mode, different materials with thicknesses varying between 1 and 7 mm have been investigated.26 The value chosen here is based on the CSDA (Continuous Slowing Down Approximation) range 10 MeV electrons in copper (6.9 mm), with the goal of minimizing the number of electrons transmitted through the copper plate. Finally a water phantom with a volume of a 50 × 50 × 50 cm3 is placed at a source‐to‐surface distance (SSD) of 100 cm.
Figure 1.
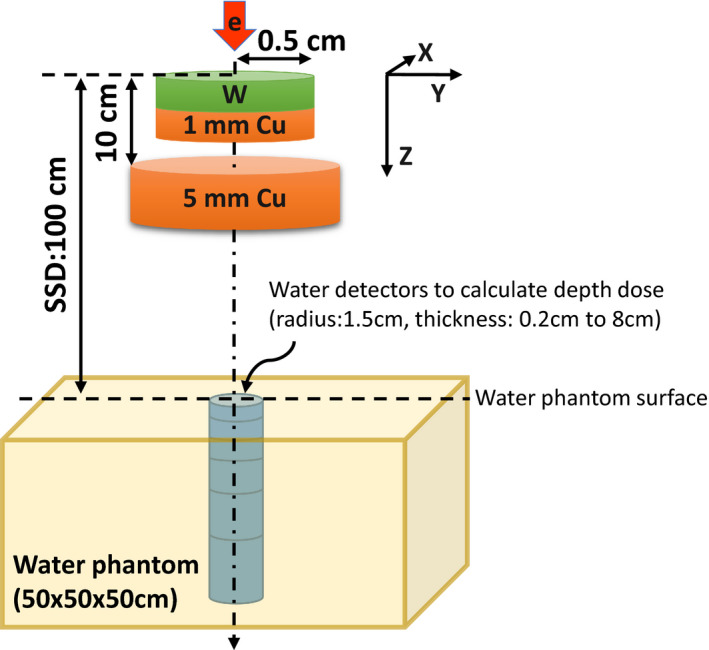
Schematic geometry of the treatment head for dose calculation (not to scale). This simple geometry includes a tungsten target, a copper heat remover, a copper plate, and a water phantom. Water detectors of various sizes are imbedded in the phantom for depth dose calculations. [Color figure can be viewed at wileyonlinelibrary.com]
The electron beam parameters used for the simulation are listed in Table 1. For comparison, in conventional radiotherapy systems, pulse lengths of several microseconds, repetition rates of hundreds of Hz, and mean currents of tens of μA are commonly used.27 In our calculations, the energy of the electron beam has a Gaussian distribution centered at 10 MeV with a standard deviation of 0.1 MeV. The spatial lateral spread is also Gaussian with a range of FWHM values. The mean current is fixed at 0.1 mA for most of the simulations to keep the target temperature lower than the material melting points, i.e., 3410°C and 1085°C for tungsten and copper respectively.
Table 1.
Electron beam parameters used for temperature and dose calculations
| Parameter | Value |
|---|---|
| Beam energy (MeV) | 10 |
| Beam FWHM (mm) | 0, 0.2, 0.5, 1, 2, 3 |
| Mean current (mA) | 0.1, 0.2 |
| Pulse length (μs) | 5 |
| Repetition rate (Hz) | 100, 200, 400, 800 |
The Monte Carlo code MCNPX 2.7.0 is used for dose calculation. The spatial resolution of the dose curves is determined by both the water detector size and the cut‐off energy. The cut‐off energies for electrons and photons in water are chosen to be 500 keV, and 8 keV respectively. At 500 keV the CSDA range of electrons is < 2 mm and nearly 90% of the photons are attenuated within 2 mm in water, so that the spatial uncertainty due to cutoff energy setup is less than 2 mm. For depth dose calculation, water detectors with radius of 1.5 cm, and increasing in thickness from 2 mm to 8 cm, are placed along the central axis. +F6 tally (score energy density) are used for dose calculations. To keep the statistical uncertainty below 2%, 5 × 10⁸ primary electrons are simulated.
2.B. Geometry and parameters for temperature calculation
When electrons hit tungsten to generate x‐rays, a significant amount of energy is lost to heat. For 10 MeV electrons, the ratio between radiation loss and collision loss is about 1 according to the rule of thumb formula: EZ/700,28 where E is the electron energy in MeV, and Z is the atomic number (W:74). The simple target cooling scheme in our model uses a 1 mm copper layer placed underneath the tungsten target with water cooling from its periphery. The energy deposited within the target is simulated with MCNPX. Due to the axially symmetric geometry of the target and electron beam, concentric ring volume meshes (TMESH tally with cylindrical mesh geometry) are employed which can reduce the calculation time significantly compared to cubic mesh. The mesh size is chosen to be 1/20 of the electron beam FWHM to accurately represent the spatial energy distribution. The electron cut‐off energy is set to 100 keV to keep the CSDA range in both tungsten and copper < 20 μm. A total of 2 × 10⁸ particles are recorded to keep the statistical error < 1%, especially for the high energy density region.
After calculating the energy density data, a C++ code is used to convert the output from MCNPX to the input for ANSYS. The geometry and mesh setup for temperature simulation are schematically shown in Fig. 2(a). A wedge structure (with total azimuthal angle of 3.6 degree) instead of the whole cylindrical target is used to reduce the calculation time. A hexahedron mesh with edge length of 1/20 of the electron beam FWHM is employed and the data at each intersection point are automatically calculated from MCNPX results marked with blue dots shown in Fig. 2(a). Before calculation, the energy density data (blue dots) are repeated in the azimuthal ɸ direction to cover the 3D mesh points in ANSYS. The peripheral boundary of the copper is held at 100°C to represent the water cooling, which is typically between 50 and 150°C (under pressure) in practice. The top and bottom boundaries are perfectly isolated, since theoretical calculations indicate that the energy loss due to convection (air) and radiation (air and vacuum) can be neglected. The front and back boundaries in the azimuthal ɸ direction can also be modeled as perfectly isolated because by radial symmetry the heat flow in each direction perpendicular to the surface sums up to zero. The mesh and imported energy density data used in ANSYS are shown in Figs. 2(b) and 2(c) respectively. The energy build‐up region in tungsten centered at z~0.35 mm can be clearly seen.
Figure 2.
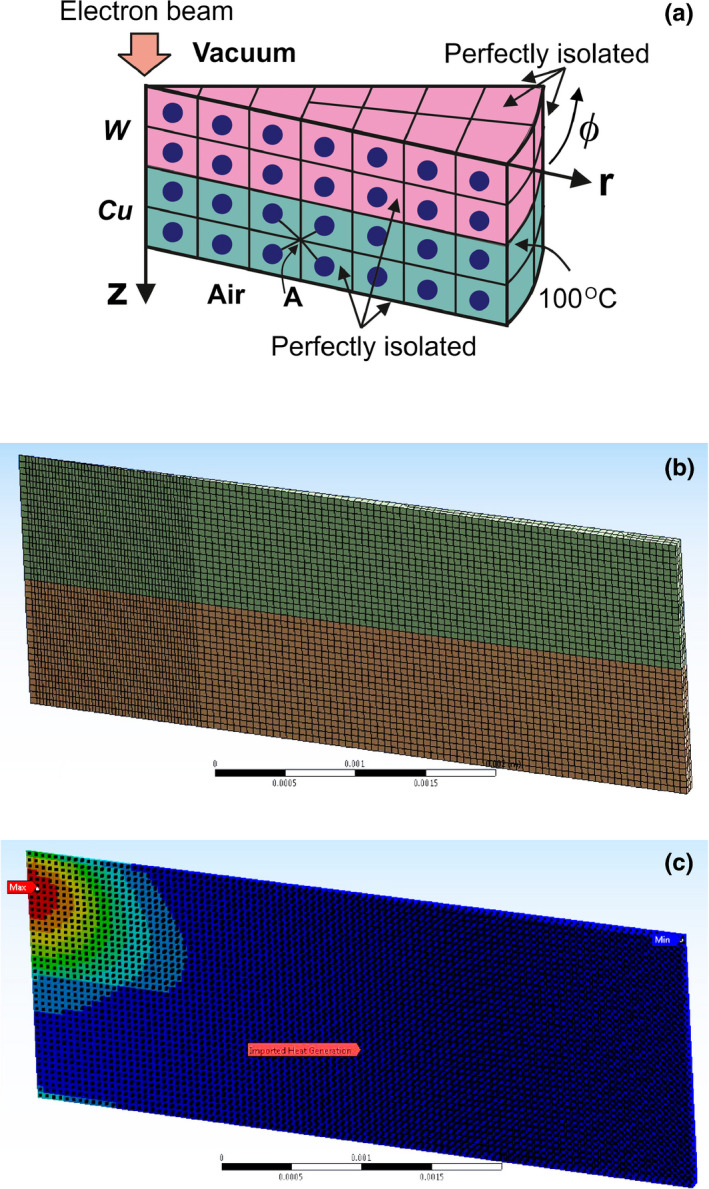
(a) Schematic target geometry used for temperature simulation. (b) Meshes used in ANSYS simulation. (c) Imported heat energy density data with magnitude colored from red (max) to blue (min). Only a sliced wedge structure is simulated to save simulation time. The peripheral boundary of the copper is held at 100°C, all other boundaries are perfectly isolated. The mesh size is 1/20 of the beam FWHM. During calculations, the data at each mesh point in ANSYS [such as point A shown in Fig. 2(a)] is automatically calculated from its adjacent heat data imported and calculated from MCNP [blue dots in Fig. 2(a)]. The energy build‐up region is at z~0.35 mm deep in tungsten. [Color figure can be viewed at wileyonlinelibrary.com]
2.C. Transient temperature characterization
The green curve shown in Fig. 3 is a typical transient temperature behavior of the target under repeating heat loads, which is characterized by a saw shape with constant top‐to‐trough amplitude. The red curve represents the track temperature, which is defined and obtained by calculating the target temperature under an averaged heating load. The top amplitude is defined as the difference between the peak temperature and the track temperature, and the bottom amplitude is the difference between the track and the trough temperature, both of which can be calculated from any one of the pulses since all pulse shapes are almost identical. After sufficient number of heating loads, the target will reach its equilibrium state, i.e., all three characteristic temperatures become approximately stable and change with time is minimal.
Figure 3.
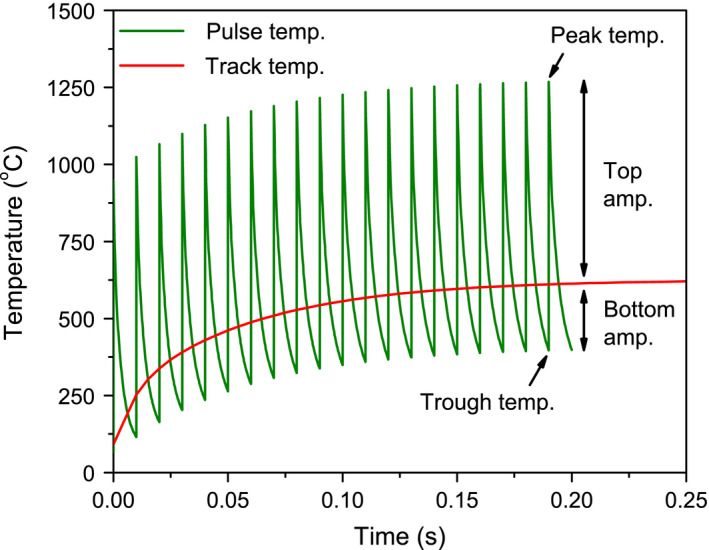
Concepts used to characterize the transient temperature behavior of a target under repeating heat loads. The green saw shape curve is the transient temperature. The red curve is the track temperature, which is calculated by using an averaged heating load. The top amplitude is the difference between the peak and track temperatures. The bottom amplitude is the difference between the track and trough temperatures. [Color figure can be viewed at wileyonlinelibrary.com]
We observed that the track temperature can be well‐fitted by an overdamped model:
| (1) |
where T 0 is the track temperature when the target reaches its equilibrium state, and A and λ are constants obtained by fitting the temperature curve. By simulating track temperature and only a few pulses, both the trough and peak temperatures can be calculated, and thus completely describe the temperature behavior when the target reaches equilibrium state. The introduction of track temperature can reduce the computation time significantly because only one transient step is calculated.
2.D. Material properties
In Fig. 4 the specific heat and thermal conductivity for W and Cu are compared.29, 30 Cu's specific heat and thermal conductivity are about twice that of W for the whole temperature range.
Figure 4.
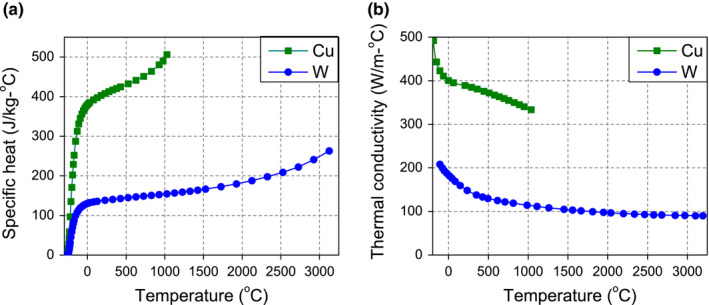
(a) Specific heat and (b) thermal conductivity of copper and tungsten. Copper has both higher specific heat and thermal conductivity. [Color figure can be viewed at wileyonlinelibrary.com]
During operation, first, the Cu temperature should be kept below 600°C to minimize grain growth, which happens at its softening temperature. In addition, the material should not be subject to temperatures greater than 1/2 of its melting point (1085°C for copper) during operation. Based on these conditions, we chose the operational temperature limit of Cu to be 500°C. Second, the temperature of W should be kept lower than its recrystallization value. Recrystallization is the migration of high angle grain boundaries driven by the stored energy of deformation.31 During recrystallization, cracks, surface roughening, and swelling may occur and affect the mechanical and thermal properties of the material.20 Recrystallization happens at 50–70% of the melting point temperature. For bulk W, a recrystallization temperature of 1300–1500°C is well‐accepted,20 and values higher than 1700°C have also been reported.32 Here, we chose W's recrystallization temperature to be 1500°C. For simplicity, we did not investigated the impact of cyclic temperature variations on mechanical fatigue, which would be needed for a more detailed analysis of a specific target design.
3. Results and discussion
3.A. Temperature simulation
3.A.1. Heat energy dissipation
Figure 5 shows the contour plot of the temperature distribution in the 1 mm tungsten target at the start and end of each electron pulse after the target has reached its equilibrium state. The irradiation parameters are: electron beam FWHM of 1 mm, pulse length of 5 μs, repetition rate of 100 Hz, and mean current of 0.1 mA. At equilibrium, the change of the temperature becomes periodic, first ramping up to a maximum value at the start of each pulse and then decaying to its lowest value at the end of each pulse. At the beginning of each pulse, the highest temperature (~1300°C) is located in the maximum heat energy density deposition region, which is approximately 0.35 mm deep into the tungsten target. Then the heat quickly diffuses both laterally and vertically to the cooling copper plate. Comparing the temperatures at the start and end of each pulse, we find that copper cooling is efficient at removing heat and thus provides a good mechanism to reduce the target temperature, i.e., from maximum value of 1300°C to about 400°C. In addition, the existence of heat build‐up regions indicates that thin targets less than 0.35 mm can be employed to mitigate the target temperature issue.
Figure 5.
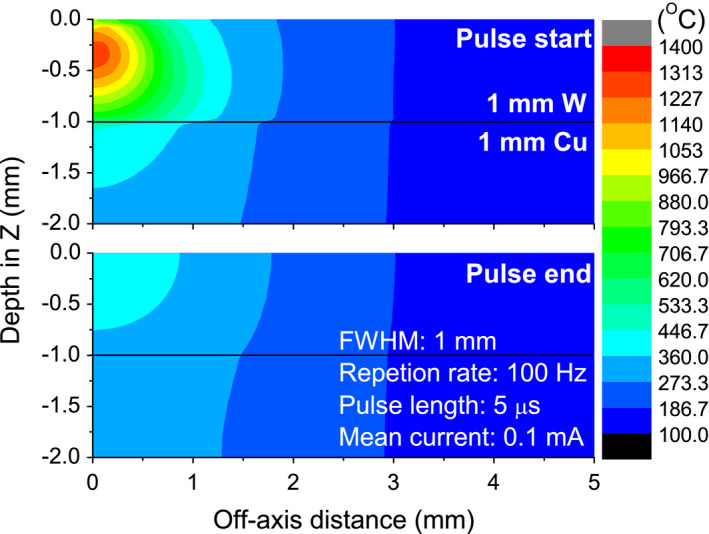
2D contour plot of the temperature distribution at the start (top) and end (bottom) of each electron pulse, when the target has reached its equilibrium state. Electron beam parameters: FWHM of 1 mm, pulse length of 5 μs, repetition rate of 100 Hz, and mean current of 0.1 mA. At the start of each temperature pulse, all the energy of the electron pulse is deposited and the target reaches its highest temperature. At the end of each temperature pulse, copper removes the maximum amount of heat and the target reaches its lowest temperature before repeating the cycle. Both W and Cu are 1 mm thick in this model, and the black line indicates the boundary between the two materials. [Color figure can be viewed at wileyonlinelibrary.com]
3.A.2. Transient temperature behavior
Figure 6(a) compares the transient temperature of the first 20 pulses for tungsten target with thickness of 1.0 and 0.2 mm, while using the same electron beam parameters. To better understand the temperature behavior, the track temperatures (symbols) together with the top amplitudes (top of bar symbol) and bottom amplitudes (bottom of bar symbol) when the targets reach their equilibrium states are calculated using the method presented above [Eq. (1)] and shown in Fig. 6(b) for targets of various thicknesses. With increased target thickness, the top amplitude keeps the same but the track temperature keeps increasing, which results in an increased peak temperature. The amplitude is determined by thermal conductivity, the constant amplitude is due to the quasi‐constant thermal conductivity in the temperature range of interest. For Cu heat remover, both amplitude and track temperature are changing, with the highest peak temperature seen at a target thickness of about 0.5 mm. At this thickness, the energy build‐up region is centered at approximately the target‐copper interface (see Fig. 5). Note that there is no build‐up region in copper due to its low‐Z property, which explains its lower temperature when the target thickness is < 0.5 mm. In summary, thinner targets lead to reduced track temperature thus lower peak temperature of the target.
Figure 6.
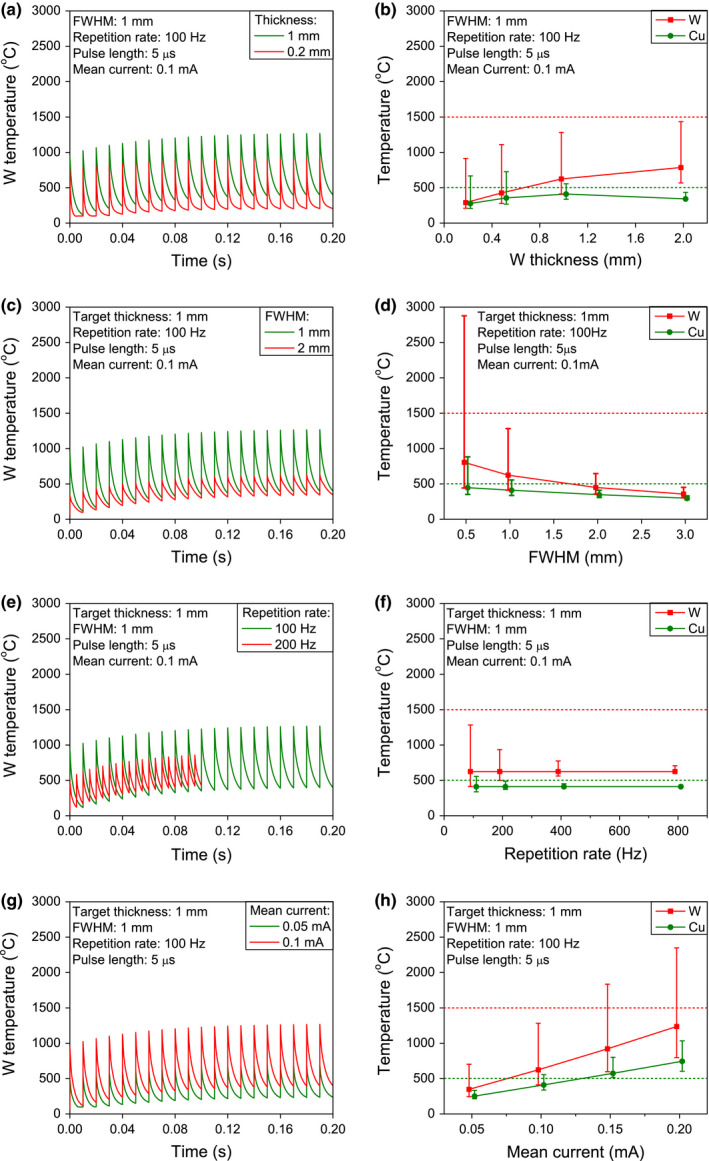
Effect of target and electron beam parameters on the transient and equilibrium state temperature characteristics for W target and the adjoining Cu heat remover. (a) and (b) Target thickness. (c) and (d) Beam size. (e) and (f) Repetition rate. (g) and (h) Mean current. The red symbols represent the track temperature of W. The green symbols represent the track temperature of copper. The top of the bar symbol represents the peak temperature, the bottom represents the trough temperature. The dashed red line represents the recrystallization temperature of W (1500°C). The dashed green line represents the softening temperature of Cu (500°C). Equilibrium track temperature is lower for thinner target and larger electron beam diameter for the repetition rates and average currents investigated here. Temperature excursions are reduced for higher repetition rates and larger electron beam diameter. And as expected, increasing mean current increases both equilibrium track temperature and temperature amplitudes. [Color figure can be viewed at wileyonlinelibrary.com]
Figures 6(c) and 6(d) plot the temperature behavior for different electron beam sizes, using the same target thickness of 1 mm and mean current of 0.1 mA. A large beam size can reduce both the peak temperature and amplitude for both the W target and Cu plate. For instance, at equilibrium state, by increasing the electron beam FWHM from 1 mm to 2 mm, the target peak temperature decreases from 1283°C to 647°C, and the oscillation amplitude decreases from 871°C to 291°C, respectively. The reduced track temperature and amplitude for both W target and Cu plate is due to the reduced energy density with increased electron beam size.
Figures 6(e) and 6(f) summarize the repetition rate effect. Under the same mean current, the track temperature remains constant for different repetition rates. However, both top and bottom amplitudes decrease with increasing repetition rate. For instance, when the rate increases from 100 Hz to 200 Hz, the top‐to‐trough amplitude for W target decrease about 2 times from 871 to 436°C. In conclusion, high repetition rate can reduce temperature amplitude.
The effect of mean current on target temperature is shown in Figs. 6(g) and 6(h). For both W target and copper heat remover, both the track temperature and the amplitude increase with increasing current, resulting in a linearly increasing peak temperature. The linear relationship between the peak temperature and the mean current can be utilized to calculate the maximum operational current (see Section 3.B.2.).
In addition to tungsten, we simulated a tungsten‐rhenium alloy W25Re because it is a common target material given its high recrystallization temperature compared to W. We found that due to its two times lower thermal conductivity compared to W, its peak temperature is about several hundred degrees higher than that of the W target under the same geometric and operational conditions. Thus there is no net advantage using W25Re over W from temperature perspective. The simulation results are included for reference in the Appendix A1.
3.B. Dose calculation
3.B.1. Depth doses
Figure 7 shows the depth doses for a tungsten target of various thicknesses. The maximum depth dose is at approximately 2.5 cm in water. When the target is thin, the surface dose on the water phantom becomes higher, e.g., from 50% to about 100% of the maximum dose when the target thickness decreases from 3 to 0 mm. The increased surface dose is due to the transmitted electrons. Except for the surface dose, however, the doses in the water phantom region are almost the same when the target thickness is between 0.2 and 1 mm. The identical depth doses can be explained as follows: for high‐energy photons, the target thickness has little effect since the absorption coefficient is low; for low energy photons, the gains from electron bremsstrahlung and the losses due to self‐absorption processes compensate for each other. An interesting result is that copper alone (removing the tungsten target) can also generate a high depth dose, thus a thin tungsten target with 1 mm copper or even only a 1 mm copper layer can be employed as the x‐ray target.
Figure 7.
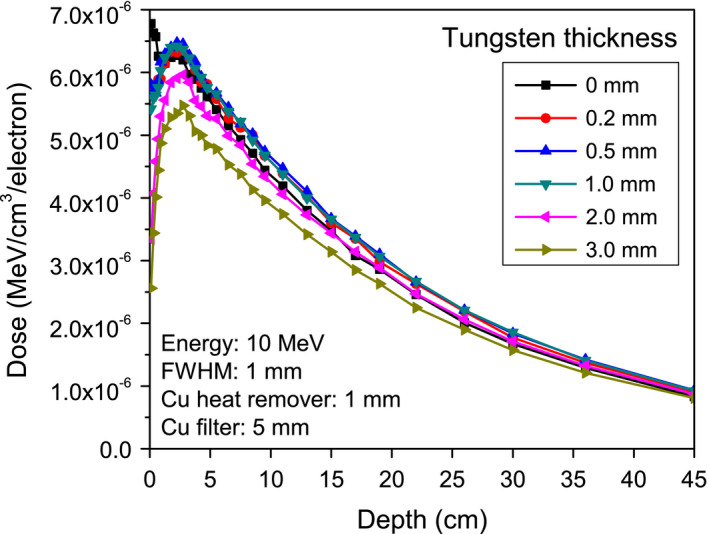
Depth dose curves for tungsten targets with various thicknesses. The depth dose curves are almost identical for target thicknesses between 0.2 mm and 1 mm. [Color figure can be viewed at wileyonlinelibrary.com]
In addition, due to the small beam size compared to the source‐to‐surface distance, we found that the beam size has negligible effect on the depth dose [see Fig. A3(a) in the Appendix A1]. Since beam size and target thickness may affect lateral dose profiles,33, 34, 35 we simulated the effect of the two parameters on the penumbra across the edge of a half‐blocked beam, and found that penumbra is more sensitive to the beam size than to the target thickness [see Figs. A3(b)–A3(d) in the Appendix A1].
3.B.2. Maximum dose rates
The maximum dose rate that a target delivers can be found from its maximum allowable mean current. For the purpose of this exercise, maximum mean current is defined as the current at which either the peak temperature of the target reaches its recrystallization value or the copper heat remover reaches it softening point. Figure 8 shows the peak temperature of two thickness tungsten targets and the adjacent copper heat remover under different repetition rates and mean currents. The peak temperature increases linearly with mean current, and therefore the maximum current can be easily found by interpolation. For instance, by setting the maximum temperature of W and Cu to be 1500°C and 500°C respectively, for the 1 mm W target at 100 Hz repetition rate, the maximum mean current is limited by Cu, i.e., 0.087 mA [point B in Fig. 8(a)].
Figure 8.
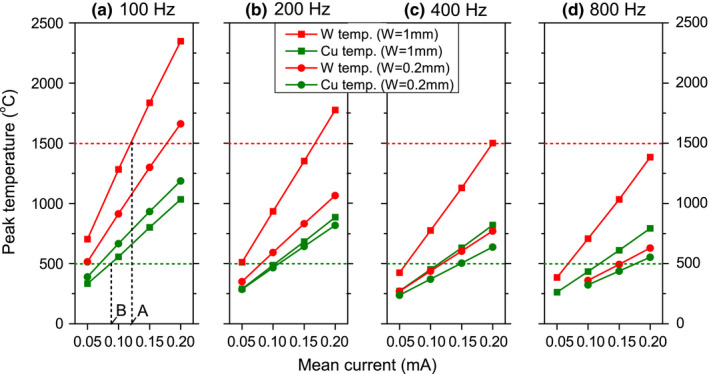
Peak temperatures of the tungsten target and copper heat remover for 1 mm and 0.2 mm thick tungsten targets at various repetition rates and mean currents. The peak current increases linearly with mean current. Thin targets result in lower peak current. The maximum mean currents under certain operational conditions (such as point A for tungsten, and point B for copper) can be found by the intersections between the temperature curves and the maximum allowable temperatures of W (1500°C indicated by dashed red line) and Cu (500°C indicated by dashed green line). All simulated electron beams have FWHM of 1 mm. [Color figure can be viewed at wileyonlinelibrary.com]
From the maximum mean current, the maximum dose rate can be calculated by taking into account the dose delivered per electron (Fig. 7). Table 2 summarizes the maximum dose rate delivered at 2.5 cm deep in a water phantom (i.e., maximum depth dose region, where on average each electron can deposit energy ~ 6.5 × 10⁻⁶ MeV/cm3) for tungsten target. From Fig. 8 and Table 2 we draw three conclusions: (a) Repetition rate has a larger effect on thin targets than on thick targets. For instance, for the 1.0 mm and 0.2 mm targets, when the repetition rate increases from 100 Hz to 800 Hz, the dose rate increases about 1.4 times from 0.57 to 0.77 Gy/s and 2.5 times from 0.46 to 1.16 Gy/s respectively. This is because for target thickness < 0.35 mm, the center of the energy build‐up region is buried in the Cu layer, which results in a lower energy density deposited in the W, and thus the track temperature is reduced which again results in a low peak temperature. (b) In this simple design, the limiting factor for dose rate is the softening temperature of Cu, since copper reaches its softening temperature earlier than W reaches its recrystallization value [see points A and B in Fig. 8(a)]. A better heat remover design thus can further increase the dose rate. For instance, if 30°C boundary condition instead of 100°C is applied to Cu, then the peak temperature can reduce approximately 70°C, which results in a 1.2 times higher dose delivery (i.e., 1.35 Gy/s instead of 1.16 Gy/s listed in Table 2) for the 0.2 mm target under 800 Hz. (c) Since the limiting factor is the softening temperature of Cu, the maximum dose rate delivered by W and W25Re targets are almost equal even though the maximum temperature seen in W is several hundred °C lower than W25Re under the same operational conditions.
Table 2.
Maximum dose rate delivered at 100 cm SSD of 0.2 and 1.0 mm thick W targets under different repetition rates for electron beam size with FWHM of 1 mm. High dose rate can be obtained by employing a thin target and a high repetition rate
| Max. dose rate (Gy/s) | ||
|---|---|---|
| Repetition rate (Hz) | W target: 1.0 mm | W target: 0.2 mm |
| 100 | 0.57 | 0.46 |
| 200 | 0.67 | 0.72 |
| 400 | 0.74 | 0.96 |
| 800 | 0.77 | 1.16 |
4. Conclusions
In this article, a method to characterize the target transient temperature behavior at its equilibrium state is proposed. By simulating both target temperature and dose distribution under different geometrical and operational conditions, we observe that higher dose rate for 10 MV photons can be achieved by employing thin targets together with the high repetition rates achievable with novel linac designs. With conventional repetition rates, the advantage of thin targets is not seen or less pronounced. Thin targets result in low track temperature, high repetition rates result in small temperature oscillation amplitudes, and both modifications have little effect on depth dose, especially when the target thickness < 1 mm. Increasing the electron beam size can significantly reduce the target temperature, but it will increase the lateral beam profile penumbra. The thermal conductivity of W is two times higher than W25Re. Thus W demonstrates better temperature performance than W25Re, i.e., several hundred °C lower under the same operational conditions. However, the limiting factor for dose delivery in the simple target design studied here is the softening temperature of Cu (assumed to be 500°C in our simulations), which results in a similar maximum dose rate for both target materials. A better heat remover design having either higher softening temperature or faster heat removal capability could permit a further increase in the dose rate.
Acknowlegments
This work is supported by the National Institutes of Health Research Grant No. R21 EB015957‐01, and the Department of Defense No.W81XWH‐13‐1‐0165. The authors thank Dr. Norbert Pelc and Dr. Brendan Whelan for their constructive suggestions. The authors thank Dr. Linchuan Chen for providing C++ code.
Conflicts of interest
P.M.B. is an employee of TibaRay, Inc. P.G.M. and B.W.L. have received research support from Varian Medical Systems and RaySearch Laboratories, outside of the submitted work. B.W.L. is a board member of TibaRay, Inc. R.F. is an employee of Siemens Healthcare. All other authors have no relevant conflicts of interest to disclose.
Appendix A1.
W25Re Results and beam profiles
Simulation of tungsten‐rhenium alloy
Besides tungsten (W), a tungsten‐rhenium alloy (W25Re) is a common target material owing to its higher recrystallization temperature (1600–1800°C) despite a lower melting temperature (3050°C) as well as better strain performance compared to W.36, 37, 38 Of note, the specific heat of W25Re is the same as that of W, but its thermal conductivity is about half that of W over the temperature range 0–2500°C.39, 40 We conducted the same simulations for W25Re as for W (Fig. A1). We found the peak temperature of W25Re target is about several hundred °C higher than W (see Fig. 6) under the same operational conditions, thus there is no net advantage using W25Re over W from a temperature perspective.
Figure A1.
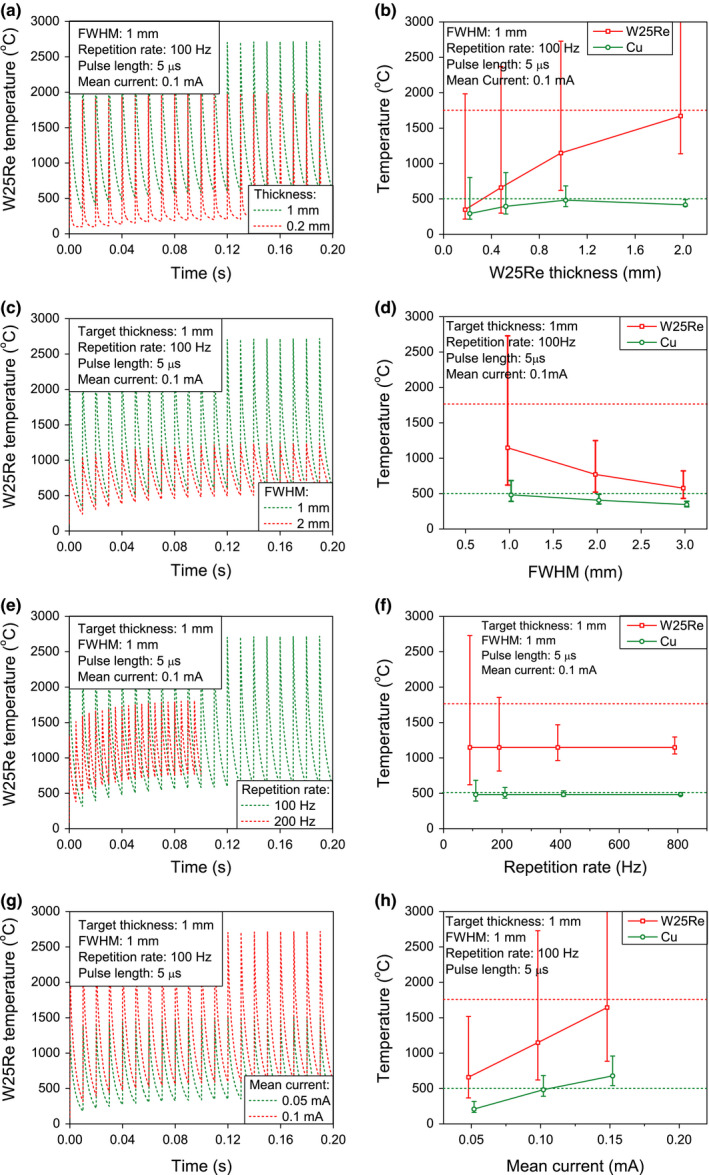
Effect of target and electron beam parameters on the transient and equilibrium state temperature characteristics for W25Re targets and the adjoining Cu heat remover. (a) and (b) Target thickness. (c) and (d) Beam size. (e) and (f) Repetition rate. (g) and (h) Mean current. The W25Re's recrystallization temperature is 1750°C (dashed red horizontal line). The Cu's softening temperature is 500°C (dashed blue horizontal line). The peak temperature of W25Re target is about several hundred °C higher than W (see Fig. 6) under the same operational conditions, thus there is no net advantage using W25Re over W from a temperature perspective. [Color figure can be viewed at wileyonlinelibrary.com]
Simulation of effects of electron beam size and target thickness on depth dose and lateral beam profile
Figure A2 shows the treatment head geometry used to simulate the effect of electron beam size on both the depth dose and lateral beam profile. To calculate the half‐field beam lateral profile, based on the geometry shown in Fig. 1, first, an 8 cm thick half‐field tungsten collimator was placed 40 cm below the target surface. Second, water detectors with width of 0.5 mm, height of 1 cm, length of 10 cm (along the long edge of the half‐field collimator, i.e., x‐axis) were placed at a depth of 2.5 cm (depth of maximum depth dose) in the water phantom from left to right to record the dose distribution.
Figure A2.
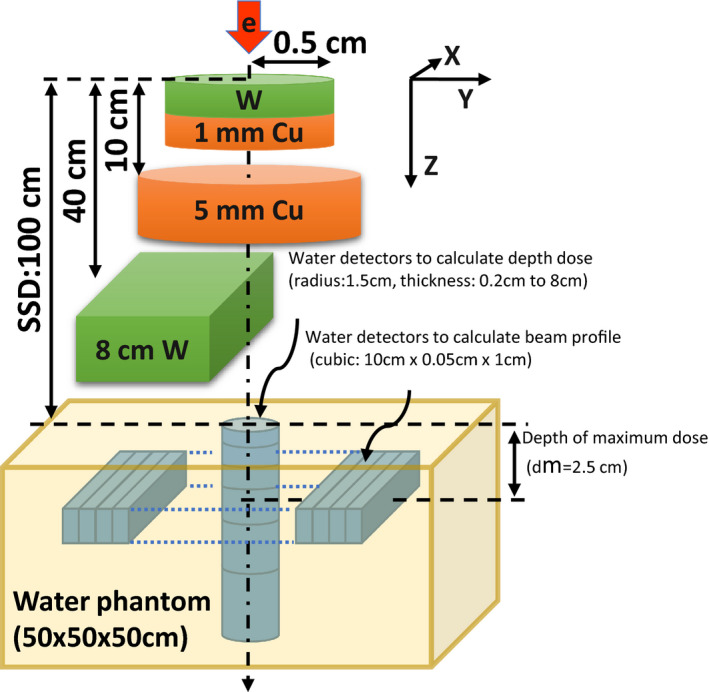
Schematic geometry of the treatment head for dose and beam profile calculation (not to scale). This simple geometry includes a tungsten target, a copper heat remover, a copper plate, a half‐field tungsten collimator, and a water phantom. Water detectors of various sizes are imbedded in the phantom to calculate depth dose and bream profile. [Color figure can be viewed at wileyonlinelibrary.com]
Figure A3 shows the depth doses for a 1 mm tungsten target under electron beams of different sizes. The beam size has negligible effect on the depth dose, because the beam size is small compared to the source‐to‐surface distance. Figures A3(b) and A3(c) show the half‐field beam profiles for different beam sizes and target thicknesses respectively, and Fig. A3(d) compares the corresponding 20–80% penumbras. The penumbra is more sensitive to the beam size than to the target thickness.
Figure A3.
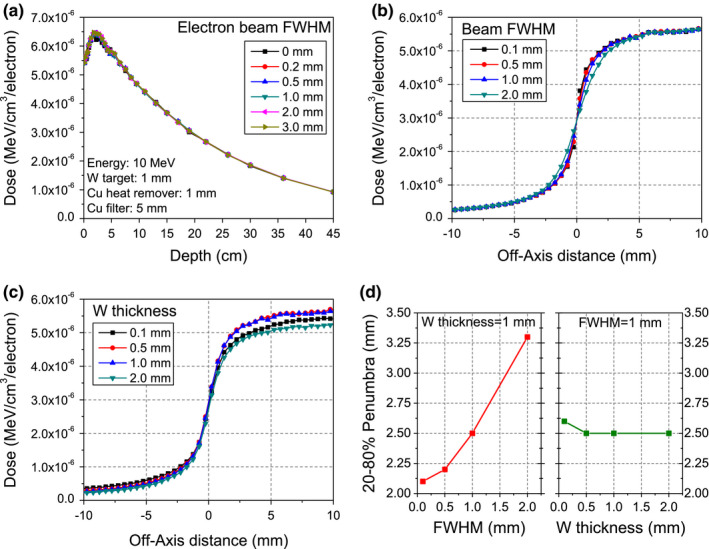
(a) Depth dose curves for tungsten targets with various electron beam sizes. (b) Half‐field beam profiles for different electron beam sizes. (c) Half‐field beam profiles for different tungsten target thicknesses. (d) The corresponding 20–80% half‐field penumbras. Electron beam size has negligible effect on the depth dose. Electron beam size has larger effect than target thickness on beam profile. [Color figure can be viewed at wileyonlinelibrary.com]
Contributor Information
Billy W. Loo, Jr, Email: bwloo@stanford.edu.
Peter G. Maxim, Email: peter.maxim@stanford.edu.
References
- 1. Turesson I. Radiobiological aspects of continuous low dose‐rate irradiation and fractionated high dose‐rate irradiation. Radiother Oncol. 1990;19:1–15. [DOI] [PubMed] [Google Scholar]
- 2. Dale RG. Dose‐rate effects in targeted radiotherapy. Phys Med Bio. 1996;41:1871–1884. [DOI] [PubMed] [Google Scholar]
- 3. Ling CC, Gerweck LE, Zaider M, Yorke E. Dose‐rate effects in external beam radiotherapy redux. Radiother Oncol. 2010;95:261–268. [DOI] [PubMed] [Google Scholar]
- 4. Lohsea I, Langa S, Hrbaceka J, et al. Effect of high dose per pulse flattening filter‐free beams on cancer cell survival. Radiother Oncol. 2011;101:226–232. [DOI] [PubMed] [Google Scholar]
- 5. Liauw SL, Connell PP, Weichselbaum RR. New paradigms and future challenges in radiation oncology: an update of biological targets and technology. Sci Transl Med. 2013;5:173sr2. [DOI] [PMC free article] [PubMed] [Google Scholar]
- 6. Favaudon V, Caplier L, Monceau V, et al. Ultrahigh dose‐rate flash irradiation increases the differential response between normal and tumor tissue in mice. Sci Transl Med. 2014;6:1–9. [DOI] [PubMed] [Google Scholar]
- 7. Montay‐Gruel P, Petersson K, Jaccard M, et al. Irradiation in a flash: unique sparing of memory in mice after whole brain irradiation with dose rates above 100 Gy/s. Radiother Oncol. 2017;124:365–369. [DOI] [PubMed] [Google Scholar]
- 8. Schüler E, Trovati S, King G, et al. Experimental platform for ultra‐high dose rate FLASH irradiation of small animals using a clinical linear accelerator. Int J Radiation Oncol Biol Phys. 2017;97:195–203. [DOI] [PubMed] [Google Scholar]
- 9. Loo BW, Schüler E, Lartey FM, et al. Delivery of ultra‐rapid flash radiation therapy and demonstration of normal tissue sparing after abdominal irradiation of mice. Int J Radiat Oncol Biol Phys. 2017;98:E16. [Google Scholar]
- 10. Lartey FM, Simmons D, Schüler E, et al. FLASH: a new paradigm in radiotherapy‐Implications for cognitive behavior and neuroinflammation. Proc Radiat Res Soc. 2016. [Google Scholar]
- 11. Levitt SH, Purdy JA, Perez CA, Poortmans P. Technical Basis of Radiation Therapy, 5th edn. New York: Springer; 2012. [Google Scholar]
- 12. Chang Z, Wu QW, Adamson J, et al. Commissioning and dosimetric characteristics of Truebeam system: composite data of three Truebeam machines. Med Phys. 2012;39:6981–7018. [DOI] [PubMed] [Google Scholar]
- 13. Xiao Y, Kry SF, Popple R, et al. Flattening filter‐free accelerators: a report from the AAPM therapy emerging technology assessment work group. J Appl Clin Med Phys. 2015;16:12–29. [DOI] [PMC free article] [PubMed] [Google Scholar]
- 14. Pandey R, Gurumurthy J, Galinski A Haddad, Dhaduk P. Stereotactic body radiation therapy: a review of applications and outcomes. J Nucl Med Radiat Ther. 2015;6:1000229. [Google Scholar]
- 15. Wilson P, Jones B, Yokoi T, Hill M, Vojnovic B. Revisiting the ultra‐high dose rate effect: implications for charged particle radiotherapy using protons and light ions. Br J Radiol. 2012;85:e933–e939. [DOI] [PMC free article] [PubMed] [Google Scholar]
- 16. Gete E, Duzenli C, Milette MP, et al. A Monte Carlo approach to validation of FFF VMAT treatment plans for the TrueBeam linac. Med Phys. 2013;40:021707. [DOI] [PubMed] [Google Scholar]
- 17. Kragl G, Wetterstedt SA, Knausl B, et al. Dosimetric characteristics of 6 and 10 MV unflattened photon beams. Radiother Oncol. 2009;93:141–146. [DOI] [PubMed] [Google Scholar]
- 18. Tartar A. Monte Carlo simulation of 10 MV photon beams and beam profile validations. Measurement. 2013;46:3026–3031. [Google Scholar]
- 19. Ihsan A, Heo SH, Cho SO. Optimization of X‐ray target parameters for a high‐brightness microfocus X‐ray tube. Nucl Instr Meth B. 2007;264:371–377. [Google Scholar]
- 20. Uytdenhouwen I, Decreton M, Hirai T, Linke J, Pintsuk G, Van Oost G. Influence of recrystallization on thermal shock resistance of various tungsten grades. J Nucl Mater. 2007;363:1099–1103. [Google Scholar]
- 21. Cho YB, Munro P. Kilovision: thermal modeling of a kilovoltage X‐ray source integrated into a medical linear accelerator. Med Phys. 2002;29:2101–2108. [DOI] [PubMed] [Google Scholar]
- 22. Graves WS, Bessuille J, Brown P, et al. Compact x‐ray source based on burst‐mode inverse Compton scattering at 100 kHz. Phys Rev Accel Beams. 2014;17:120701. [Google Scholar]
- 23. Tantawi SG. Room temperature high repetition rate RF structures for light sources. In Presented at the ICFA Future Light Sources meeting. SLAC National Accelerator Laboratory: Menlo Park; 2010: 1–25. https://www-conf.slac.stanford.edu/icfa2010/proceedings/FEL_talk.pdf. [Google Scholar]
- 24. Los Alamos National Laboratory . MCNPX user's manual version 2.7.0. LANL Report LA‐CP‐11‐00438; 2011.
- 25. Tickoo S. ANSYS Workbench 14.0: A Tutorial Approach. Schererville: CADCIM Technologies; 2012. [Google Scholar]
- 26. Georg D, Knoos T, McClean B. Current status and future perspective of flattening filter free photon beams. Med Phys. 2011;38:1280–1293. [DOI] [PubMed] [Google Scholar]
- 27. Anderson R, Lamey M, MacPherson M, Carlone M. Simulation of a medical linear accelerator for teaching purposes. J Appl Clin Med Phys. 2015;16:359–7716. [DOI] [PMC free article] [PubMed] [Google Scholar]
- 28. Knoll GF. Radiation Detection and Measurement, 3rd edn. Hoboken: John Wiley & Sons Inc; 2000. [Google Scholar]
- 29. Powell RW, Ho CY, Liley PE. Thermal conductivity of selected materials. National Standard Reference Data Series‐National Bureau of Standards‐8; 1966.
- 30. White GK, Collocott SJ. Heat capacity of reference materials: Cu and W. J Phys Chem Ref Data. 1984;13:1251–1257. [Google Scholar]
- 31. Doherty RD, Hughes DA, Humphreys FJ, et al. Current issues in recrystallization: a review. Mater Sci Eng. 1997;238:219–274. [Google Scholar]
- 32. Kim HS, Lim ST, Jin Y, Lee JY, Song JM, Kim GH. Recrystallization of bulk and plasma‐coated tungsten with accumulated thermal energy relevant to Type‐I ELM in ITER H‐mode operation. J Nucl Mater. 2015;463:215–218. [Google Scholar]
- 33. Juntong N, Pharaphan K, Ratchasima N. The optimized X‐ray target of electron linear accelerator for radiotherapy. In Proceedings of IPAC2016, Busan, Korea, TUPOY016. Geneva: JACOW; 2016: 1933–1935. [Google Scholar]
- 34. Herwiningsih S, Fielding A. Focal spot estimation of an Elekta dedicated stereotactic linear accelerator Monte Carlo model. In 13th South‐East Asian Congress of Medical Physics 2015, Vol. 694. Brsitol: IOP Publishing; 2016: 012013. [Google Scholar]
- 35. Gorlachev GE, Polozov SM, Dalechina AV, Ksenofontov AI, Kistenev AV. Effect of initial electron beam parameters of a linear accelerator on the properties of Bremsstrahlung radiation in a radiotherapy setting. Phys Part Nucl Lett. 2016;13:808–811. [Google Scholar]
- 36. Savitskii EM, Tylkina MA, Ipatova SI, Pavlova EI. Properties of tungsten‐rhenium alloys. Met Sci Heat Treat. 1960;2:483–486. [Google Scholar]
- 37. Bryskin B. Tungsten‐Rhenium alloys wire: overview of thermomechanical processing and properties data. In Knerigner G, Rödhammer P, Wildner H. 15th International Plansee Seminar, Vol.1. Reutte: Plansee Holding AG; 2001: 234. [Google Scholar]
- 38. François C. Material Handbook: A Concise Desktop Reference, 2nd edn. London: Springer; 2008. [Google Scholar]
- 39. Tanabe T, Eamchotchawalit C, Busabok C, Taweethavorn S, Fujitsuka M, Shikama T. Temperature dependence of thermal conductivity in W and W‐Re alloys from 300 to 1000 K. Mater Lett. 2003;57:2950–2953. [Google Scholar]
- 40. Jun K, Hoch M. Thermal conductivity of tantalum, tungsten, rhenium, Ta‐10W, T111, T222, W‐25Re in the temperature range 1500‐2800 OK. Air Force Materials Laboratory, Technical Report AFML‐TR‐66‐367; 1966.


