Abstract
The use of three-dimensional (3D) analysis of forensic evidence is highlighted in comparison with traditional methods. This three-dimensional analysis is based on the registration of the surface from a bitten object. The authors propose to use Cone Beam Computed Tomography (CBCT), which is used in dental practice, in order to study the surface and interior of bitten objects and dental casts of suspects. In this study, CBCT is applied to the analysis of bite marks in foodstuffs, which may be found in a forensic case scenario. 6 different types of foodstuffs were used: chocolate, cheese, apple, chewing gum, pizza and tart (flaky pastry and custard). The food was bitten into and dental casts of the possible suspects were made. The dental casts and bitten objects were registered using an x-ray source and the CBCT equipment iCAT® (Pennsylvania, EUA). The software InVivo5® (Anatomage Inc, EUA) was used to visualize and analyze the tomographic slices and 3D reconstructions of the objects. For each material an estimate of its density was assessed by two methods: HU values and specific gravity. All the used materials were successfully reconstructed as good quality 3D images. The relative densities of the materials in study were compared. Amongst the foodstuffs, the chocolate had the highest density (median value 100.5 HU and 1,36 g/cm3), while the pizza showed to have the lowest (median value -775 HU and 0,39 g/cm3), on both scales. Through tomographic slices and three-dimensional reconstructions it was possible to perform the metric analysis of the bite marks in all the foodstuffs, except for the pizza. These measurements could also be obtained from the dental casts. The depth of the bite mark was also successfully determined in all the foodstuffs except for the pizza. Cone Beam Computed Tomography has the potential to become an important tool for forensic sciences, namely for the registration and analysis of bite marks in foodstuffs that may be found in a crime scene.
KEYWORDS: Forensic Odontology, Stature Estimation, Carrea’s Index, Dental Arch
Introduction
Both the bite mark and the dentition that inflicts it are three-dimensional phenomena (1). The bi-dimensional registration of 3D structures implies distortion and loss of information (2). However, the majority of the scientific community continues to describe and quantify the bite patterns in two dimensions (1). The recent development of three-dimensional methods for bite mark analysis has become a highlighted procedure when compared to the traditional methods (3-5).
In 2003, Thali et al. (6) presented a new 3D method for bite mark analysis on skin, based on forensic 3D/CAD supported photogrammetry and the use of a 3D surface scanner. According to Evans et al., despite the fact that this method has been validated in court, it is still very expensive and the error range is up to 1mm (7).
In 2007, Martin-de las Heras et al (3), studied bite marks in pig skin with a 3D contact scanner (Picza®) and a software for bite mark analysis (Dentalprint®). The scanner used has limitations due to the reduced number of registration axes, lack of mobility and slow capture time (7). This method uses bite impressions (7).
Also in the year 2007, Blackwell et al. (1) presented a method of bite mark analysis by means of a laser scanner (ModelMaker H40®). In this study there were simulated bite marks in wax. This technique uses the impression of the bite marks (7) and the use of powder sprays to give the surfaces a matt finish and achieve maximum laser signal (1). The time of capture is from 15 to 30 minutes (1).
By 2011, Evans et al. (7) simulated a bite mark with Photoshop®, and applied it on a prosthetic arm. This pseudo bite mark and the dental casts of the biter were registered by stereophotogrammetry (MAVIS Nikon®) and laser scanner (Vivid® 910). The MAVIS system was able to effectively produce the 3D image of the pseudo bite mark and the Vivid 910® adequately recorded the dental casts. According to the authors, to collect all the required data for three-dimensional analysis the MAVIS camera and the laser scanner must be used in conjunction (7, 8). Furthermore, the MAVIS system has an error range of +/- 1mm (7).
Naether et al. (2), in 2012, used 3D optical surface scanning technology (GOM ATOS 3D) for the documentation of bite marks in foodstuffs and to register the dental casts of the biters. For a successful scan, sprays had to be used to decrease the reflection factor of the surface of the objects (2).
Computed Tomography (CT) uses a source of ionizing radiation, an object and an image detector. The final image in a grayscale, results from the radiation absorbed by each component of the object (9). The CT technique allows an accurate 3D reconstruction (10).
Cone Beam Computed Tomography, specially developed for the imaging of the structures pertinent to dentistry, uses relatively small equipment, with lower costs and lower radiation doses (15 times lower) than a conventional CT (10-13). The images are obtained in series of DICOM files (Digital Imaging and Communication in Medicine), that can be analyzed through several different software suites (11).
From the tomographic images it is possible to obtain panoramic and cephalometric images, as well as 3D reconstructions. Nowadays, the latter are essentially applied in the fields of implantology, orthodontics and temporomandibular joint disorders (11, 13).
The aim of this paper was to study the surface and interior of the bitten objects by Cone Beam Computed Tomography, which is used in dental practice. In this study, CBCT is applied to the analysis of bite marks in foodstuffs, which may be found in a forensic case scenario.
Material and Methods
Six different types of foodstuffs were used: chocolate (Nestle® Chocolat Brut, Switzerland), cheese (Babybel®, France), apple (royal gala 70/80, cat. II, Portugal), chewing gum (Trident Senses®, Strawberry, France), pizza (Pizza Hut®, Margherita) and a custard tart. The flaky pastry of the tart contains flour, salt and butter and the custard is composed of milk, sugar and eggs. The food was bitten into and dental casts of the hypothetical suspects were made.
The dental casts were made using alginate impression material (Orthoprint®, Zhermack, Italy) and type III stone (Dental hydrocal®, Kerr, Germany) prepared according to manufacturer’s specifications and in conjunction with accepted dental laboratory techniques.
Both the dental casts and bitten objects were registered using an x-ray source and the CBCT equipment iCAT® (Imaging Sciences International, Pennsylvania, EUA). All the images were captured with a field of view (FOV) of 16cm diameter and 6 cm height, a voxel size of 0,2mm and an exposure time of 14.7 seconds.
The software InVivo5® (Anatomage Inc, EUA) was used to visualize and analyze the images. An estimation of the density of the foodstuffs and dental casts was accessed by determining HU values in 6 different points for each material. To validate this data a comparative analysis was made with the specific gravity of the objects. The objects were analyzed both through the tomographic slices and the 3D reconstructions. The DICOM images were analyzed by two observers in different time periods.
Results
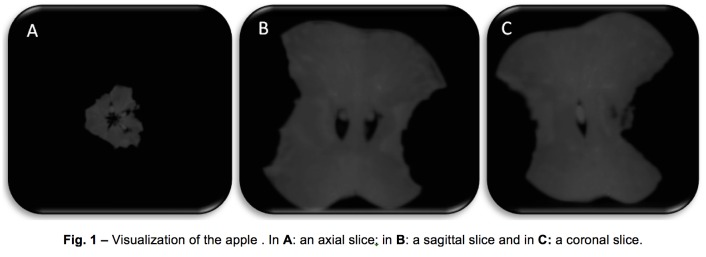
The study obtained series of DICOM images corresponding to the axial, sagittal and coronal slices, from all the sampling (fig.1). Of all the materials in study, the dental cast had the highest density both in a grayscale evaluation (qualitative) and specific gravity (g/cm3). Amongst the foodstuffs, the chocolate had the highest density (median value 100.5 HU and 1,36 g/cm3), while the pizza was shown to have the lowest (median value -775 HU and 0,39 g/cm3), in both scales. Our results supported that, and within our grayscale, chocolate is hyperdense [52HU;136 HU] and pizza is hypodense [-981 HU; -44HU]. Furthermore, for the dental casts results between -147HU and 2029HU were reported.
Fig. 1.
Visualization of the apple . In A: an axial slice, in B: a sagittal slice and in C: a coronal slice.
All the foodstuffs and dental casts were analyzed in the tomographic slices and the 3D reconstructions. In all the foodstuffs marks caused by both of the dental arches were present. Therefore, using metric and anatomic parameters it was possible to distinguish between the upper and lower dental arches.
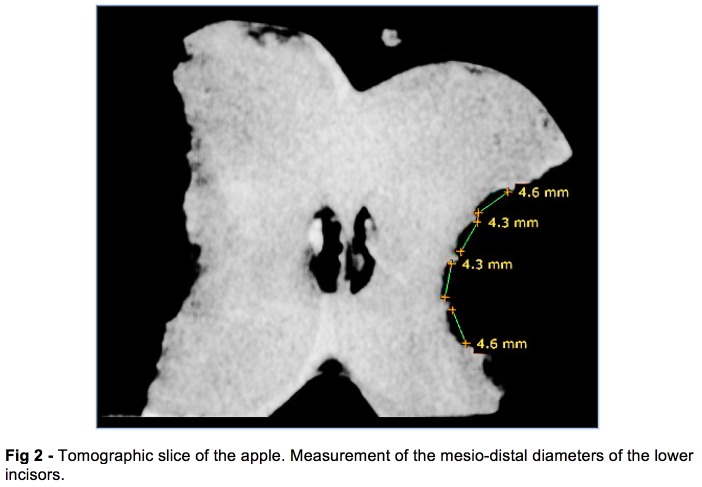
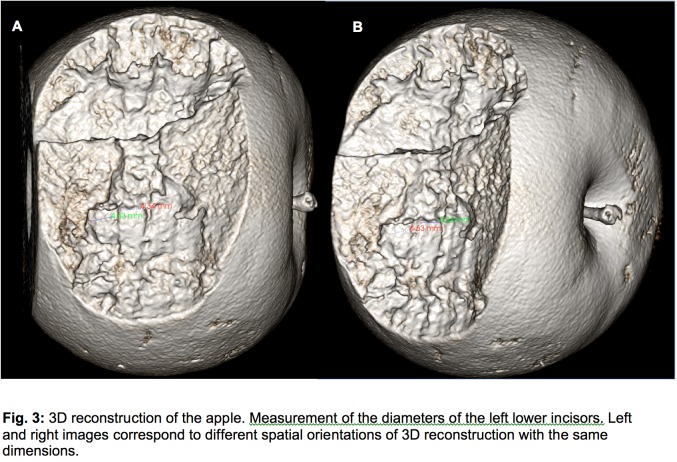
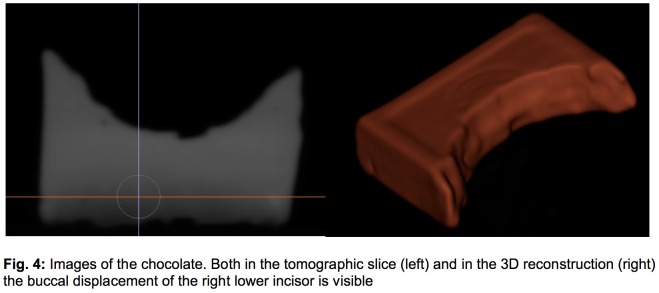
The mesio-distal diameters of teeth and intercanine distances were successfully measured in the dental casts and in all the foodstuffs, except the pizza (Fig. 2 and 3). These anatomic references for bite mark analysis of anterior teeth were identified in the DICOM images from the foodstuffs. Our results demonstrate that teeth can transfer their unique features to the bitten substrate. The interobserver differences were not significant in this study. Indentifying features in the bite marks like the shape of the arch, diastema or teeth misalignment could be recognized (Fig. 4).
Fig. 2.
Tomographic slice of the apple. Measurement of the mesio-distal diameters of the lower incisors.
Fig. 3.
3D reconstruction of the apple. Measurement of the diameters of the left lower incisors. Left and right images correspond to different spatial orientations of 3D reconstruction with the same dimensions.
Fig. 4.
Images of the chocolate. Both in the tomographic slice (left) and in the 3D reconstruction (rigth) the buccal displacement of the right lower incisor is visible
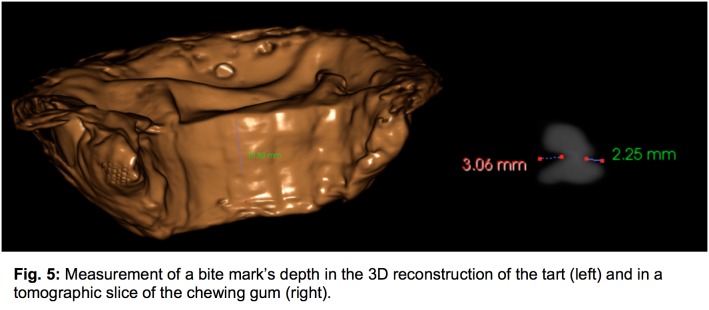
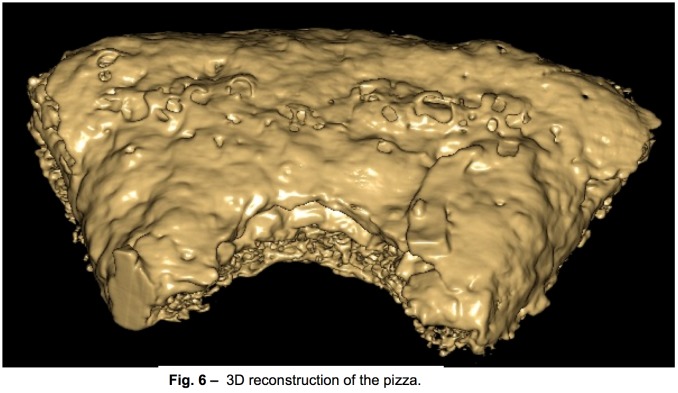
The cheese, chocolate, chewing gum and apple (Fig. 5) were demonstrated to have the best properties for the registration of the bite marks, while the pizza was the worst (Fig. 6).
Fig. 5.
Measurement of a bite mark’s depth in the 3D reconstruction of the tart (left) and in a tomographic slice of the chewing gum (right).
Fig. 6.
3D reconstruction of the pizza.
DISCUSSION AND CONCLUSIONS
The grey levels displayed by CBCT equipments are not representative of “true” HU units, unlike those that can be found in a CT. These values are based upon the device and scanning settings (14). The absence of a standard scheme for scaling the reconstructed attenuation coefficients makes it difficult to compare values resulting from different machines (15).
Despite the inability of CBCT to precisely display Hounsfield units there is sufficient correspondence between this value and the grey level (16). In this paper, for all materials, the same equipment and the same registration parameters were used. The image resolution was maximized by using a minimum voxel size (0.2mm) and a long time of exposure (14.7 seconds). Hounsfield units were used, as an internal tool, to predict a comparative analysis of density. Though the HU obtained may not correspond to the correct density of the objects, we can estimate their relative density and predict which are hyperdense or hypodense. These results were supported by those obtained in the specific gravity analysis.
We can discuss our results considering the heterogeneity and homogeneity of the materials in study. The difference between heterogeneous and homogeneous mixtures is the extent to which the materials are uniformly mixed. A homogeneous mixture consists of components which are uniformly distributed throughout the mixture. A heterogeneous mixture has a composition where the components are not uniformly distributed or have localized regions with different properties.
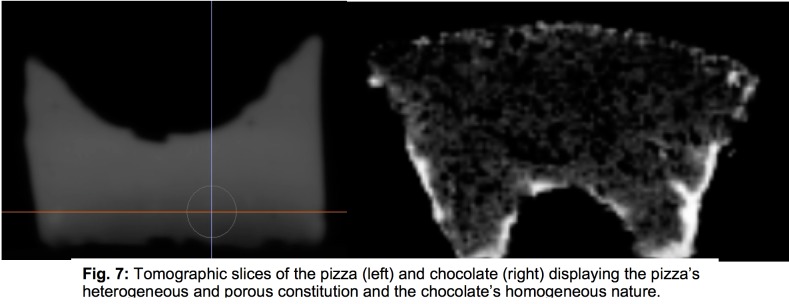
In our sample, the more heterogeneous foodstuffs had the more variable HU values. For example, the pizza had the highest standard deviation amongst the foodstuffs due to its heterogeneous and porous nature. The chocolate, which is homogeneous, had the lowest (Fig. 7).
Fig. 7.
Tomographic slices of the pizza (left) and chocolate (rigth) displaying the pizza’s heterogeneous and porous constitution and the chocolate’s homogeneous nature.
Footnotes
The authors declare that they have no conflict of interest.
References
- 1.Blackwell SA, Taylor RV, Gordon I, Ogleby CL, Tanijiri T, Yoshino M, et al. 3-D imaging and quantitative comparison of human dentitions and simulated bite marks. Int J Legal Med. 2007. Jan;121(1):9–17. 10.1007/s00414-005-0058-6 [DOI] [PubMed] [Google Scholar]
- 2.Naether S, Buck U, Campana L, Breitbeck R, Thali M. The examination and identification of bite marks in foods using 3D scanning and 3D comparison methods. Int J Legal Med. 2012. Jan;126(1):89–95. 10.1007/s00414-011-0580-7 [DOI] [PubMed] [Google Scholar]
- 3.Martin-de las Heras S, Valenzuela A, Torres JC. Luna-del-castillo JD. Effectiveness of Comparison Overlays Generated with DentalPrint r Software in Bite. J Forensic Sci. 2007;52(1):5–10. 10.1111/j.1556-4029.2006.00321.x [DOI] [PubMed] [Google Scholar]
- 4.Martin-de las Heras S, Valenzuela A, Ogayar C, Valverde J, Torres JC. Computer-Based Production of Comparison Overlays from 3D-Scanned Dental Casts for Bite Mark Analysis. J Forensic Sci. 2005;50(1):127–33. 10.1520/JFS2004226 [DOI] [PubMed] [Google Scholar]
- 5.Clement JG, Blackwell S. I
- 6.Thali MJ, Braun M, Markwalder TH, Brueschweiler W, Zollinger U, Malik NJ, et al. Bite mark documentation and analysis: the forensic 3D/CAD supported photogrammetry approach. Forensic Sci Int. 2003;135(2):115–21. 10.1016/S0379-0738(03)00205-6 [DOI] [PubMed] [Google Scholar]
- 7.Evans ST, Jones C, Plassmann P. 3D imaging for bite mark analysis. Imaging Sci J. 2011;000(0):1–10. [Google Scholar]
- 8.Evans S, Jones C, Plassmann P. 3D imaging in forensic odontology. J Vis Commun Med. 2010. Jun 16;33(2):63–8. 10.3109/17453054.2010.481780 [DOI] [PubMed] [Google Scholar]
- 9.Miles D, Danforth R. A Clinician’ s Guide to Understanding Cone Beam Volumetric Imaging (CBVI). Peer-Reviwed Publication - Academy of Dental Therapeutics and Stomatology 2008;
- 10.Cattaneo PM, Bloch CB, Calmar D, Hjortshřj M, Melsen B. Comparison between conventional and cone-beam computed tomography-generated cephalograms. American journal of orthodontics and dentofacial orthopedics : official publication of the American Association of Orthodontists, its constituent societies, and the American Board of Orthodontics. American Association of Orthodontists. 2008. Dec;134(6):798–802. [DOI] [PubMed] [Google Scholar]
- 11.Harris D, Horner K, Gröndahl K, Jacobs R, Helmrot E, Benic GI, et al. E.A.O. guidelines for the use of diagnostic imaging in implant dentistry 2011. A consensus workshop organized by the European Association for Osseointegration at the Medical University of Warsaw. Clin Oral Implants Res. 2012. Nov;23(11):1243–53. 10.1111/j.1600-0501.2012.02441.x [DOI] [PubMed] [Google Scholar]
- 12.Garib DG, Raymundo R, Jr, Raymundo MV. Tomografia computadorizada de feixe cônico (Cone beam): entendendo este novo método de diagnóstico por imagem com promissora aplicabilidade na Ortodontia. Rev Dent Press Ortodon Ortop Facial. 2007;12(2):139–56. 10.1590/S1415-54192007000200018 [DOI] [Google Scholar]
- 13.Davies J, Johnson B, Grage N. Effective doses from cone beam CT investigation of the jaws. Dentomaxillofac Radiol. 2012;41:30–6. 10.1259/dmfr/30177908 [DOI] [PMC free article] [PubMed] [Google Scholar]
- 14.Parsa A, Ibrahim N, Hassan B, et al. Influence of cone beam CT scanning parameters on grey value measurements at an implant site. Dentomaxillofacial Radiology 2013;42(3):79884780, 1-7. [DOI] [PMC free article] [PubMed]
- 15.Mah P, Reeves TE, McDavid WD. Deriving Hounsfield units using grey levels in cone beam computed tomography. Dentomaxillofac Radiol. 2010;39(6):323–35. 10.1259/dmfr/19603304 [DOI] [PMC free article] [PubMed] [Google Scholar]
- 16.Ballrick JW, Palomo JM, Ruch E, Amberman BD, Hans MG. Image distortion and spatial resolution of a commercially available cone-beam computed tomography machine. American journal of orthodontics and dentofacial orthopedics : official publication of the American Association of Orthodontists, its constituent societies, and the American Board of Orthodontics 2008 Oct;134(4):573–82. [DOI] [PubMed]


