

Summary
ATG4B stimulates autophagy by promoting autophagosome formation through reversible modification of ATG8. We identify ATG4B as a substrate of mammalian sterile20-like kinase (STK) 26/MST4. MST4 phosphorylates ATG4B at serine residue 383, which stimulates ATG4B activity and increases autophagic flux. Inhibition of MST4 or ATG4B activities using genetic approaches or an inhibitor of ATG4B suppresses autophagy and the tumorigenicity of glioblastoma (GBM) cells. Furthermore, radiation induces MST4 expression, ATG4B phosphorylation, and autophagy. Inhibiting ATG4B in combination with radiotherapy in treating mice with intracranial GBM xenograft markedly slows tumor growth and provides a significant survival benefit. Our work describes an MST4-ATG4B signaling axis that influences GBM autophagy and malignancy, and whose therapeutic targeting enhances the anti-tumor effects of radiotherapy.
Keywords: glioblastoma, glioma stem-like cells, MST4/STK26, ATG4B, phosphorylation, autophagy, tumorigenicity, tumor response to radiation, ATG4B inhibitor NSC185058, combination therapy
Graphical Abstract
Highlights
-
•
MST4 kinase regulates the growth, sphere formation, and tumorigenicity of GBM cells
-
•
MST4 stimulates autophagy by activating ATG4B through phosphorylation of ATG4B S383
-
•
Radiation increases MST4 expression and ATG4B phosphorylation, inducing autophagy
-
•
Inhibiting ATG4B enhances the anti-tumor effects of radiotherapy in GBM PDX models
Huang et al. show that radiation induces MST4 expression and that MST4 phosphorylates ATG4B at serine 383, which increases ATG4B activity and autophagic flux. Inhibition of ATG4B reduces autophagy and tumorigenicity of glioblastoma (GBM) cells and improves the impact of radiotherapy on GBM growth in mice.
Significance
Autophagy is known to sustain tumor growth and contribute to tumor survival when challenged by cytotoxic and/or targeted therapies. Interest in inhibiting this self-protective mechanism has a lengthy history in cancer research and treatment. We show that MST4 phosphorylates ATG4B, which stimulates ATG4B to act on LC3, thereby increasing autophagic flux. Both MST4 and ATG4B are required for GBM cell autophagy as well as tumorigenicity. Elevated MST4 and phosphorylated ATG4B associate with GBM prognosis. Moreover, radiation activates this signaling axis. A small-molecule inhibitor targeting ATG4B in combination with radiotherapy impairs intracranial xenograft growth, resulting in significant survival extensions for treated animals. This study identifies a pro-autophagic signaling axis in GBM, whose pharmacologic inhibition enhances the anti-tumor activity of radiation.
Introduction
Glioblastoma (GBM) is the most common primary malignant tumor of the CNS in adults, and carries an extremely poor prognosis (Osuka and Van Meir, 2017, Wen and Kesari, 2008). GBM is known for its intrinsic and/or ability to acquire resistance to virtually all available therapies (Dunn et al., 2012). Gene expression profile studies have subclassified GBM into three transcriptional types, proneural (PN), mesenchymal (MES), and classical (CL) (Wang et al., 2017), which has stimulated testing of targeted therapeutics based on known tumor molecular characteristics. However, and irrespective of molecular subclassification, nearly all GBM are treated with radiation and temozolomide (TMZ), which are known to induce autophagy that contributes to tumor cell survival (Kondo et al., 2005, White, 2015).
(Macro)autophagy is an evolutionally conserved dynamic cellular process for the catabolism of proteins and damaged organelles in a lysosome-dependent manner (Levine and Kroemer, 2008, Mizushima and Komatsu, 2011). Autophagy plays a key role in metabolism and can serve a protective role for cells and tissues under stress conditions (White, 2015). With respect to cancer, autophagy-mediated intracellular catabolism sustains tumors in response to treatments. As such, autophagy is part of an adaptive response that contributes to a tumor's acquisition of resistance to treatment (Amaravadi et al., 2016, White, 2015). There is substantial interest in inhibiting this survival mechanism while treating cancers such as GBM (Janku et al., 2011, Kondo et al., 2005, Kroemer, 2015). However, attempts to inhibit autophagy have involved non-specific agents with relatively high toxicity (Amaravadi et al., 2016, Rosenfeld et al., 2014). Improved understanding of molecular mechanisms regulating autophagy could reveal targets for selective and specific inhibition, which would enhance the anti-tumor activity of cytotoxic therapies while reducing toxic effects of treatment.
Autophagosome biogenesis involves two sequential ubiquitin-like conjugation steps: one involving ATG12-ATG5 and the other involving ATG8-phosphatidylethanolamine (PE) (Mizushima et al., 2011, White, 2015). With respect to the latter, ATG4 cysteine proteases cleave newly synthesized ATG8 to reveal a glycine residue for conjugation with membrane-bound PE (lipidation). ATG4 can also remove PE from ATG8 (delipidation). In humans, microtubule-associated protein 1 light chain, LC3B, is the best-characterized ATG8 isoform (Kabeya et al., 2004, Mizushima et al., 2011, Tanida et al., 2004, Xie and Klionsky, 2007), and ATG4B, but not three other ATG4 isoforms (Li et al., 2011, Marino et al., 2003), displays a highly selective preference toward LC3B. The importance of ATG4B in normal development and disease has been investigated using genetically engineered mouse models, which have revealed ATG4B deficiency as causing systemic reductions in autophagic activity (Cabrera et al., 2013, Marino et al., 2010, Read et al., 2011). In cancer, ATG4B has been implicated as a biomarker and potential therapeutic target (Akin et al., 2014).
MST4 is a member of the mammalian sterile20-like (STE) serine/threonine kinase (STK) family (Qian et al., 2001). MST4 is known to activate ERK to induce cell growth and transformation, and in so doing promote the progression of prostate cancer, epithelial-mesenchymal transition of hepatocellular carcinoma, and cancer metastasis (Thompson and Sahai, 2015). The interaction of MST4 with striatin interaction phosphatase and kinase (STRIPAK) has been associated with metastasis (Madsen et al., 2015). MST4 function has also been associated with inflammatory responses through phosphorylation of TRAF6 (Jiao et al., 2015). However, a role for MST4 in tumor autophagy has yet to be demonstrated. In this study, we have sought to determine whether MST4-ATG4B signaling is associated with the induction of autophagy, as well as with tumor cell proliferation, using GBM model systems.
Results
Increased Expression of MST4 (STK26) Correlates with Tumorigenicity and Prognosis of GBM
We recently characterized a panel of patient-derived glioma stem-like cells (GSCs) to study dysregulated signaling pathways. One group of GSCs was PN-like whereas a second group displayed MES-like characteristics. MES-like GSCs were determined to be more tumorigenic and radioresistant (Mao et al., 2013). Analysis of GSC transcriptomes (GEO: GSE67089; http://www.ncbi.nlm.nih.gov/geo) identified the gene encoding MST4, STK26, as one of the top upregulated genes in MES-like GSCs, relative to PN-like GSCs as well as normal neural stem cells and normal astrocytes (Figure 1A and Table S1). Interestingly, expression levels of endogenous MST4 protein in GSC lines PN 17, PN 528, MES M83, and MES 1123 (Mao et al., 2013) as well as a second series of GSCs, GSC JK lines (Srikanth et al., 2013) (Figure 1B), showed association with GSC intracranial tumorigenicity in athymic mice (Figure 1C). Analysis of STK26 expression in the TCGA datasets for low-grade gliomas (LGG) and GBM revealed that elevated STK26 expression is associated with glioma tumor progression (Figure 1D), with MES compared with CL and PN GBM subtypes (Figures 1E and S1A), and with reduced patient survival (Figures 1F and S1B). Multivariate analyses of STK26 expression showed that after adjusting for clinical variables that are commonly used in GBM diagnosis, the prognostic significance of elevated STK26 expression was statistically significant when accounting for patients' age and sex. Moreover, STK26 expression conferred a statistically worse prognosis for patients with TP53 wild-type (WT) tumors but did not achieve statistical significance when stratifying patients based on glioma World Health Organization tumor grade, IDH1 status, or TP53 mutation (Figures 1G and S1C–S1F; Tables S2–S6). The lack of prognostic significance of STK26 expression when accounting for IDH1 status could be attributed to the low levels of STK26 in PN-like GSCs (Figure 1A).
Figure 1.

Increased Expression of STK26 Correlates with Tumorigenicity and Prognosis in GBM
(A) Heatmaps showing the top and bottom 50 most differentially expressed genes or kinase-encoding genes in PN and MES GSCs, neural progenitors, and normal astrocytes (GEO: GSE67089).
(B) Immunoblot (IB) for MST4 and β-actin in indicated GSCs.
(C) H&E (upper) and bioluminescent (BLI, lower) images of indicated GSC brain tumor xenografts. Colors in the BLI images indicated the strength/intensity of BLI signals: red, strong; cyan, intermediate; and blue, weak. Length of time between transplantation and tissue collection is shown below. Red triangle at the bottom indicates the increasing tumor growth ability of GSCs. Scale bars, 1.0 mm.
(D) Comparison of STK26 expression levels between GBM, low-grade glioma (LGG) and normal brain tissues.
(E) Comparison of STK26 expression levels between GBM MES, PN, or CL subtypes.
(F and G) Kaplan-Meier survival analyses for STK26 expression (F) and STK26 expression and IDH1 status (G).
Data in (B) and (C) are representative of two independent experiments with similar results. Box plots in (D) and (E) indicate the median and upper and lower quartiles, with whiskers extending to the minimum and maximum range. Data in (D) to (G) were generated by analysis of a TCGA RNA-sequencing dataset (Tables S2–S4). ∗∗∗p < 0.0001. See also Figure S1 and Tables S1–S6.
Additional examination of gene expression results showed no indication of an appreciable difference between PN and MES GSCs for the expression of other STE family members, including MST1, MST2, STK24, and STK25 (Thompson and Sahai, 2015) (Figure S1G). In fact, immunoblot (IB) analysis showed low or undetectable levels of MST1 and MST2 proteins in both PN and MES GSCs (Figure S1H).
The STK26 promoter was found to be hypermethylated in PN-like GSCs and hypomethylated in MES-like GSCs, as determined by Illumina BeadChip 450K methylation array (450K array) analysis (GEO: GSE90498). Methylation of the STK26 promoter was validated by combined bisulfite and restriction analyses (CoBRA) and with direct bisulfite sequencing (Figures S1I–S1K). These results support epigenetic silencing as a mechanism by which STK26 expression is suppressed in PN-like GSCs.
MST4 Regulates Cell Growth, Self-Renewal, and Tumorigenicity of GSCs
To investigate biological effects of MST4 knockdown in GSCs, we used two different short hairpin RNAs (shRNAs) and effectively suppressed the high-level expression of endogenous MST4 in MES GSCs M83 and 1123 (Figures 1B and S2A). shRNA knockdown inhibited GSC glioma cell growth and sphere-forming ability in vitro (Figures 2A, 2B, and S2B–S2D) and markedly suppressed intracranial tumor growth in athymic nude mice (Figures 2C, S2E, and S2F), thereby significantly prolonging animal subject survival (Figure 2D). Next we expressed an shRNA-resistant MST4 separately in the two GSC lines with shRNA-depleted endogenous MST4 (Figure S2G). We found that rescue with exogenous MST4, but not an empty vector control, restored GSC cell growth and sphere-forming frequency in vitro and tumorigenicity in the brains of athymic mice (Figures 2E–2G, S2H, and S2I).
Figure 2.

MST4 Regulates Cell Proliferation, Glioma Sphere Formation, and Tumorigenicity of GSCs
(A and B) Effects of MST4 knockdown by shRNAs on cell proliferation (A) and sphere-forming frequency (B) of GSC M83. sh-C, a control shRNA.
(C) In vivo BLI of GBM xenografts derived from the luciferase-labeled GSC M83 expressing sh-C, sh-MST4#1, or sh-MST4#2.
(D) Kaplan-Meier survival curves of mice intracranially transplanted with GSC M83 expressing the indicated shRNAs (n = 5).
(E and F) Cell proliferation (E) or limiting dilution neurosphere-forming assay (F) using GSC M83 expressing sh-C or sh-M4 (targeting 3′ UTR of MST4 mRNA), with or without re-expression of an shRNA-resistant MST4.
(G) Representative images of mouse brain sections from mice intracranially implanted with the GSC M83 or 1123 with indicated modification and quantification of tumor volume. Black arrows, tumor xenografts in the brain. n = 5. Scale bars, 1.0 mm.
(H and I) Cell proliferation (H) and limiting dilution neurosphere-forming assay (I) using GSC 23 expressing MST4-WT (wild-type), -K53E, or -T178A.
(J) In vivo BLI of GBM xenografts derived from the luciferase-labeled GSC 23 with indicated modifications.
(K) Kaplan-Meier survival curves of mice intracranially injected with GSC 23 cells expressing a control vector or MST4-WT, -K53E, or -T178A. n = 5.
In (E–K), Vec, a vector control. Colored scale bars in (C) and (J) represent photons/s/cm2/steradian. Data are representative of two to three independent experiments with similar results. All bar plot data are means ± SEM. ∗∗p < 0.01. See also Figure S2.
To further investigate the effects of modulating MST4 expression, we transduced cells with constructs to express exogenous WT MST4 or kinase-dead (KD) MST4 mutants K53E and T178A (Xiong et al., 2015) in GSC 23 (Bhat et al., 2013), 528, and JK42 with low endogenous MST4 (Figures 1B and S2J). Ectopic expression of WT but not KD MST4 mutants promoted GSC growth and sphere-forming frequency in vitro (Figures 2H, 2I, S2K, and S2L). Ectopic WT, but not KD MST4, markedly enhanced GSC tumorigenicity of orthotopic GBM xenografts and reduced animal survival (Figures 2J, 2K, and S2M).
MST4 Directly Phosphorylates ATG4B at Serine 383 in GSCs
To investigate molecular mechanisms for MST4 in cancer, we performed proteomics analysis (Baucum et al., 2015) of GSC 17, with and without exogenous MST4 expression, and for GSC lines M83 and JK83, which have high endogenous expression of MST4 (Figure 1B). Among a total of 2,876 phosphorylated proteins with detected p-Ser (p-S) or p-Thr (p-T) sites in these GSCs, ∼200 phosphorylated proteins were found in GSC 17 modified for expression of exogenous MST4, but not in unmodified GSC 17. These proteins were also phosphorylated in M83 and JK83. With respect to the identified phosphorylated proteins, we found ATG4B, a major cysteine protease that cleaves LC3 and catalyzes the lipidation and delipidation of LC3 (Xie and Klionsky, 2007), to be highly phosphorylated at serine residue 383 (S383) in GSCs expressing MST4 (Figures 3A and S3A). The amino acid sequence surrounding S383 is highly conserved in ATG4B among multiple species (Figure 3B) and matches an MST4 consensus phosphorylation site identified by in silico analysis (Figure S3B) (Hu et al., 2014), which is not present in ATG4A, ATG4C, or ATG4D (Figure S3C). Consistent with in silico predictions, MST4 phosphorylation was selective for ATG4B, as related isoforms ATG4A, ATG4C, or ATG4D were not found to be phosphorylated in MST4-expressing GSCs (Figures S3D and S3E).
Figure 3.

MST4 Phosphorylates ATG4B through Direct Interactions
(A) Mass-spectrometric analysis of p-ATG4B in GSC 17 cells overexpressing MST4. The bottom panel depicts the phosphorylation site S383 in ATG4B. Asterisk at the top, tyrosine 383 residue that was found phosphorylated determined by mass spectrometric analysis.
(B) Amino acid sequences around serine 383 residue in ATG4B across different species. Asterisk at the top, serine residue that is conserved across species.
(C) Immunoprecipitation (IP)-IB analyses for FLAG-ATG4B, p-ATG4B, Myc-MST4, and ATG4B in HEK293T cells expressing Myc-MST4, a vector control (Vec), FLAG-ATG4B WT, or FLAG-S383A mutant.
(D) In vitro kinase assays of wild-type MST4 (WT) or MST4 without kinase activity (K53E), with ATG4B-WT or ATG4B-S383A mutant as a substrate. The reaction samples were assessed by IB analyses performed with anti-p-ATG4B, anti-ATG4B, or anti-MST4 antibodies.
(E) Immunofluorescent staining (IF) analyses of GSC 30 and M83 cells using anti-MST4 and anti-ATG4B antibodies. White arrows, double-stained MST4 and ATG4B. Scale bars, 100 μm.
(F) IP for Myc (left) or FLAG (right) followed by IB (upper panels) or IB of whole-cell lysate (lower panels) using anti-MST4, anti-ATG4B or anti-β-actin antibodies in HEK293T cells with indicated modifications.
(G) IP-IB analyses for MST4 and ATG4B (top) or ATG4B and MST4 (bottom) in GSC 1123 cells. Immunoglobulin G (IgG) was used as an isotype control.
Data are representative of two to three independent experiments with similar results. See also Figure S3.
Next, we examined whether MST4 directly phosphorylates ATG4B by co-expressing Myc-tagged MST4 with FLAG-tagged WT ATG4B or with a non-phosphorylatable S383A ATG4B mutant. We found that MST4 phosphorylated WT ATG4B but not the S383A mutant (Figure S3F). To confirm these findings, we generated an antibody that specifically detects p-S383 of endogenous ATG4B (p-ATG4B) in JK83 cells and in GSC 17 modified for overexpression of MST4, but not for GFP control (Figure S3G). Moreover, p-S383 of endogenous ATG4B was also detected in GBM tumor sections using the anti-p-ATG4B antibody. Binding of the anti-p-ATG4B antibody was blocked by treating specimens with phosphorylated ATG4B peptide RLERFFD(pS)EDEDFEI, but not with the non-phosphorylated peptide RLERFFDSEDEDFEI (Figure S3H). In HEK293T cells in which MST4 and ATG4B were co-expressed, this antibody detected phosphorylation of WT ATG4B but not the non-phosphorylatable S383A mutant (Figure 3C).
To further confirm ATG4B S383 phosphorylation by MST4, we carried out an in vitro kinase assay using purified recombinant proteins of MST4-WT, a KD MST4 mutant (K53E), ATG4B-WT, and the non-phosphorylatable ATG4B-S383A mutant. As shown in Figure 3D, WT but not KD MST4 phosphorylated ATG4B-WT. In contrast, the ATG4B-S383A mutant was not phosphorylated by either treatment, thereby supporting MST4 phosphorylation of ATG4B S383. Interestingly, the amounts of MST4 expression and ATG4B phosphorylation showed a positive correlation among a panel of GSCs (Figure S3I). Additionally, we found that MST4 and ATG4B were co-localized in GSC cytoplasm (Figure 3E), thus suggesting a potential association of MST4 with ATG4B in GSCs.
We additionally determined that exogenously expressed WT and KD MST4 associated with WT and S383A ATG4B (Figure 3F), suggesting that neither MST4 kinase activity nor S383 was required for MST4-ATG4B interaction. A physical association between endogenous MST4 and ATG4B proteins was further validated in GSC 1123 glioma spheres (Figure 3G). Mapping MST4-ATG4B interaction domains revealed that both N- and C-terminal sequences (amino acids 61–126 and 320–393) of ATG4B as well as the kinase domain of MST4 (amino acids 1–297) were required for MST4-ATG4B interaction (Figures S3J and S3K). Since irradiation (IR) induces autophagy in GBM (Kondo et al., 2005) and might affect MST4 association with ATG4B, we assessed the effects of IR on MST4 and ATG4B interactions in GSC 1123 cells. Although IR effectively induced DNA damage protein γH2AX, IR did not affect MST4-ATG4B association in GSCs (Figure S3L).
MST4-Induced p-S383 of ATG4B Enhances GSC Autophagic Activity and Tumorigenicity
Given the critical roles of ATG4B in autophagy (White, 2015), we examined whether MST4 phosphorylation of ATG4B at S383 modulates ATG4B processing of LC3B. Formation of the autophagosome membrane by conversion of LC3-I to lipidated LC3-II, and appearance of endogenous LC3 puncta are established indicators for autophagy (Klionsky et al., 2016). When endogenous MST4 or ATG4B were knocked down by specific shRNAs in GSC 1123 and JK83, the associated reductions in p-ATG4B resulted in a corresponding decrease in LC3-II conversion (LC3B-II/I ratio) and increased p62/SQSTM1, an established autophagy substrate (Figure 4A). By using an FRET-LC3B fusion protein that measures catalytic activity of ATG4B (Li et al., 2012), we found that YFP-CFP-LC3B fusion protein cleavage by ATG4B was inhibited by MST4 or ATG4B knockdown (Figure 4B). Depletion of either MST4 or ATG4B also reduced LC3B+ puncta in GSCs (Figure 4C). Transmission electron microscopy revealed that knockdown of MST4 or ATG4B significantly reduced autophagic vacuoles in GSCs (Figure 4D). For further investigation of the role for MST4 in autophagy induction, we overexpressed MST4 in GSC 528 and JK42 spheres, which have low levels of endogenous MST4 (Figure 1B). MST4 overexpression induced p-S383 of ATG4B, increased LC3-II conversion, LC3B puncta, autophagosome formation, and YFP-CFP-LC3B cleavage (Figures S4A–S4C).
Figure 4.

MST4-induced p-ATG4B Enhances Autophagic Activity and GBM Tumorigenicity
(A) IP-IB or IB analysis of MST4, ATG4B, p-ATG4B, LC3B, p62, and β-actin in GSC 1123 and JK83 expressing sh-control (C), sh-MST4 (M), and sh-ATG4B (A).
(B) Measurements of ATG4B activity in GSC 1123 or JK83 with or without knockdown of MST4 or ATB4B using an FRET-LC3B fusion protein as a substrate (left), and quantification of cleaved FRET-LC3B substrates (right). Red arrow, FRET-LC3B fusion protein; black arrows, cleaved CFP-LC3B and YFP.
(C) IF analyses (left) and quantification (right) for LC3B in GSC 1123 and JK83 without or with knockdown of MST4 or ATG4B. Arrows point to LC3B puncta.
(D) Transmission electron microscopy analyses for autophagic vacuoles in GSC 1123 with or without knockdown of MST4 or ATG4B (left), and quantification of autophagosomes in GSCs (right). Arrows point to autophagic vacuoles.
(E) IB of GSC 1123 transduced with sh-C or sh-MST4, reconstituted with vector (Vec), WT ATG4B, or the S383D ATG4B mutant.
(F) Limiting dilution neurosphere-forming assay in GSC 1123 with indicated modifications.
(G) In vivo BLI of GBM xenografts derived from luciferase-expressing GSC 1123 with indicated modifications. Colored scale bar represents photons/s/cm2/steradian.
(H) Bar graph for tumor volume formed by indicated GSC 1123 cells in mouse brains. n = 5.
(I) IB analysis of MST4, ATG4B, p-ATG4B, LC3B, p62, and β-actin in GSC JK16 with or without MST4 knockdown and transfected with a control vector, WT ATG4B, or the S383D ATG4B mutant.
(J) IF analyses (left) and quantification (right) for LC3B in GSC JK16 with indicated modification.
(K) Limiting dilution neurosphere-forming assay in GSC JK16 expressing indicated plasmid.
Data are representative of two to three independent experiments with similar results. All bar plot data are means ± SEM. ∗∗p < 0.01, ∗∗∗p < 0.001. Scale bars, 100 μm (C), 1.0 μm (D), and 1 mm (J). See also Figure S4.
To demonstrate whether MST4-induced p-S383 of ATG4B is critical in MST4-enhanced GSC tumorigenicity, we re-expressed exogenous WT or a phosphomimic S383D mutant ATG4B in GSC 1123 cells, in which endogenous MST4 was knocked down by shRNA (Figure 4E). Exogenous phosphomimic S383D ATG4B markedly rescued the MST4 knockdown-inhibited GSC cell growth and sphere-forming frequency in vitro (Figures 4F, S4D, and S4E) and tumorigenicity of orthotopic GBM xenografts (Figures 4G, 4H, and S4F). Next, we expressed exogenous WT or the S383D mutant ATG4B in GSC JK16 cells with low levels of endogenous ATG4B but with high levels of endogenous MST4 (Figure S3I). Expression of exogenous WT ATG4B but not a vector control in unmodified JK16 cells, or the S383D but not WT ATG4B in JK16 cells modified with knockdown of MST4, increased autophagic activity and sphere-forming frequency (Figures 4I–4K and S4G).
To further evaluate of the importance of ATG4B S383 phosphorylation in autophagic response, we overexpressed WT, S383A, or a non-catalytic mutant C74S (Li et al., 2012) ATG4B in JK16 cells. We found that WT, but not C74S or S383A mutant ATG4B, markedly increased LC3-II conversion and LC3B puncta (Figures S4H and S4I). WT, but not S383A or C74S mutant ATG4B, also increased the cleavage of FRET-LC3B (Figure S4J). Furthermore, ATG4B-WT but not its mutants significantly elevated GSC JK16 sphere formation, survival, and proliferation (Figures S4K and S4L). Consistent with these observations, in M83 cells with endogenous ATG4B depleted, expression of exogenous WT or S383D, but not C74S or S383A ATG4B, restored ATG4B S383 phosphorylation, LC3-I/II conversion, and LC3B puncta (Figures S4M and S4N).
Conversely, in GSC 528 cells having non-detectable MST4 (Figure 1B), expression of exogenous MST4 induced p-ATG4B, LC3-II conversion, autophagosome formation, and increased sphere-forming frequency while decreasing p62. Moreover, knockdown of endogenous ATG4B markedly reduced these effects in GSC 528 cells expressing exogenous MST4 but not control cells (Figures 5A–5D and S5A). In vivo, knockdown of endogenous ATG4B had minimal impact on parental GSC 528 tumorigenicity but significantly attenuated MST4-promoted GSC tumor growth in the brain (Figures 5E and 5F).
Figure 5.

ATG4B Mediates MST4-Enhanced Autophagic Activity and GBM Tumorigenicity
(A) IB for MST4, p-ATG4B, ATG4B, LC3B, p62, and β-actin in GSC 528 expressing exogenous MST4 (M4) or a vector control (Vec) with or without ATG4B (A4) knockdown.
(B–D) IF (left) and quantification (right) of LC3B puncta (B), electron microscopy (left) and quantification (right) of autophagosomes/autolysosomes (C), and sphere-forming frequency (D) for GSC 528 expressing a control vector or exogenous MST4, with or without ATG4B knockdown. White arrows in lower panels in (B), LC3 puncta. Red arrows in (C), autophagic vacuoles identified by EM.
(E and F) Representative images of BLI (E; colored scale bar represents photons/s/cm2/steradian) and H&E-stained (F) brains of mice that received indicated GSC 528 cells. Black arrows, tumor xenografts in the brain. Right: estimated volume of GSC brain xenografts.
Data are representative of two to three independent experiments with similar results. All bar plot data are means ± SEM. ∗∗p < 0.01. Scale bars, 100 μm (B), 1.0 μm (C), and 1 mm (F). See also Figure S5.
Lastly, we examined whether knockdown or overexpression of MST4, and knockdown of ATG4B affect the ERK- and AKT-signaling pathways, which regulate the onset of autophagy (Heras-Sandoval et al., 2014) and autophagic activity. AKT was strongly phosphorylated in fed cells compared with starved GSC cells. However, modulation of MST4 or ATG4B expression had minimal effect on the phosphorylation of AKT in both conditions. As expected, MST4 affected p-ERK activation but ATG4B did not (Figures S5B–S5D). Finally, PD98059, a MEK1 inhibitor, reduced p-ERK but had no effects on p-ATG4B and autophagic activity in GSCs (Figure S5E).
ATG4B Influences GSC Self-Renewal, Proliferation, and Tumorigenicity
Next, we knocked down endogenous ATG4B using three different shRNAs in GSC M83 and 1123 cells, with clones #4 and #5 showing higher efficiency (Figure 6A). ATG4B knockdown significantly decreased M83 and 1123 sphere-forming frequency and cell proliferation (Figures 6B–6D and S6A). When equal cell numbers of M83 and 1123 were injected into the brains of athymic nude mice, ATG4B knockdown cells but not cells modified with a scrambled shRNA markedly reduced GSC tumorigenicity and prolonged animal survival (Figures 6E, 6F, and S6B). We then re-expressed shRNA-resistant ATG4B-WT, -C74S, -S383A, or -S383D in M83 and 1123 cells in which endogenous ATG4B had been depleted. We found that ATG4B-WT or phosphomimic S383D, but not the non-catalytic C74S or non-phosphorylatable S383A mutant, rescued GSC cell proliferation and sphere formation in vitro as well as tumorigenicity in vivo (Figures 6G–6K and S6C–S6I).
Figure 6.

ATG4B Activity Is Required for Cell Growth, Survival, and Glioma Sphere Formation, and Tumorigenicity of GSCs
(A) IB for ATG4B and β-actin in GSC M83 and 1123 expressing a control shRNA (sh-C) or sh-ATG4B.
(B–D) The effect of knockdown of ATG4B (A4) on glioma sphere formation (B), sphere-forming frequency (C), and cell proliferation of GSC M83 and 1123 (D).
(E) In vivo BLI of GBM xenografts derived from luciferase-expressing GSC M83 with or without ATG4B knockdown. Colored scale bar represents photons/s/cm2/steradian.
(F) Survival analysis of mice intracranially implanted with GSC M83 with or without ATG4B knockdown.
(G) IB for ATG4B and β-actin in GSC M83 expressing sh-ATG4B (targeting 3′ UTR of ATG4B mRNA), ATG4B-WT, ATG4B-C74S, -S383A, and -S383D mutants, or a vector control.
(H and I) Cell proliferation (H) and sphere-forming frequency (I) in GSC M83 with indicated modifications.
(J) H&E staining of GSC M83 xenografts with indicated modifications. Black arrows, tumor xenografts in the brain.
(K) Tumor volumes and cell proliferation (Ki-67 staining) were quantified in GSC M83 xenografts (n = 5).
Data are representative of two to three independent experiments with similar results. All bar plot data are means ± SEM. ∗∗p < 0.01. Scale bars, 100 μm (B) and 1 mm (J). See also Figure S6.
To examine whether autophagic flux was involved in the reduction of cell growth in ATG4B-knockdown cells, we introduced the shRNA against ATG4B into autophagy-deficient M83 spheres stably expressing shRNA against ATG5 or ATG7 (Figure S6J). Cell proliferation was markedly decreased in the ATG5- or ATG7-deficient cells, which was consistent with the results from ATG4B-knockdown cells. However, inhibition of ATG5 or ATG7 had a minimal effect on inhibition of cell growth resulting from ATG4B knockdown (Figure S6K). Similar results were observed in the ATG4B-knockdown cells treated with chloroquine (CQ), which inhibited autophagy by blocking lysosomal acidification (Degtyarev et al., 2008) (Figures S6L and S6M).
Targeting ATG4B Attenuates the Tumor-Initiating Ability of GSCs and Sensitizes GBM to Radiation Therapy
Given our results above, we were motivated to investigate the effect of ATG4B pharmacologic inhibition. We tested ATG4B antagonist NSC185058 (NSC) that suppresses the activation and lipidation of LC3B (Akin et al., 2014). NSC decreased ATG4B-induced conversion of LC3-I to lipidated LC3-II, and the degradation of autophagy substrate p62/SQSTM1. Similar to NSC, CQ treatment resulted in the accumulation of p62 but, in contrast to NSC, CQ promoted LC3-I lipidation (Figures 7A and S7A). NSC and CQ treatments decreased GSC JK83 cell viability and sphere formation to similar extents (Figures 7B and S7B). In vivo, NSC and CQ significantly decreased M83 glioma xenograft growth in the flanks of mice (Figures S7C–S7E). NSC did not enhance the effects of STK26 knockout (KO) on M83 xenograft growth and autophagic activity in vivo (Figures S7F–S7I).
Figure 7.

Autophagy Inhibitors Attenuate GSC Growth and Self-Renewal, and Enhance the Therapeutic Effects of IR
(A) IB for LC3B, p62, and β-actin in GSC JK83 treated with NSC185058 (NSC) or CQ as indicated for 72 hr.
(B) Sphere-forming frequency of GSC JK83 treated with NSC or CQ as indicated for 72 hr.
(C) The effect of IR (2 Gy) on MST4 expression in PN GSC 19, 84, and 157 cells in vitro.
(D) IB analysis of MST4, p-ATG4B, ATG4B, γH2AX, and β-actin in indicated cells with or without IR treatment.
(E) CoBRA for STK26 methylation in indicated cells with or without IR treatment. Red asterisks, methylated; Green asterisks, partially methylated; U, uncut control; C, cut by methylation-specific enzymes.
(F) IB for LC3B, p62, and β-actin in GSC JK83 treated with DMSO, 100 μM NSC, IR (5 Gy), or NSC + IR in 6 days post IR.
(G and K) Cell viability for GSC JK83 (G) or 23 (K) treated with IR (0, 2, 4, 6, 8 Gy), with or without 100 μM NSC for 72 hr.
(H and L) Effects of NSC (150 mg/kg, Monday, Wednesday, and Friday) and IR (2 Gy/day for 5 consecutive days) on GSC JK83 (H) or 23 (L) brain tumor xenografts in mice. Treatments were started at 1 week post implantation. Mice were imaged after the last treatment, and representative BLI images are shown. Colored scale bars represent photons/s/cm2/steradian.
(I and M) Kaplan-Meier (left) and log-rank p value analyses (right) of mice bearing GSC JK83 (I) or 23 (M) orthotopic xenografts with indicated treatments.
(J) IB for MST4, p-ATG4B, ATG4B, LC3B, p62, γH2AX, and β-actin in GSC 23 treated with DMSO, 100 μM NSC, IR (2 Gy), or NSC + IR in indicated times post IR.
Data are representative of two to three independent experiments with similar results. All bar plot data are means ± SEM. ∗p < 0.05, ∗∗p < 0.01, ∗∗∗p < 0.001. See also Figure S7.
Radiation therapy (RT) is the first-line treatment for many types of cancers including GBM. Tumor cells use autophagy as a resistance mechanism in response to RT (Janku et al., 2011). For this reason, combination treatments of RT and autophagy inhibitors for solid tumors including GBM have been utilized in clinical trials to enhance the anti-tumor effect of RT (Amaravadi et al., 2016). To investigate potential synergistic effects of RT and NSC combinations, we first examined the effect of RT (i.e., IR) on MST4 expression and phosphorylation of ATG4B in GSCs. PN-like GSCs 19, 84, 157, 23, and unclassified JK42 cells expressed low endogenous MST4 and were relatively IR sensitive (Kim et al., 2016, Mao et al., 2013). We found that 2 Gy of IR increased MST4 expression and p-ATG4B (Figures 7C and 7D). In contrast, IR had no effect on MST4 expression and p-ATG4B in MES-like M83 with or without STK26 KO (Figure 7D). Moreover, the non-specific MST4 inhibitor hesperadin (Xiong et al., 2016) attenuated p-ERK, p-ATG4B, autophagic activity, and cell growth in M83 but not in M83/STK26 KO or PN GSCs with low levels of endogenous MST4 proteins (Figures S7J and S7K). In accordance with STK26 promoter methylation in PN but not MES GSCs (Figures S1I–S1K), we found that IR effectively reduced overall DNA methylation in the STK26 promoter in PN GSCs, contributing to induction of STK26 expression in IR-treated GSCs (Figures 7E and S7L).
On the other hand, IR on GSC JK83, JK42, and JK18 cells, which are not yet molecularly classified, increased endogenous MST4 and p-ATG4B, but only at a higher IR dose (5 Gy) and at later time points subsequent to IR (≥6 days, Figure S7M). Significantly, induction of MST4 expression at later time points corresponded with GSC cell recovery and regrowth from IR (Figure S7N). Additionally, at day 6 post treatment, IR induced autophagy in GSCs as indicated by increased LC3B lipidation and p62 breakdown (Figure 7F). Inhibition of ATG4B by NSC treatment sensitized GSC to IR by suppressing LC3B lipidation and increasing p62. These molecular responses were accompanied by decreased cell viability from combination treatment, relative to treatment with NSC or IR alone (Figures 7F and 7G). Combined IR and NSC treatments also resulted in a pronounced reduction in mitotic cells due to G2 arrest, and significant increases in apoptosis (i.e., annexin V staining), compared with single-agent treatments (Figures S7O and S7P).
For analysis of in vivo effects of NSC and IR, mice with intracranial GSC JK83 xenografts, established from cells modified for luciferase expression, received intraperitoneal injection of NSC at 150 mg/kg on Monday, Wednesday, and Friday, for 3 weeks, with IR administered at 2 Gy/day, Monday through Friday for one cycle (10 Gy total), either before initiating, at outset of, or following NSC administration (Figure 7H). Both NSC and IR monotherapy showed a growth-suppressive effect on intracranial tumors, as indicated by bioluminescence monitoring of tumor response to treatment as well as by survival analysis. Importantly, all combination treatments showed significantly increased anti-tumor activity, relative to monotherapy, with co-administration and IR followed by NSC regimens performing the best (Figures 7D and 7J). Similar effects of separate or combined treatments of NSC and IR on p-ATG4B, autophagic activity, cellular behaviors, and growth of intracranial tumors were also found in GSC 23 models in vitro and in vivo in which IR also induced MST4 expression (Figures 7D, 7J–7M, S7Q, and S7R). Intracranial tumors were examined for treatment effect on proliferation, autophagy, and apoptosis. We found that JK83 and 23 GBM treated with combined NSC + IR had significantly lower proliferation indices (by Ki-67 staining) when compared with NSC or IR alone (p < 0.01). Combination treatment of simultaneous IR plus NSC, IR followed by NSC, but not NSC first then IR, also markedly decreased LC3B levels when compared with control (p < 0.001) and IR alone (p < 0.001, Figures S7S–S7V). Apoptosis indicators γH2AX and cleaved caspase-3 were also markedly increased 6 hr following completion of IR when compared with control (p < 0.001, Figures S7S–S7V).
Correlative Expressions of MST4, p-ATG4B, and LC3B Are Prognostic for Clinical GBM
As an additional approach to addressing the importance of MST4 and p-ATG4B to GBM biological behavior, we analyzed their expression in 101 de-identified patient GBM samples by immunohistochemical (IHC) staining (Figure 8A). A positive correlation between tumor MST4 and p-ATG4B staining was evident (Figure 8B). Moreover, LC3B staining showed correspondence with the MST4 and p-ATG4B results, supporting the pro-autophagic activity of ATG4B in these tumors. The clinical implications of these findings are highlighted by the determination of patient survival being inversely correlated with MST4, p-ATG4B, and LC3B staining (Figure 8C).
Figure 8.

Correlative Expressions of MST4, p-ATG4B, and LC3B Are Prognostic for Clinical GBM
(A) Representative images of IHC staining of MST4, p-ATG4B, and LC3B in clinical GBM samples. Scale bars, 50 μm.
(B) Correlations of IHC data for high or low MST4 expression relative to level of p-ATG4B or LC3B, and high or low p-ATG4B expression relative to level of LC3B.
(C) Kaplan-Meier analyses for GBM patients with tumors expression high or low level of MST4, p-ATG4B, or LC3B.
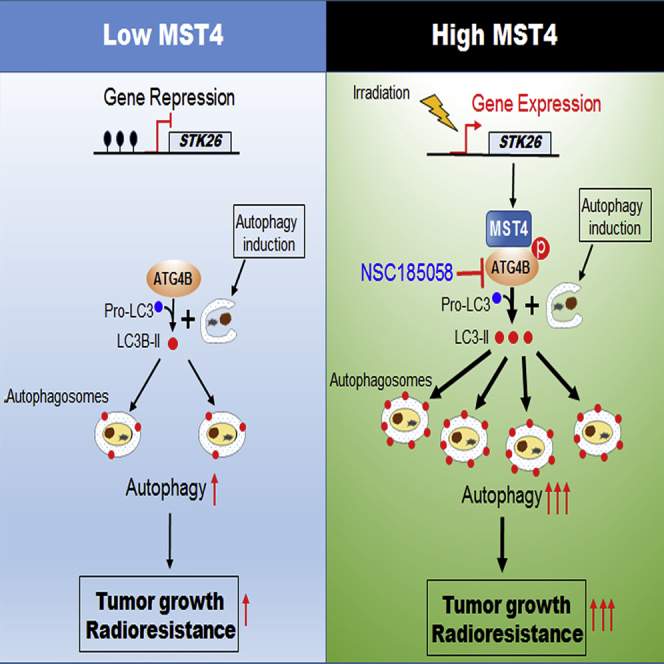
(D) In GSCs in which STK26 is silenced (hypermethylated, left), ATG4B is not phosphorylated, resulting in low levels of ATG4B activity, autophagic flux, and low brain tumorigenicity of GBM. In GSCs in which STK26 is expressed (unmethylated, right), MST4 phosphorylates ATG4B at S383, thereby activating ATG4B, leading to enhanced autophagic flux, brain tumorigenicity, and RT resistance of GBM. Irradiation induces MST4 expression through reducing methylation of STK26 promoter, increasing ATG4B activity and autophagy, and leading to RT resistance. Inclusion of the ATG4B inhibitor NSC185058 enhances the anti-tumor activity of RT.
Discussion
Our data together describe a MST4-ATG4B signaling axis that regulates autophagic activity, tumorigenicity, and responses to RT in GBM. The expression of MST4 (STK26) in GSCs is negatively regulated by DNA methylation at its promoter, which can be relieved after RT. Constitutively expressed or induced MST4 phosphorylates ATG4B at S383, activating ATG4B-mediated autophagy, enhancing GBM cell tumorigenicity, and increasing GBM resistance to RT (Figure 8D). Pharmacologic inhibition of ATG4B using NSC185058 markedly attenuates autophagic activity, decreases GBM cell tumorigenicity, and enhances the anti-tumor activity of RT when applied to orthotopic GBM xenograft models.
MST4 is a member of the STK STE family, whose activities have been implicated in normal development as well as disease states, including cancer (Thompson and Sahai, 2015). MST4 promotes cancer cell growth, survival, migration, and metastasis through p-ERK pathway activation or interaction with STRIPAK components (Thompson and Sahai, 2015). Increased levels of MST4 were found to correlate with basal breast cancer aggressiveness and metastasis (Madsen et al., 2015). Inhibition of MST4 activity by using a broad-spectrum kinase inhibitor attenuated MST4 promotion of mouse pituitary tumor cell growth in vitro (Xiong et al., 2016). Thus far, however, only a few proteins including Ezrin, PPP1CB, and TRAF6 have been identified as MST4 phosphorylation substrates (Jiao et al., 2015, Madsen et al., 2015, ten Klooster et al., 2009). This study advanced our knowledge of the association of MST4 with GBM and autophagy. Our data not only reveal roles for MST4 in promoting GBM malignancy as well as therapy resistance, but also suggest MST4 as a potential target for treating GBM through pharmacologic inhibition.
This study identified and validated ATG4B as a MST4 substrate. ATG4B is a key cysteine protease that cleaves, lapidates, and delipidates ATG8 and its mammalian homologs, which include LC3 and GABARAP subfamilies, and ATG4B is necessary for autophagosome biogenesis (Mizushima et al., 2011). Among ATG4 isoforms, ATG4B possesses the broadest activities against ATG8 homologs (Li et al., 2011). Due to its unique position in a branch of autophagic process, ATG4B activity is regulated distinctively from multifaceted modulation of ULK and VSP34 complexes. For example, nutrients (glucose and amino acids) or inhibitors of phosphatidylinositol 3-kinase, AKT or mammalian target of rapamycin (mTOR) directly regulates AMP kinase or mTOR complex activities to ULK1 phosphorylation while not affecting ATG4 activity (Zhang et al., 2016). Although phosphorylation of serine 383 (p-S383) and p-S392 on ATG4B is important for ATG4B in controlling the autophagic process (Yang et al., 2015), this study describes MST4 as the authentic kinase for S383 phosphorylation that is critical in stimulating autophagy and tumorigenicity in GBM. In addition, ATG4B was implicated in tumorigenesis and as a potential therapeutic target in cancers (Akin et al., 2014, Bortnik et al., 2016, Rothe et al., 2014). The present study not only corroborates these studies but also presents additional findings on the role of ATG4B in autophagy and cancer. First, we identify ATG4B, but not other ATG4 isoforms, as a substrate for MST4. Second, MST4 activates ATG4B by directly phosphorylating ATG4B only at S383, but not the other phosphorylation site previously described (Yang et al., 2015). Third, MST4-induced p-ATG4B is critical for autophagic activity, tumorigenicity, and responses to RT in GBM. RT-induced MST4 activities could partially contribute to GBM RT resistance that is often observed in the clinical setting. The combination of ATG4B inhibition, using the inhibitor NSC, with RT was determined to prolong animal survival in our orthotopic xenograft models relative to RT or NSC185058 treatment alone. Interestingly, we found that the sequences for therapy administration influence the extent of anti-tumor activity from combined treatments. Lastly, p-ATG4B has a prognostic value alone or in combination with the expression of MST4 or LC3B in predicting poorer clinical outcomes of GBM.
In the treatment of human cancers including GBM, RT, cytotoxic chemotherapeutics such as TMZ, and targeted inhibitor therapies are known to induce autophagy that sustains the survival of tumor cells, thereby contributing to treatment resistance and recurrence (Amaravadi et al., 2016). Blocking autophagic response using autophagy inhibitors CQ or hydroxychloroquine (HCQ) has been shown to sensitize tumor cells to the effects of cytotoxic therapy (Amaravadi et al., 2016, Gewirtz, 2016). Preclinical studies involving autophagy inhibition (Egan et al., 2015, Fan et al., 2010, Hu et al., 2012) have motivated a large number of clinical trials targeting autophagy as part of combination therapy treatment of various cancers. Recent phase I/II clinical trials, including those for GBM, using CQ or HCQ in combination with other drugs or therapeutic modalities, have shown some encouraging results. However, clinical data have also revealed associated treatment toxicities in these trials that are at least partly attributable to the non-specific nature of these lysosome inhibitors, and that have limited their utility in treating cancer patients (Amaravadi et al., 2016, Levy et al., 2014, Rosenfeld et al., 2014). We note that NSC administrations in our preclinical in vivo experiments, in amounts and at frequencies showing substantial anti-tumor activity, both as a single agent and especially in combination with RT, were well tolerated by animal subjects. Importantly, our data not only suggest ATG4B as a feasible therapeutic target for combination therapy of malignant human cancers such as GBM but also provide strong evidence for development of small molecules targeting ATG4B into clinical agents. Such compounds will be highly useful for combined inhibition of active ATG4B and currently used modalities including RT, TMZ, and other drugs that are known to induce autophagy in cancers.
In conclusion, this study not only describes a signaling relationship by which MST4 phosphorylation of ATG4B promotes autophagy, contributes to GBM malignancy, and lessens tumor response to RT, but also reveals a clinical opportunity involving combined ATG4B inhibitor and RT for treating patients with GBM. It will be of interest to discover whether these results are generalizable to the treatment of other cancers.
STAR★Methods
Key Resources Table
| REAGENT or RESOURCE | SOURCE | IDENTIFIER |
|---|---|---|
| Antibodies | ||
| anti-β-actin | Santa Cruz Biotechnology | Cat#SC-47778; RRID: AB_626632 |
| anti-Myc-tag | Santa Cruz Biotechnology | Cat#SC-40; RRID:AB_627268 |
| anti-SQSTM1/p62 | Santa Cruz Biotechnology | Cat#SC-28359 ; RRID: AB_628279 |
| anti-LC3B | Cell Signaling Technology | Cat#3868S; RRID: AB_2137707 |
| anti-ATG4B | Cell Signaling Technology | Cat#5299S; RRID: AB_10622184 |
| anti-phosphor-Histone H2A.X (Ser139) | Cell Signaling Technology | Cat#9718S; RRID:AB_2118009 |
| anti-Myc-Tag (Sepharose bead conjugate) | Cell Signaling Technology | Cat#3400S; RRID: AB_10692357 |
| anti-ATG4A | Cell Signaling Technology | Cat#7613S; RRID: AB_10827645 |
| anti-CD44 | Cell Signaling Technology | Cat#3570S; RRID: AB_10693293 |
| anti-SOX2 | Cell Signaling Technology | Cat#3579S; RRID:AB_2195767 |
| anti-MST1 | Cell Signaling Technology | Cat#14946 |
| anti-MST2 | Cell Signaling Technology | Cat#3952; RRID: AB_10694853 |
| anti-ATG4C | Cell Signaling Technology | Cat#5262S; AB_10626627 |
| anti-phosphor-AKT (Ser473) | Cell Signaling Technology | Cat#4060S; RRID: AB_2315049 |
| anti-AKT | Cell Signaling Technology | Cat#9272S; RRID: AB_329827 |
| anti-phospho-p44/42 MAP kinase Thr202/Tyr204 | Cell Signaling Technology | Cat#9101S; RRID:AB_331646 |
| anti-p44/42 MAP kinase | Cell Signaling Technology | Cat#9102S; RRID:AB_330744 |
| anti-cleaved Caspase-3 (Asp175) | Cell Signaling Technology | Cat#9661S; RRID:AB_2341188 |
| anti-ATG7 | Cell Signaling Technology | Cat# 8558, RRID:AB_10831194 |
| anti-ATG5 | Cell Signaling Technology | Cat# 12994, RRID:AB_2630393 |
| anti-ATG4D | Proteintech Group | Cat#16924-1-AP;RRID:AB_2062024 |
| anti-MST4 (for IB, IHC and IF) | Abcam | Cat#ab52491; RRID:AB_881249 |
| anti-p-S383-ATG4B | Abmart | NA |
| anti-ATG4B | Abmart | NA |
| anti-Flag | Sigma-Aldrich | Cat#F3165;RRID:AB_259529 Cat#F7425; RRID:AB_439687 |
| anti-p-Ser | Thermo Fisher Scientific | Cat# 61-8100, RRID:AB_2533940 |
| Peroxidase-IgG Fraction Monoclonal Mouse Anti-Rabbit IgG, Light Chain Specific | Jackson ImmunoResearch Laboratories | Cat# 211-032-171; RRID:AB_2339149 |
| anti-Ki-67 | EMD Millipore | Cat#AB9260, RRID:AB_2142366 |
| Alexa Fluor 488 | Thermo Fisher Scientific | Cat# A-11008, RRID:AB_143165 |
| Alexa Fluor 594 | Thermo Fisher Scientific | Cat# R37117, RRID:AB_2556545 |
| Horseradish Peroxidase Streptavidin antibody | Vector Laboratories | Cat# SA-5004, RRID:AB_2336509 |
| Anti-Mouse IgG (H+L), rat adsorbed, made in horse antibody | Vector Laboratories | Cat# BA-2001, RRID:AB_2336180 |
| Biotinylated Goat Anti-Rabbit IgG antibody | Vector Laboratories | Cat# BA-1000, RRID:AB_2313606 |
| anti-Rabbit Immunoglobulins | DAKO | Cat# P0217 |
| anti-Mouse Immunoglobulins | DAKO | Cat# P0260 |
| anti-Goat Immunoglobulins | DAKO | Cat# P0449 |
| Biological Samples | ||
| Paraffin-emended GBM tissue | Saitama Medical University | Saitama, Japan |
| Chemicals, Peptides, and Recombinant Proteins | ||
| Chloroquine (CQ) | Sigma | Cat#C6628 |
| NSC185058 | NCI Developmental Therapeutics Program | NIH, NCI, USA |
| AquaBlock | East Coast Bio | Cat#PP82 |
| Propidium Iodide | BD Biosciences | Cat#556463 |
| Annexin V-APC | BD Biosciences | Cat#550475 |
| Vybrant™ DyeCycle™ Violet Stain | Thermo Fisher Scientific | Cat#V35003 |
| S-Adenosyl Methione | New England Biolabs | Cat#B9003S |
| DNA methyltransferase | New England Biolabs | Cat#M0230S |
| BsmBI | New England Biolabs | Cat#R0580S |
| Vectashield mounting medium with DAPI | Vector Laboratories | Cat#H-1200 |
| Bsh1236I (BstUI) | Thermo Fisher Scientific | Cat#ER0921 |
| Hesperadin | Selleckchem | Cat#S1529 |
| PD98059 | Selleckchem | Cat#S1177 |
| Lipofectamine 2000 | Thermo Fisher Scientific | Cat#11668019 |
| Kinase buffer | Cell Signaling Technology | Cat#9802 |
| ATP | Cell Signaling Technology | Cat#9804 |
| D-Luciferin | Gold Bio | Cat#LUCK |
| Peanut oil | Sigma-Aldrich | Cat#2144 |
| Protease Inhibitor Cocktail | Sigma-Aldrich | Cat# 11836153001 |
| Phosphatase inhibitor | Sigma-Aldrich | Cat# 4906837001 |
| Protein G Agarose | Sigma-Aldrich | Cat# 16-266 |
| 2% paraformaldehyde/2.5% glutaraldehyde | Polysciences | Cat#22872 |
| IP Lysis Buffer | Thermo Fisher Scientific | Cat#87788 |
| O.C.T Compound | Thermo Fisher Scientific | Cat#23-730-571 |
| Critical Commercial Assays | ||
| QuikChange mutagenesis kit | Agilent Technologies | Cat#200515-5 |
| CellTiter Glo 2.0 | Promega | Cat#G9241 |
| Epitech bisulphite conversion kit | Qiagen | Cat#59104 |
| QIAquick Gel Extraction kit | Qiagen | Cat#28704 |
| Deposited Data | ||
| GSC microarray | Mao et al., 2013 | GSE67089; (Mao et al., 2013) |
| GSC 450K DNA methylation array | This and another studies | Deposited to GEO as GSE90948. |
| Experimental Models: Cell Lines | ||
| M83 | Mao et al., 2013 | N/A |
| 1123 | Mao et al., 2013 | N/A |
| 30 | Mao et al., 2013 | N/A |
| 528 | Mao et al., 2013 | N/A |
| 17 | Mao et al., 2013 | N/A |
| 19 | Mao et al., 2013 | N/A |
| 84 | Mao et al., 2013 | N/A |
| 157 | Mao et al., 2013 | N/A |
| HEK293T | ATCC | ATCC CRL-3216 |
| JK42 | Srikanth et al., 2013 | N/A |
| JK83 | Srikanth et al., 2013 | N/A |
| JK44 | Srikanth et al., 2013 | N/A |
| JK46 | Srikanth et al., 2013 | N/A |
| JK18 | Srikanth et al., 2013 | N/A |
| JK34 | Srikanth et al., 2013 | N/A |
| JK92 | Srikanth et al., 2013 | N/A |
| JK16 | Srikanth et al., 2013 | NA |
| 23 | Bhat et al., 2013 | NA |
| 543 | Rohle et al., 2013 | N/A |
| 600 | Rohle et al., 2013 | N/A |
| Experimental Models: Organisms/Strains | ||
| Athymic (Ncr nu/nu) mice | Taconic Farms | N/A |
| Oligonucleotides | ||
| lentiCRIPSRv2GFP-STK26-KO-1 construction primers: F: CACCGTTGGACAGCCACCGGCGAGT R: AAACACTCGCCGGTGGCTGTCCAAC |
IDT | N/A |
| lentiCRIPSRv2GFP-STK26-KO-2 construction primers: F: CACCGCCGGTGGCTGTCCAAGTGCC R: AAACGGCACTTGGACAGCCACCGGC |
IDT | N/A |
|
STK26 genomic DNA sequencing primer: F: CTCTTCCTAAAGCGGCGAGG R: CAGCATTTCTCACGCCACAC |
IDT | N/A |
| Recombinant DNA | ||
| TRC shRNA Control | Dharmacon | Cat#RHS6848 |
| GIPZ shRNA Control | Dharmacon | Cat#RHS4346 |
| ATG4B shRNA #1 | Dharmacon | TRCN0000073798 |
| ATG4B shRNA #4 | Dharmacon | TRCN0000073801 |
| ATG4B shRNA #5 | Dharmacon | TRCN0000073802 |
| ATG4B shRNA (Target 3’UTR) | Dharmacon | V3SH7591-225104933 |
| MST4 shRNA #1 | Dharmacon | TRCN0000003192 |
| MST4 shRNA #2 | Dharmacon | TRCN0000003193 |
| MST4 shRNA (Target 3’UTR) | Dharmacon | V3SH7590-225006062 |
| ATG5 shRNA | Dharmacon | V2LHS_248503 |
| ATG7 shRNA | Dharmacon | V2LHS_13452 |
| pCDH-MST4 WT and mutants | This study | N/A |
| pCDH-MST4 K53E | This study | N/A |
| pCDH-MST4 T178A | This study | N/A |
| pCDH-ATG4B WT | This study | N/A |
| pCDH-ATG4B C74S | This study | N/A |
| pCDH-ATG4B S383A | This study | N/A |
| pCDH-ATG4B S383D | This study | N/A |
| pcDNA-myc-MST4 WT | This study | N/A |
| pcDNA-myc-MST4 K53E | This study | N/A |
| pcDNA-Flag-ATG4B WT and domain deleted mutants | (Kuang et al., 2012) | N/A |
| pcDNA-Flag-ATG4B S383A | This study | N/A |
| pcDNA-mycMST4 1-279/280-416 | This study | N/A |
| lentiCRISPRv2GFP | (Walter et al., 2017) | Addgene #82416 |
| psPAX2 | Didier Trono | Addgene #12260 |
| pCMV-VSV-G | (Stewart et al., 2003) | Addgene #8454 |
| pET28a -ATG4B WT and C74S | (Li et al., 2011) | (Li et al., 2011) |
| pET28a -FRET-LC3B | (Li et al., 2012) | (Li et al., 2012) |
| Software and Algorithms | ||
| Firebrowse | http://firebrowse.org/ | |
| Betastasis | www.betastasis.com/glioma/tcga_gbm/ | |
| gRNA design MIT on line tool | http://crispr.mit.edu | |
| Other | ||
| PrepEase | USB | Cat# P-78796B |
| Superdex 75 column | GE Health | Cat# 1068-01 |
| pGEM-T | Promega | Cat#: A3600 |
Contact for Reagent and Resource Sharing
Further information and requests for resources and reagents should be directed to and will be fulfilled by the Lead Contact, Shi-Yuan Cheng (shiyuan.cheng@northwestern.edu).
Experimental Model and Subject Details
Animals
Mice and Animal Housing
Athymic (Ncr nu/nu) mice at 6-8 weeks of age were purchased from Taconic Farms. Five mice were grouped in each cage. All experiments using animals were conducted under the Institutional Animal Care and Use Committee (IACUC)-approved protocols at Northwestern University in accordance with NIH and institutional guidelines.
Xenograft Studies
For the tumorigenicity studies, GSCs with indicated expression constructs were intracranially injected into the brains of individual mice. All mice were monitored every day for the development of neurological symptoms indicative of substantial tumor growth. The mice were humanely euthanized 2 to 10 weeks after implantation, and their brains were harvested. Each mouse brain was removed and embedded in an optimum cutting temperature (OCT) formulation (ThermoFisher), and stored at -80°C. Brains bearing GSC xenografted tumors were sectioned into 10-μm thick section using a cryostat (Leica). The whole brain was sectioned coronally from most anterior to posterior. Every fifth tumor-bearing brain section of each brain was subjected to hematoxylin and eosin staining to determine the locations from beginning to the end of each tumor. After careful comparisons, the section with the largest tumor cross-sectional area for each xenograft was used for the measurement. Tumor volume was estimated by using the formula V = ab2/2, where a and b (a > b) are the tumor’s length and width.
For the animal survival analysis, mice were intracranially injected with patient-derived GSC spheres (5 x 10⁴ or 5 x 10⁵ cells in 2 or 5 μl PBS) and maintained until pathological symptoms from tumor burden developed or 70 days after injection.
For intracranial tumor xenograft model treated with radiation and ATG4B inhibitor NSC185058, the mice stereotactically transplanted with GSC JK83 or 23 cells were randomized into six treatment groups: 1) control (peanut oil vehicle), single-treatment groups, 2) NSC185058, 3) radiation, or combined treatment groups, 4) concurrent NSC185058 and radiation, or 5) sequential radiation, followed by NSC185058, and 6) sequential NSC185058, followed by radiation. The NSC185058 treatment groups received NSC185058 at a dose of 150 mg/kg by IP injection on Monday, Wednesday, and Friday for three weeks. The radiation groups received radiation at 2 Gy for five consecutive days. The drug or radiation treatment was started one week after transplantation. All mice were monitored every day for the development of neurological symptoms due to tumor burden. The tumor growth was monitored using the IVIS Lumina imaging station (Caliper Life Sciences). Mice were maintained until the development of neurological symptoms, including hunched back, loss of body weight, reduced food consumption, and inactivity.
For subcutaneous tumor xenograft model, 1 x 10⁶ cells of GSC M83 in 100 μl PBS were subcutaneously injected into athymic nude mice. When palpable subcutaneous tumor xenograft formed, the tumor-bearing mice on alternating days were treated by i.p. with NSC185058 (150 mg/kg) or vehicle control (peanut oil). Mice were euthanized when tumor size reached ∼ 1500 mm3 or when pathological symptoms developed. The subcutaneous tumor xenografts were then removed. Tumor volume was estimated by the formula V = ab2/2, where a and b (a > b) are the tumor’s length and width.
Bioluminescence Imaging of Tumor Xenograft Growth
Bioluminescence imaging was conducted to monitor in vivo tumor growth using the IVIS Lumina imaging station (Caliper Life Sciences). Tumor-bearing mice were injected 300 mg/kg of D-luciferin (potassium salt, Gold Biotechnology) before isoflurane anesthesia. Radiance (photons per second per square centimeter per steradian) was measured 15 minutes after substrate injection using Living Image 4.3.1 software (Caliper Life Sciences).
GBM Specimens
De-identified and paraffin-embedded human GBM (WHO grade III and IV) specimens were collected from 2001 to 2013 at Saitama Medical University, Saitama, Japan. These clinical GBM specimens were examined and diagnosed by pathologists at Saitama Medical University. Tumor collections with informed consents and analyses were approved by the Institutional Review Board (IRB) at Saitama Medical University, Saitama, Japan. The receipt and analyses of these GBM specimens were under a current IRB protocol approved by the IRB at Northwestern University.
Cell Lines and Cell Culture
Human HEK293T cells (ATCC) were cultured in DMEM (Invitrogen) supplemented with 10% FBS and 1% penicillin and streptomycin. Patient-derived glioma stem-like cells (GSCs) that were derived from de-identified clinical glioma tumor samples and were previously characterized (Bhat et al., 2013, Mao et al., 2013, Rohle et al., 2013, Srikanth et al., 2013) were cultured as non-adherent spheroids in serum-free defined medium containing DMEM/F12 (Thermo Fisher Scientific), supplemented with B27 (2%, Thermo Fisher Scientific), penicillin and streptomycin (1%, Thermo Fisher Scientific), Heparin (5 μg/ml, Sigma-Aldrich), EGF (20 ng/ml, Peprotech), and bFGF (20 ng/ml, Peprotech). For starvation assays, cells were washed three times with phosphate-buffered saline (Thermo Fisher Scientific) followed by HBSS (Thermo Fisher Scientific) treatment for 6 hr. All the GSC cell lines were authenticated by commercial services at Northwestern University and corresponding institutions described in the references cited above.
Method Details
Bioinformatics Analyses of STK26 Expression
TCGA RNA-seq data of gliomas in current version were downloaded from Firebrowse (http://firebrowse.org/), including 5 normal brain samples, 530 low-grade gliomas (LGG) and 166 glioblastoma (GBM) samples (Table S2). Among these 166 GBM samples, 47 classical, 63 mesenchymal (MES), and 39 proneural (PN) subtype tumors were classified based on the barcode information of GBM molecular subtypes (Tables S2–S6).
TCGA microarray data of GBM (the Affymetrix Human Exon 1.0 ST platform) were downloaded from Betastasis website (www.betastasis.com/glioma/tcga_gbm/). These tumors include 96 classical, 112 MES, and 92 PN subtype GBM tumors (Tables S5 and S6).
The Mann-Whitney U-test was performed to determine whether STK26 was differentially expressed between LGG and GBM, or different GBM molecular subtypes.
Kaplan-Meier survival analyses were used to assess the relevance and importance of STK26 in human GBM tumors.
In the analyses of two datasets, the upper quartile or upper third samples were defined as STK26-high, and the rest of glioma samples were considered as STK26-low. The numerical data were presented as mean ± standard deviation (SD) of at least three determinations.
Plasmid Construction and Transfection
GIPZ lentiviral shRNAs for MST4 and ATG4B were purchased from Dharmacon. Open reading frames (ORFs) of MST4 and ATG4B cNDAs were inserted into the pCDH-CMV-MCS-EF1-Puro vector to generate pCDH -MST4 or -ATG4B. MST4 and its variants were sub-cloned into pcDNA-3.1 with sequence encoding a c-Myc epitope. Human cDNAs for ATG4B and its variants were cloned by PCR and then sub-cloned into pET-28a for expression in E. coli. FRET-LC3B fusion construct was constructed as previously described (Li et al., 2012). Site-directed mutagenesis was performed with a QuikChange mutagenesis kit, according to the manufacturer's instructions.
Lentiviral Production and Infection
Lentiviral vectors expressing non-target control shRNA, specific shRNA constructs (MST4, ATG4B, ATG5 or ATG7), or full-length MST4, ATG4B or their mutant cDNAs were transfected into 293T using Lipofectamine 2000 in accordance to the manufacturer’s instructions. For the MST4 or ATG4B rescue experiments, shRNA targeting 3’UTR of MST4 or ATG4B was used for knockdown. To establish stable cell lines, the supernatants containing lentivirus were harvested 48-72 hr after transfection and used to infect target cells with polybrene (6.0 μg/ml, Sigma). After 72 hr of transduction, cells were selected with 2.0 μg/ml puromycin for 4 days. Afterwards, cells were harvested to determine the knockdown efficiency by using immunoblot analyses (IB).
CRISPR-mediated STK26 Knockout
The target sequences of gRNA were designed using the MIT online tool. The synthesized forward and reverse primers including 20 bp target sequence and BsmBI sticky end were annealed and inserted into the lentiCRISPRv2GFP digested with BsmBI. To produce CRISPR-lentivirus, HEK 293T cells seeded in 100 mm plate were transfected with 10 μg lentiCRISPRv2GFP-STK26-KO or lentiCRISPRv2 control plasmids, 5 μg psPAX2 and 2.5 μg pVSV-G plasmids using Lipofectamine 2000 according to the manufacturer’s instructions. After incubation for 48-72 hr, the supernatants containing lentivirus were harvested and used to infect GSC cells for 4-6 hr in the incubator. After subsequent 4-5 days, GSC cells were harvested to determine the knockout efficiency by using genomic DNA sequencing and IB.
Cell Viability, Apoptosis and Cell Cycle Assays
GSCs with indicated treatments were plated in 96-well plates at 2000 cells per well. Cell viabilities were evaluated at the indicated time points by using CellTiter-Glow 2.0 Assay (Promega). For apoptosis assay, cells were incubated with an anti-Annexin V antibody (AV) and Propidium Iodide (PI) in accordance to the protocol provided by the manufacturer (BD Biosciences). Cells without AV or PI were used as negative controls. For cell cycle analyses, cultured cells were pulsed with Vybrant™ DyeCycle™ Violet Stain for 30 minutes following by processing for FACS.
In Vitro Cell Proliferation Assays
In vitro cell proliferation assays were performed as previously described (Huang et al., 2016). Briefly, GSC spheres were dissociated with StemPro Accutase into single cells, and cell density was quantified by counting viable (Trypan Blue negative) cells using a hemotocytometer. Cells were seed into a 24-well plate containing 1 ml culture medium at a density of 5000 cells per well. The number of living cells was determined at different time points using a hemotocytometer.
GSC Sphere Size
As previously described (Mao et al., 2013), 1000 cells with indicated modifications or treatments were plated in 96-well plates in at least eight replicates by a BD FACSAria™ III flow cytometer. Sphere size was observed at day 5 for GSC M83 and 1123, and 10 days for GSC JK16 using a Nikon inverted microscope Eclipse Ti-U equipped with a digital camera.
Limited Dilution Assays for GSC
Limiting dilution assay was conducted as described previously (Kim et al., 2016). In brief, dissociated cells from glioma spheres seeded in 96-well plates at density of 1, 5, 10, 20 or 50 for GSC M83, 1123, JK83, 528 and 23 cells, and 5, 10, 20, 50 or 100 for JK16 and JK42 cells per well. After 7 days for GSC M83 and 1123, and 14 days for GSC JK16, JK42, JK83, 528 and 23, each well was examined for formation of tumor spheres. Stem cell frequency was calculated using extreme limiting dilution analysis (http://bioinf.wehi.edu.au/software/elda/).
Immunoprecipitation (IP)
Cells were lysed in IP lysis buffer (ThermoFisher Scientific) supplemented with protease inhibitors with proteinase inhibitor and phosphatase inhibitor cocktail (Sigma-Aldrich), incubated on ice for 15 min, and cleared by centrifugation at 16,000 x g at 4°C for 15 min. After pre-clearing step with protein G- agarose beads (Sigma-Aldrich), cell lysate (5 mg) was subjected to immunoprecipitation with the anti-Myc-Tag (Sepharose bead conjugate) or agarose-immobilized antibody (10 μg of anti-Flag, anti-MST4, anti-ATG4B, or control antibodies) for overnight at 4°C.
Immunoblot Analysis (IB)
Cells were lysed in a RIPA buffer (50 mM Tris-HCl, pH 8.0/150 mM Sodium chloride/1% NP-40/0.5% sodium deoxycholate/0.1% sodium dodecyl sulfate/2mM EDTA) containing 1x protease and 1x phosphotase inhibitor cocktails (Sigma-Aldrich). Protein samples were quantified using the Bradford assay reagent (Bio-Rad) in accordance to the manufacturer instructions. Protein samples were subjected to SDS-PAGE and transferred to polyvinylidene fluoride (PVDF) membranes in 25 mM Tris, 192 mM glycine. Membranes were incubated with indicated antibodies for overnight at 4°C. Following wash with TBS-T (TBS containing 0.1% Tween-20), the blot was incubated with corresponding peroxidase-labeled secondary antibodies (1:200). Blots were developed with enhanced chemiluminescence (ECL, Amersham Bioscience) reaction according to manufacturer instructions.
Immunofluorescent Staining
For immunofluorescent staining (IF) analysis of cultured cells, GSCs were fixed with 4% formaldehyde (Fisher) for 15 min and then blocked with AquaBlock (East Coast Bio, North Berwick, ME) for 60 minutes and permeabilization with 0.3% Triton X-100. Cells were probed with following primary antibodies: MST4 (1:1000), ATG4B (1:200), and LC3B (1:200). After being washed three times with PBS-T, cells were incubated with Alexa 488 and 594 labeled secondary antibodies (1:200) and DAPI-containing mounting solution Vectashield (Vector Laboratories), and then visualized by using a Nikon inverted microscope Eclipse Ti-U equipped with a digital camera.
Frozen brain tissue sections with GBM xenografts were dried at room temperature for 30 min, and then fixed in PBS with 2% paraformaldehyde for 5 minutes. Tissue sections were blocked with AquaBlock (East Coast Bio, North Berwick, ME) for 60 minutes and then incubated with appropriate primary antibodies 4°C overnight. Tissue sections were incubated with Alexa 488 or 594 labeled secondary antibodies (1:200) and DAPI-containing mounting solution Vectashield (Vector Laboratories), and the images were taken using a Nikon inverted microscope Eclipse Ti-U equipped with a digital camera.
Methylation Analyses of the STK26 Promoter
Genomic DNA extraction from GSCs was performed using Gentra Puragene Cell kit (Qiagen). Genomic DNAs prepared from GSCs were used for the Illumina 450K array profiling that interrogates 485577 CpG loci across the whole genome. The 450K array profiling was carried out at the NUSeq Core at Northwestern University. Chip processing was carried out following the manufacturer instructions. The signal intensities obtained from the Illumina GenomeStudio was converted to β values and normalization was carried out to remove biases between the Infinium I and II probes. In order to preserve the biological variations on methylation profiles among different subtypes, no further normalization was performed (Laird, 2010, Pidsley et al., 2013). The data were deposited to GEO with a deposit number of GSE90498.
Methylation analyses of STK26 CpG island promoter region were carried out using combined bisulfite and restriction analyses (CoBRA) and direct bisulfite sequencing. Nested CoBRA primers were designed using previously published standard primers designing criteria for bisulphite converted genomic DNA. Bisulfite conversion of genomic DNA was carried out prior to CoBRA analyses using EpiTect Bisulfite conversion kit (Qiagen). Briefly, 300 ng of genomic DNA isolated from GSCs was mixed up with 85 μl bisulfite mix and 15 μl DNA protect buffer making up a total volume of 140 μl with RNase free water. The samples were incubated at various denaturation and annealing cycles for approximately 5 hr, which were then processed following manufacturer’s instructions. Prior to bisulfite conversion, fully methylated positive controls were also generated by incubating samples with S-Adenosyl methionine (SAM) and DNA methyltransferase (New England Biolabs) at 37°C for 2 hr.
Direct bisulfite sequencing was carried out to determine the methylation status of MST4 at single base resolution using gel-purified CoBRA PCR products. The 10 μl of PCR product were treated for 1 hr with Bsh1236I (Thermo Scientific) recognizing the 5′-CGCG-3′ sequence at 37°C. After digestion, samples were resolved by using agarose gels. The CoBRA PCR products were purified using QIAquick Gel Extraction Kit (Qiagen) and were then sub-cloned into a pGEM-T vector (Promega, Cat#: A3600). The successful clones were extracted and sequenced by using T7 promoter sequencing primers at the core facility of the Centre for Genetic Medicine, Northwestern University.
Proteomics Analysis of MST4 Phosphorylation in GSCs
Proteomics analysis for MST4-induced protein phosphorylation in GSCs was performed at the Mass Spectrometry Research Center (MSRC) at Vanderbilt University Medical Center (https://medschool.vanderbilt.edu/msrc/). Briefly, total cell lysates were prepared from GSC 17, 17/MST4 cells that stably overexpress exogenous MST4, GSC M83 and JK83 that express endogenous MST4 protein at high levels (Figure 1B). The samples were sent to the MSRC at Vanderbilt University and analyzed for protein phosphorylation as previous described (Baucum et al., 2015).
Analysis of the ATG4B Cleavage of FRET-LC3B
Analysis of the ATG4B-mediated cleavage of FRET-LC3B fusion protein substrates by SDS-PAGE was performed as previously described (Li et al., 2012). Briefly, FRET-LC3B proteins were expressed in E. coli BL21 (DE3), and purified by affinity chromatography using PrepEase (USB, 78796) and gel filtration using a Superdex 75 column (GE Health, 17-1068-01), and verified by SDS-PAGE and Coomassie Brilliant Blue (CBB) staining. Purified FRET-LC3B (5 μg) were mixed with 25 μg of cell lysates of GSCs with indicated modifications in Buffer B (150 mM NaCl, 1 mM EDTA, 50 mM Tris-HCl, pH 7.5). After incubation at 37°C for 20 min, the reactions were stopped by the addition of sample buffer, separated by SDS-PAGE and examined by Coomassie Brilliant Blue staining.
Transmission Electron Microscopy
Transmission electron microscopy (EM) analyses were performed at the Cell Imaging Center of Northwestern University School of Medicine as previously described (Zhang et al., 2015). Briefly, GSCs were collected and fixed 2% paraformaldehyde/2.5% glutaraldehyde (Polysciences) in 100 mM phosphate buffer (pH 7.2) at 4°C overnight. After fixation, samples were placed in 2% osmium tetroxide (0.1 M PBS, pH 7.4), dehydrated in a graded series of ethyl alcohol, and embedded in epon resin. Ultra-thin sections were counterstained with uranyl acetate and lead citrate, and photographed in Tecnai Spirit G2 transmission electron microscope (Tokyo, Japan).
In Vitro Kinase Assay
The pcDNA3.1 expression vectors of myc-MST4-WT and –K53E were transfected into HEK293T cells by using lipofectamine 2000 (Thermo Fisher Scientific). After 48 hr, cells were lysed in lysis buffer containing 20 mM Tris-HCl (pH 8.0), 0.5% Nonidet P-40, 250 mM NaCl, 3 mM EDTA, 3 mM EGTA, 2 mM DTT, 0.5 mM phenylmethylsulfonyfluoride (PMSF), 20 mM beta-glycerolphosphate, 1 mM sodium orthovanadate and 1 μg/ml leupeptin. Myc-MST4 protein in cell lysates was immunoprecipitated by using a mouse anti-Myc-Tag antibody (9B11) conjugated with Sepharose beads (Cell Signaling, # 3400) by rotation at 4°C overnight. The precipitated MST4 proteins were re-suspended in 40 μl of 1 X kinase buffer (Cell Signaling, #9802) supplemented with 200 μM ATP (Cell Signaling, #9804) and purified His-ATG4B-WT or –S383A protein, which was expressed in pET-28a vector in E. coli. The reaction was carried out for 30 min at 30°C, and was terminated with 20 μl 3X SDS sample buffer. Each sample was then boiled for 10 min at 100°C, followed by SDS-PAGE and IB analysis using indicated antibodies.
IHC Analysis of Clinical GBM Specimens
All human tissue research in this study was conducted under protocols approved by the Northwestern University Institutional Review Board (IRB) in Chicago, IL, USA. A total of 101 de-identified paraffin-embedded human GBM specimens (WHO grade IV) were collected from 2001 to 2013 at Saitama Medical University, Saitama, Japan. These clinical GBM specimens were examined and diagnosed by pathologists at Saitama Medical University. IHC was performed, and percentage of positively stained cells was quantified and statistically analyzed as previously described (Huang et al., 2016).
The tissue sections of clinical GBM specimens were stained with antibodies against MST4 (1:50, ab52491, Abcam), p-ATG4B (1:50, Abmart) and LC3B (#3868, Cell Signaling Technology). A rabbit polyclonal anti–phospho-ATG4BS383 antibody was generated by immunizing animals with a synthetic phospho-peptide corresponding to residues surrounding S383 of human ATG4B. The antibody was then affinity purified. Nonspecific IgGs were used as negative controls. The data shown in Figures 8B and 8C were generated based on the scores of IHC antibody staining of paraffin-embedded GBM clinical tumor sample sections. Sensitivities of each antibody such as the anti-MST4, anti-p-S383-ATG4B and anti-LC3B antibodies used in this study on detection of corresponding protein expression on GBM tumor sample sections are variable. This phenomenon is very common in IHC staining analyses using antibodies for human and animal tissue sections. As we recently described (Huang et al., 2016), we used the same score system for the intensities of stained signals in these analyses. Briefly, IHC staining was quantified as follows: 3+, positive signals in ∼50% tumor cells; 2+, positive signals in ∼25% tumor cells; 1+, positive signals in ∼5% to 25% tumor cells; ±, low or no positive signals in <1% tumor cells; –, no detectable signals in all tumor cells (0%). Tumors with – or ± staining were considered as low expression, and tumors with 1+ to 3+ scores were considered as high expression. Due to the variations on the sensitivity of each antibody we used in our IHC analyses and due to the inherent tumor heterogeneity between individual GBM tumor samples, even the cut-off/definition for the staining scores described above was employed, numbers of GBM samples that showed high or low expression of these three individual proteins are different in each graph.
Quantification and Statistical Analysis
Statistical analysis was carried out using Microsoft Excel 2013 and GraphPad Prism version 5.00 for Windows. Analysis included one-way ANOVA with Newman-Keuls post-test, the Mann-Whitney U test, and paired two-way Student t-test. Log-rank test was used to determine the significance of Kaplan-Meier curves. All grouped data are presented as mean ± SEM unless otherwise stated.
Data and Software Availability
Data of the microarray gene expression were previously deposited at the GEO under an accession number of GSE67089 (Mao et al., 2013). Data of 450 DNA methylation arrays of GSCs have been deposited in the GEO under an accession number of GSE90498.
Author Contributions
Conceptualization, S.-Y.C. and B.H.; Methodology, S.-Y.C. and B.H.; Formal Analysis, T.H., S.-Y.C., B.H., A.A.A., X.W., S.L., X.L., and X.-M.Y.; Investigation, T.H., C.K.K., A.A.A., R.P.P., X.W., X.S., Y.Y., T.S., N.S., and S.L.; Resources, C.M.H., J.A.K., R.N., I.N., X.L., C.D.J., E.P.S., R.S., and X.-M.Y.; Writing – Original Draft, T.H., S.-Y.C., B.H., A.A.A., X.W., N.S., S.L., X.L., and X.-M.Y.; Writing – Review & Editing, T.H., S.-Y.C., B.H., C.D.J., A.A.A., X.W., N.S., R.P.P., S.L., X.L., and X.-M.Y.; Supervision, S.-Y.C. and B.H.; Project Administration, S.-Y.C. and B.H.; Funding Acquisition, S.-Y.C. and B.H.
Acknowledgments
We thank Drs. C. Brennan, A. Sanz-Clemente, C. He, W. Zhang, and S. Huang for providing reagents and advice. This work was supported by US NIH grants NS093843, NS095634, CA158911 (S.Y.C.); a Brain Cancer Research Award from James S. McDonnell Foundation (B.H.); L32 MD010147 and T32 CA070085 (A.A.A.), CA163205, CA175875, NS083767 (I.N.), CA159467, NS080619 (C.D.J.), NS081774 (J.A.K.), LM012011 (X.L.), LM011673 (S.L.), NS102669 (C.H.), AA021751 (X.-M.Y.), and The Lou and Jean Malnati Brain Tumor Institute at Northwestern Medcine (S.-Y.C., B.H.). S.-Y.C. is a Zell Scholar at Northwestern University.
Published: December 11, 2017
Footnotes
Supplemental Information includes seven figures and six tables and can be found with this article online at https://doi.org/10.1016/j.ccell.2017.11.005.
Contributor Information
Bo Hu, Email: bo.hu@northwestern.edu.
Shi-Yuan Cheng, Email: shiyuan.cheng@northwestern.edu.
Supplemental Information
References
- Akin D., Wang S.K., Habibzadegah-Tari P., Law B., Ostrov D., Li M., Yin X.M., Kim J.S., Horenstein N., Dunn W.A., Jr. A novel ATG4B antagonist inhibits autophagy and has a negative impact on osteosarcoma tumors. Autophagy. 2014;10:2021–2035. doi: 10.4161/auto.32229. [DOI] [PMC free article] [PubMed] [Google Scholar]
- Amaravadi R., Kimmelman A.C., White E. Recent insights into the function of autophagy in cancer. Genes Dev. 2016;30:1913–1930. doi: 10.1101/gad.287524.116. [DOI] [PMC free article] [PubMed] [Google Scholar]
- Baucum A.J., 2nd, Shonesy B.C., Rose K.L., Colbran R.J. Quantitative proteomics analysis of CaMKII phosphorylation and the CaMKII interactome in the mouse forebrain. ACS Chem. Neurosci. 2015;6:615–631. doi: 10.1021/cn500337u. [DOI] [PMC free article] [PubMed] [Google Scholar]
- Bhat K.P., Balasubramaniyan V., Vaillant B., Ezhilarasan R., Hummelink K., Hollingsworth F., Wani K., Heathcock L., James J.D., Goodman L.D. Mesenchymal differentiation mediated by NF-kappaB promotes radiation resistance in glioblastoma. Cancer Cell. 2013;24:331–346. doi: 10.1016/j.ccr.2013.08.001. [DOI] [PMC free article] [PubMed] [Google Scholar]
- Bortnik S., Choutka C., Horlings H.M., Leung S., Baker J.H., Lebovitz C., Dragowska W.H., Go N.E., Bally M.B., Minchinton A.I. Identification of breast cancer cell subtypes sensitive to ATG4B inhibition. Oncotarget. 2016;7:66970–66988. doi: 10.18632/oncotarget.11408. [DOI] [PMC free article] [PubMed] [Google Scholar]
- Cabrera S., Fernandez A.F., Marino G., Aguirre A., Suarez M.F., Espanol Y., Vega J.A., Laura R., Fueyo A., Fernandez-Garcia M.S. ATG4B/autophagin-1 regulates intestinal homeostasis and protects mice from experimental colitis. Autophagy. 2013;9:1188–1200. doi: 10.4161/auto.24797. [DOI] [PMC free article] [PubMed] [Google Scholar]
- Degtyarev M., De Maziere A., Orr C., Lin J., Lee B.B., Tien J.Y., Prior W.W., van Dijk S., Wu H., Gray D.C. Akt inhibition promotes autophagy and sensitizes PTEN-null tumors to lysosomotropic agents. J. Cell Biol. 2008;183:101–116. doi: 10.1083/jcb.200801099. [DOI] [PMC free article] [PubMed] [Google Scholar]
- Dunn G.P., Rinne M.L., Wykosky J., Genovese G., Quayle S.N., Dunn I.F., Agarwalla P.K., Chheda M.G., Campos B., Wang A. Emerging insights into the molecular and cellular basis of glioblastoma. Genes Dev. 2012;26:756–784. doi: 10.1101/gad.187922.112. [DOI] [PMC free article] [PubMed] [Google Scholar]
- Egan D.F., Chun M.G., Vamos M., Zou H., Rong J., Miller C.J., Lou H.J., Raveendra-Panickar D., Yang C.C., Sheffler D.J. Small molecule inhibition of the autophagy kinase ULK1 and identification of ULK1 substrates. Mol. Cell. 2015;59:285–297. doi: 10.1016/j.molcel.2015.05.031. [DOI] [PMC free article] [PubMed] [Google Scholar]
- Fan Q.W., Cheng C., Hackett C., Feldman M., Houseman B.T., Nicolaides T., Haas-Kogan D., James C.D., Oakes S.A., Debnath J. Akt and autophagy cooperate to promote survival of drug-resistant glioma. Sci. Signal. 2010;3:ra81. doi: 10.1126/scisignal.2001017. [DOI] [PMC free article] [PubMed] [Google Scholar]
- Gewirtz D.A. The challenge of developing autophagy inhibition as a therapeutic strategy. Cancer Res. 2016;76:5610–5614. doi: 10.1158/0008-5472.CAN-16-0722. [DOI] [PMC free article] [PubMed] [Google Scholar]
- Heras-Sandoval D., Perez-Rojas J.M., Hernandez-Damian J., Pedraza-Chaverri J. The role of PI3K/AKT/mTOR pathway in the modulation of autophagy and the clearance of protein aggregates in neurodegeneration. Cell Signal. 2014;26:2694–2701. doi: 10.1016/j.cellsig.2014.08.019. [DOI] [PubMed] [Google Scholar]
- Hu J., Rho H.S., Newman R.H., Zhang J., Zhu H., Qian J. PhosphoNetworks: a database for human phosphorylation networks. Bioinformatics. 2014;30:141–142. doi: 10.1093/bioinformatics/btt627. [DOI] [PMC free article] [PubMed] [Google Scholar]
- Hu Y.L., Jahangiri A., Delay M., Aghi M.K. Tumor cell autophagy as an adaptive response mediating resistance to treatments such as antiangiogenic therapy. Cancer Res. 2012;72:4294–4299. doi: 10.1158/0008-5472.CAN-12-1076. [DOI] [PMC free article] [PubMed] [Google Scholar]
- Huang T., Alvarez A.A., Pangeni R.P., Horbinski C.M., Lu S., Kim S.H., James C.D., J Raizer J., A Kessler J., Brenann C.W. A regulatory circuit of miR-125b/miR-20b and Wnt signalling controls glioblastoma phenotypes through FZD6-modulated pathways. Nat. Commun. 2016;7:12885. doi: 10.1038/ncomms12885. [DOI] [PMC free article] [PubMed] [Google Scholar]
- Janku F., McConkey D.J., Hong D.S., Kurzrock R. Autophagy as a target for anticancer therapy. Nat. Rev. Clin. Oncol. 2011;8:528–539. doi: 10.1038/nrclinonc.2011.71. [DOI] [PubMed] [Google Scholar]
- Jiao S., Zhang Z., Li C., Huang M., Shi Z., Wang Y., Song X., Liu H., Li C., Chen M. The kinase MST4 limits inflammatory responses through direct phosphorylation of the adaptor TRAF6. Nat. Immunol. 2015;16:246–257. doi: 10.1038/ni.3097. [DOI] [PubMed] [Google Scholar]
- Kabeya Y., Mizushima N., Yamamoto A., Oshitani-Okamoto S., Ohsumi Y., Yoshimori T. LC3, GABARAP and GATE16 localize to autophagosomal membrane depending on form-II formation. J. Cell Sci. 2004;117:2805–2812. doi: 10.1242/jcs.01131. [DOI] [PubMed] [Google Scholar]
- Kim S.H., Ezhilarasan R., Phillips E., Gallego-Perez D., Sparks A., Taylor D., Ladner K., Furuta T., Sabit H., Chhipa R. Serine/Threonine kinase MLK4 determines mesenchymal identity in glioma stem cells in an NF-kappaB-dependent manner. Cancer Cell. 2016;29:201–213. doi: 10.1016/j.ccell.2016.01.005. [DOI] [PMC free article] [PubMed] [Google Scholar]
- Klionsky D.J., Abdelmohsen K., Abe A., Abedin M.J., Abeliovich H., Acevedo Arozena A., Adachi H., Adams C.M., Adams P.D., Adeli K. Guidelines for the use and interpretation of assays for monitoring autophagy (3rd edition) Autophagy. 2016;12:1–222. doi: 10.1080/15548627.2015.1100356. [DOI] [PMC free article] [PubMed] [Google Scholar]
- Kondo Y., Kanzawa T., Sawaya R., Kondo S. The role of autophagy in cancer development and response to therapy. Nat. Rev. Cancer. 2005;5:726–734. doi: 10.1038/nrc1692. [DOI] [PubMed] [Google Scholar]
- Kroemer G. Autophagy: a druggable process that is deregulated in aging and human disease. J. Clin. Invest. 2015;125:1–4. doi: 10.1172/JCI78652. [DOI] [PMC free article] [PubMed] [Google Scholar]
- Kuang E., Okumura C.Y., Sheffy-Levin S., Varsano T., Shu V.C., Qi J., Niesman I.R., Yang H.J., Lopez-Otin C., Yang W.Y. Regulation of ATG4B stability by RNF5 limits basal levels of autophagy and influences susceptibility to bacterial infection. PLoS Genet. 2012;8:e1003007. doi: 10.1371/journal.pgen.1003007. [DOI] [PMC free article] [PubMed] [Google Scholar]
- Laird P.W. Principles and challenges of genomewide DNA methylation analysis. Nat. Rev. Genet. 2010;11:191–203. doi: 10.1038/nrg2732. [DOI] [PubMed] [Google Scholar]
- Levine B., Kroemer G. Autophagy in the pathogenesis of disease. Cell. 2008;132:27–42. doi: 10.1016/j.cell.2007.12.018. [DOI] [PMC free article] [PubMed] [Google Scholar]
- Levy J.M., Thompson J.C., Griesinger A.M., Amani V., Donson A.M., Birks D.K., Morgan M.J., Mirsky D.M., Handler M.H., Foreman N.K., Thorburn A. Autophagy inhibition improves chemosensitivity in BRAF(V600E) brain tumors. Cancer Discov. 2014;4:773–780. doi: 10.1158/2159-8290.CD-14-0049. [DOI] [PMC free article] [PubMed] [Google Scholar]
- Li M., Chen X., Ye Q.Z., Vogt A., Yin X.M. A high-throughput FRET-based assay for determination of Atg4 activity. Autophagy. 2012;8:401–412. doi: 10.4161/auto.18777. [DOI] [PMC free article] [PubMed] [Google Scholar]
- Li M., Hou Y., Wang J., Chen X., Shao Z.M., Yin X.M. Kinetics comparisons of mammalian Atg4 homologues indicate selective preferences toward diverse Atg8 substrates. J. Biol. Chem. 2011;286:7327–7338. doi: 10.1074/jbc.M110.199059. [DOI] [PMC free article] [PubMed] [Google Scholar]
- Madsen C.D., Hooper S., Tozluoglu M., Bruckbauer A., Fletcher G., Erler J.T., Bates P.A., Thompson B., Sahai E. STRIPAK components determine mode of cancer cell migration and metastasis. Nat. Cell Biol. 2015;17:68–80. doi: 10.1038/ncb3083. [DOI] [PMC free article] [PubMed] [Google Scholar]
- Mao P., Joshi K., Li J., Kim S.H., Li P., Santana-Santos L., Luthra S., Chandran U.R., Benos P.V., Smith L. Mesenchymal glioma stem cells are maintained by activated glycolytic metabolism involving aldehyde dehydrogenase 1A3. Proc. Natl. Acad. Sci. USA. 2013;110:8644–8649. doi: 10.1073/pnas.1221478110. [DOI] [PMC free article] [PubMed] [Google Scholar]
- Marino G., Fernandez A.F., Cabrera S., Lundberg Y.W., Cabanillas R., Rodriguez F., Salvador-Montoliu N., Vega J.A., Germana A., Fueyo A. Autophagy is essential for mouse sense of balance. J. Clin. Invest. 2010;120:2331–2344. doi: 10.1172/JCI42601. [DOI] [PMC free article] [PubMed] [Google Scholar]
- Marino G., Uria J.A., Puente X.S., Quesada V., Bordallo J., Lopez-Otin C. Human autophagins, a family of cysteine proteinases potentially implicated in cell degradation by autophagy. J. Biol. Chem. 2003;278:3671–3678. doi: 10.1074/jbc.M208247200. [DOI] [PubMed] [Google Scholar]
- Mizushima N., Komatsu M. Autophagy: renovation of cells and tissues. Cell. 2011;147:728–741. doi: 10.1016/j.cell.2011.10.026. [DOI] [PubMed] [Google Scholar]
- Mizushima N., Yoshimori T., Ohsumi Y. The role of Atg proteins in autophagosome formation. Annu. Rev. Cell Dev. Biol. 2011;27:107–132. doi: 10.1146/annurev-cellbio-092910-154005. [DOI] [PubMed] [Google Scholar]
- Osuka S., Van Meir E.G. Overcoming therapeutic resistance in glioblastoma: the way forward. J. Clin. Invest. 2017;127:415–426. doi: 10.1172/JCI89587. [DOI] [PMC free article] [PubMed] [Google Scholar]
- Pidsley R., Wong C.C.Y., Volta M., Lunnon K., Mill J., Schalkwyk L.C. A data-driven approach to preprocessing Illumina 450K methylation array data. BMC Genomics. 2013;14:293. doi: 10.1186/1471-2164-14-293. [DOI] [PMC free article] [PubMed] [Google Scholar]
- Qian Z., Lin C., Espinosa R., LeBeau M., Rosner M.R. Cloning and characterization of MST4, a novel Ste20-like kinase. J. Biol. Chem. 2001;276:22439–22445. doi: 10.1074/jbc.M009323200. [DOI] [PubMed] [Google Scholar]
- Read R., Savelieva K., Baker K., Hansen G., Vogel P. Histopathological and neurological features of Atg4b knockout mice. Vet. Pathol. 2011;48:486–494. doi: 10.1177/0300985810375810. [DOI] [PubMed] [Google Scholar]
- Rohle D., Popovici-Muller J., Palaskas N., Turcan S., Grommes C., Campos C., Tsoi J., Clark O., Oldrini B., Komisopoulou E. An inhibitor of mutant IDH1 delays growth and promotes differentiation of glioma cells. Science. 2013;340:626–630. doi: 10.1126/science.1236062. [DOI] [PMC free article] [PubMed] [Google Scholar]
- Rosenfeld M.R., Ye X., Supko J.G., Desideri S., Grossman S.A., Brem S., Mikkelson T., Wang D., Chang Y.C., Hu J. A phase I/II trial of hydroxychloroquine in conjunction with radiation therapy and concurrent and adjuvant temozolomide in patients with newly diagnosed glioblastoma multiforme. Autophagy. 2014;10:1359–1368. doi: 10.4161/auto.28984. [DOI] [PMC free article] [PubMed] [Google Scholar]
- Rothe K., Lin H., Lin K.B., Leung A., Wang H.M., Malekesmaeili M., Brinkman R.R., Forrest D.L., Gorski S.M., Jiang X. The core autophagy protein ATG4B is a potential biomarker and therapeutic target in CML stem/progenitor cells. Blood. 2014;123:3622–3634. doi: 10.1182/blood-2013-07-516807. [DOI] [PubMed] [Google Scholar]
- Srikanth M., Das S., Berns E.J., Kim J., Stupp S.I., Kessler J.A. Nanofiber-mediated inhibition of focal adhesion kinase sensitizes glioma stemlike cells to epidermal growth factor receptor inhibition. Neuro Oncol. 2013;15:319–329. doi: 10.1093/neuonc/nos316. [DOI] [PMC free article] [PubMed] [Google Scholar]
- Stewart S.A., Dykxhoorn D.M., Palliser D., Mizuno H., Yu E.Y., An D.S., Sabatini D.M., Chen I.S., Hahn W.C., Sharp P.A. Lentivirus-delivered stable gene silencing by RNAi in primary cells. RNA. 2003;9:493–501. doi: 10.1261/rna.2192803. [DOI] [PMC free article] [PubMed] [Google Scholar]
- Tanida I., Ueno T., Kominami E. LC3 conjugation system in mammalian autophagy. Int. J. Biochem. Cell Biol. 2004;36:2503–2518. doi: 10.1016/j.biocel.2004.05.009. [DOI] [PMC free article] [PubMed] [Google Scholar]
- ten Klooster J.P., Jansen M., Yuan J., Oorschot V., Begthel H., Di Giacomo V., Colland F., de Koning J., Maurice M.M., Hornbeck P. Mst4 and Ezrin induce brush borders downstream of the Lkb1/Strad/Mo25 polarization complex. Dev. Cell. 2009;16:551–562. doi: 10.1016/j.devcel.2009.01.016. [DOI] [PubMed] [Google Scholar]
- Thompson B.J., Sahai E. MST kinases in development and disease. J. Cell Biol. 2015;210:871–882. doi: 10.1083/jcb.201507005. [DOI] [PMC free article] [PubMed] [Google Scholar]
- Walter D.M., Venancio O.S., Buza E.L., Tobias J.W., Deshpande C., Gudiel A.A., Kim-Kiselak C., Cicchini M., Yates T.J., Feldser D.M. Systematic in vivo inactivation of chromatin-regulating enzymes identifies setd2 as a potent tumor suppressor in lung adenocarcinoma. Cancer Res. 2017;77:1719–1729. doi: 10.1158/0008-5472.CAN-16-2159. [DOI] [PMC free article] [PubMed] [Google Scholar]
- Wang Q., Hu B., Hu X., Kim H., Squatrito M., Scarpace L., deCarvalho A.C., Lyu S., Li P., Li Y. Tumor evolution of glioma-intrinsic gene expression subtypes associates with immunological changes in the microenvironment. Cancer Cell. 2017;32:42–56.e6. doi: 10.1016/j.ccell.2017.06.003. [DOI] [PMC free article] [PubMed] [Google Scholar]
- Wen P.Y., Kesari S. Malignant gliomas in adults. N. Engl. J. Med. 2008;359:492–507. doi: 10.1056/NEJMra0708126. [DOI] [PubMed] [Google Scholar]
- White E. The role for autophagy in cancer. J. Clin. Invest. 2015;125:42–46. doi: 10.1172/JCI73941. [DOI] [PMC free article] [PubMed] [Google Scholar]
- Xie Z., Klionsky D.J. Autophagosome formation: core machinery and adaptations. Nat. Cell Biol. 2007;9:1102–1109. doi: 10.1038/ncb1007-1102. [DOI] [PubMed] [Google Scholar]
- Xiong W., Knox A.J., Xu M., Kiseljak-Vassiliades K., Colgan S.P., Brodsky K.S., Kleinschmidt-Demasters B.K., Lillehei K.O., Wierman M.E. Mammalian Ste20-like kinase 4 promotes pituitary cell proliferation and survival under hypoxia. Mol. Endocrinol. 2015;29:460–472. doi: 10.1210/me.2014-1332. [DOI] [PMC free article] [PubMed] [Google Scholar]
- Xiong W., Matheson C.J., Xu M., Backos D.S., Mills T.S., Salian-Mehta S., Kiseljak-Vassiliades K., Reigan P., Wierman M.E. Structure-based screen identification of a mammalian ste20-like kinase 4 (MST4) inhibitor with therapeutic potential for pituitary tumors. Mol. Cancer Ther. 2016;15:412–420. doi: 10.1158/1535-7163.MCT-15-0703. [DOI] [PMC free article] [PubMed] [Google Scholar]
- Yang Z., Wilkie-Grantham R.P., Yanagi T., Shu C.W., Matsuzawa S., Reed J.C. ATG4B (Autophagin-1) phosphorylation modulates autophagy. J. Biol. Chem. 2015;290:26549–26561. doi: 10.1074/jbc.M115.658088. [DOI] [PMC free article] [PubMed] [Google Scholar]
- Zhang L., Li J., Ouyang L., Liu B., Cheng Y. Unraveling the roles of Atg4 proteases from autophagy modulation to targeted cancer therapy. Cancer Lett. 2016;373:19–26. doi: 10.1016/j.canlet.2016.01.022. [DOI] [PubMed] [Google Scholar]
- Zhang Q., Kuang H., Chen C., Yan J., Do-Umehara H.C., Liu X.Y., Dada L., Ridge K.M., Chandel N.S., Liu J. The kinase Jnk2 promotes stress-induced mitophagy by targeting the small mitochondrial form of the tumor suppressor ARF for degradation. Nat. Immunol. 2015;16:458–466. doi: 10.1038/ni.3130. [DOI] [PMC free article] [PubMed] [Google Scholar]
Associated Data
This section collects any data citations, data availability statements, or supplementary materials included in this article.