Abstract
Strengthening of synaptic connections by NMDA-receptor-dependent long-term potentiation (LTP) shapes neural circuits and mediates learning and memory. During NMDA-receptor-dependent LTP induction, Ca2+-influx stimulates recruitment of synaptic AMPA-receptors, thereby strengthening synapses. How Ca2+ induces AMPA-receptor recruitment, however, remains unclear. Here we show that, in pyramidal neurons of the hippocampal CA1-region, blocking postsynaptic expression of both synaptotagmin-1 and synaptotagmin-7, but not of synaptotagmin-1 or synaptotagmin-7 alone, abolished LTP. LTP was rescued by wild-type but not by Ca2+-binding-deficient mutant synaptotagmin-7. Blocking postsynaptic synaptotagmin-1/7 expression did not impair basal synaptic transmission, synaptic or extrasynaptic AMPA-receptor levels, or other AMPA-receptor trafficking events. Moreover, expression of dominant-negative mutant synaptotagmin-1 that inhibited Ca2+-dependent presynaptic vesicle exocytosis also blocked Ca2+-dependent postsynaptic AMPA-receptor exocytosis, thereby abolishing LTP. Our results suggest that postsynaptic synaptotagmin-1 and synaptotagmin-7 act as redundant Ca2+-sensors for Ca2+-dependent exocytosis of AMPA-receptors during LTP, thus delineating a simple mechanism for the recruitment of AMPA-receptors that mediates LTP.
Synapses connect neurons in brain into vast communicating networks composed of overlapping circuits that are highly dynamic owing to synaptic plasticity. Arguably the most compelling form of such plasticity is NMDA-receptor- (NMDAR-) dependent LTP1–3. NMDAR-dependent LTP is crucial for formation of neural circuits and for restructuring of neural circuits during learning and memory4. NMDAR-dependent LTP operates widely in the brain, but is most extensively studied at CA3-CA1 Schaffer collateral synapses in the hippocampus1–3. During LTP induction, coincident stimulation of presynaptic inputs on a postsynaptic neuron gates postsynaptic Ca2+-influx through NMDARs. Intracellular Ca2+ then causes an increase in postsynaptic levels of AMPA-receptors (AMPARs), thereby enhancing synaptic strength2,3. The mechanisms that increase postsynaptic AMPAR levels during LTP are incompletely understood with Ca2+-dependent capture of extrasynaptic AMPARs by postsynaptic specializations being suggested to be the most critical step5–7. However, blocking postsynaptic membrane fusion impairs AMPAR recruitment during LTP8–10, suggesting a role for Ca2+-dependent AMPAR exocytosis. Thus, two major questions arise: What molecular mechanisms deliver AMPARs at synapses during LTP, and how are these mechanisms regulated by Ca2+?
In considering these questions, we focused on a potential role of postsynaptic synaptotagmins in LTP because synaptotagmins are well established Ca2+-sensors for Ca2+-triggered exocytosis11, and because complexin, a co-factor for synaptotagmins in exocytosis12,13, is also postsynaptically essential for LTP6. Among synaptotagmins, synaptotagmin-1 (Syt1) acts as the major Ca2+-sensor for fast presynaptic vesicle exocytosis, whereas synaptotagmin-7 (Syt7) functions as the predominant Ca2+-sensor for a slower form of exocytosis14–17. Moreover, Syt1 and Syt7 together are redundantly essential for Ca2+-stimulated chromaffin granule exocytosis, which exhibits a time course of seconds similar to LTP induction18. Here, we show that Syt1 and Syt7 act as essential but redundant postsynaptic Ca2+-sensors for AMPAR exocytosis during LTP, uncovering an unexpectedly simple mechanism for the Ca2+-dependent recruitment of AMPARs during LTP (ED Fig. 1).
Postsynaptic Syt1,7 loss blocks LTP
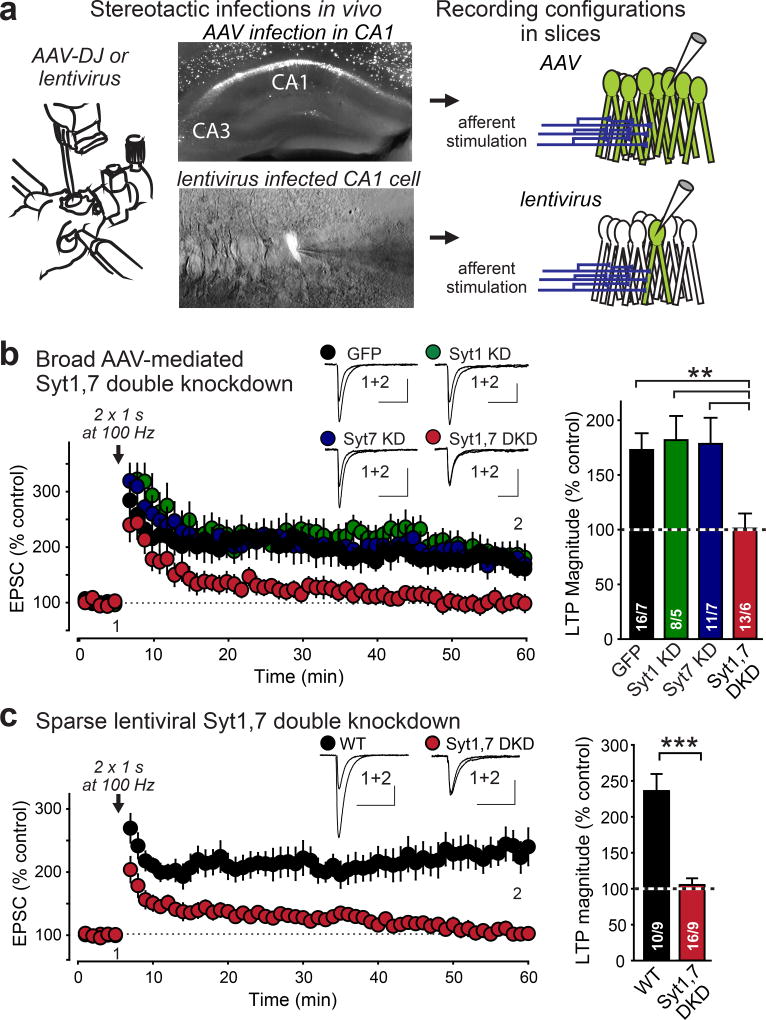
To examine the role of Syt1 and Syt7 in LTP, we applied well-characterized Syt1 and Syt7 shRNAs that suppress Syt1 and Syt7 expression by >80%16,17,19 (ED Fig. 2). Using stereotactic injections of adeno-associated viruses (AAVs) into juvenile mice, we expressed these shRNAs in vivo separately or together in the hippocampal CA1 region and recorded whole-cell currents from individual pyramidal neurons in acute slices 20–36 days post-injection (Fig. 1a). Neurons infected with control AAVs or with AAVs expressing only Syt1 or Syt7 shRNAs exhibited robust LTP (Fig. 1b). In contrast, neurons infected with AAVs expressing both Syt1 and Syt7 shRNAs were, on average, unable to generate LTP (Fig. 1b, ED Fig. 3a). We validated that LTP elicited with our standard induction protocol was blocked by the NMDAR antagonist APV and by the CaM-Kinase IIα inhibitor AIP (ED Fig. 3b).
Figure 1. Inhibiting postsynaptic expression of both Syt1 and Syt7 blocks LTP by a cell-autonomous mechanism.
a, Experimental strategy. Left, schematic of stereotactic virus injections; center, representative EGFP-fluorescence images of hippocampal slices after global AAV or sparse lentivirus infections; right, schematic of whole-cell recordings in acute slices.
b, AAV-mediated double knockdown (DKD) of both Syt1 and Syt7 suppresses NMDAR-dependent LTP. Left, representative traces and LTP time course; right, summary graphs of LTP magnitude.
c, Same as b, but for sparse lentiviral DKD of Syt1 and Syt7.
Data are means ± SEM (numbers in bars = number of neurons/mice analyzed). Statistical significance was assessed by Kruskal-Wallis ANOVA followed by the Mann-Whitney U test (c), or by only the Mann-Whitney U test (d; **, p<0.01; ***, p<0.001). In b and c, calibration bars = 50 pA, 50 ms.
Next, we used stereotactic injections of lentiviruses that express Syt1 and Syt7 shRNAs with EGFP. In contrast to AAVs that infect nearly all neurons in a brain region, lentiviruses infect only a sparse subset of neurons (Fig. 1a). Strikingly, lentiviral expression of Syt1 and Syt7 shRNAs blocked LTP, demonstrating a cell-autonomous mechanism (Fig. 1c, ED Fig. 3c).
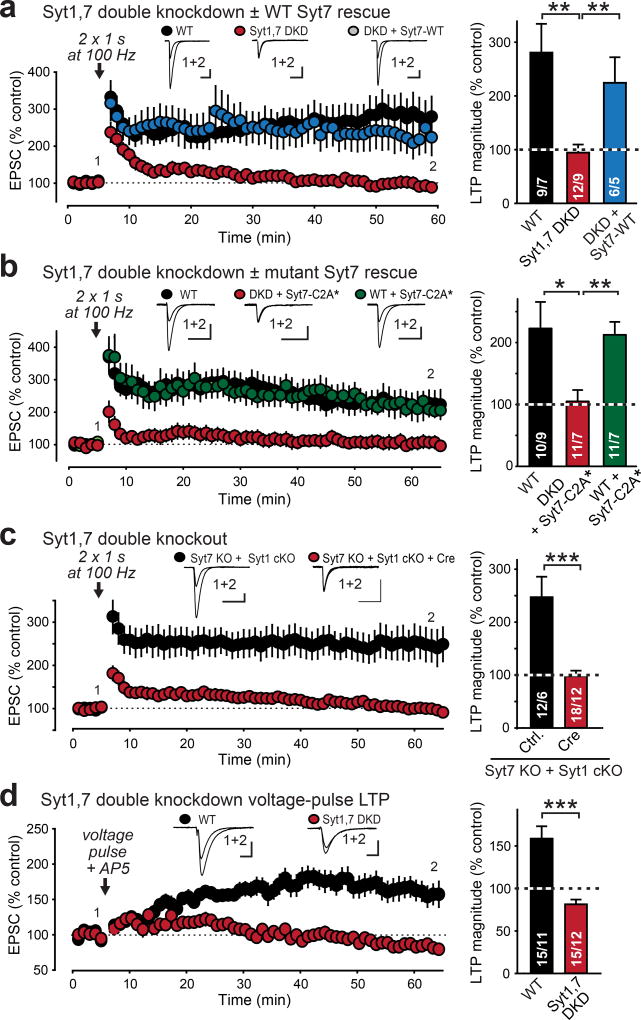
To control for potential off-target effects caused by RNAi knockdowns, we performed additional experiments. First, lentiviral expression of an independent Syt7 shRNA16 with Syt1 knockdown blocked LTP (ED Fig. 3d). Second, the block of LTP by knockdowns of both Syt1 and Syt7 could be reversed by expression of an shRNA-insensitive Syt7 rescue mRNA (Fig. 2a, ED Fig. 3e). Third, mutations in the C2A-domain Ca2+-binding sites of Syt7 (Syt7-C2A*), which abolish its presynaptic function in neurotransmitter release16,17, blocked rescue of LTP, suggesting that Ca2+-binding to Syt7 is essential for its function in LTP (Fig. 2b). The same mutation had no effect on neurotransmitter release16 or on LTP in wild-type (WT) neurons (Fig. 2b), and is thus not dominant-negative. Fourth, lentiviral expression of Syt1 shRNA in constitutive Syt7 KO mice (which by themselves exhibited normal LTP) also ablated LTP; again, LTP was rescued with WT Syt7 (ED Fig. 3f). Fifth, postsynaptic conditional deletion of Syt120 in double-mutant mice that carried a new constitutive Syt7 KO (ED Fig. 3g–i) also robustly blocked LTP (Fig. 2c).
Figure 2. Inhibiting postsynaptic Syt1,7 expression by diverse molecular manipulations universally blocks LTP.
a & b, Blocked LTP after Syt1,7 DKD is rescued by shRNA-resistant WT (a) but not mutant Syt7 (b; Syt7-C2A* contains inactivated C2A-domain Ca2+-binding sites). Left, representative traces and LTP time course; right, summary graphs of LTP magnitude.
c, Conditional KO (cKO) of postsynaptic Syt1 in constitutive Syt7 KO mice blocks LTP.
d, Postsynaptic Syt1,7 DKD also blocks LTP induced by depolarizing voltage pulses in the presence of the NMDAR-antagonist APV.
Data are means ± SEM (numbers in bars = number of neurons/mice analyzed). Statistical significance was assessed in a–c with Kruskal-Wallis ANOVA followed by pairwise comparisons with the Mann-Whitney U test (a–c), or simply by the Mann-Whitney U test (d, e; *, p<0.05; **, p<0.01; ***, p<0.001). Calibration bars = 50 pA, 50 ms for a–d; 50 pA, 10 ms for e.
NMDAR-dependent LTP is induced by Ca2+-influx through NMDAR channels1–3. A similar form of LTP, termed voltage-pulse LTP, is induced by gating postsynaptic Ca2+-influx via L-type Ca2+-channels during blockade of NMDARs21,22. Thus, voltage-pulse LTP is independent of presynaptic neurotransmitter release or postsynaptic NMDARs. Voltage-pulse LTP was also abolished by postsynaptic ablation of Syt1 and Syt7 (Fig. 2d, ED Fig. 3e).
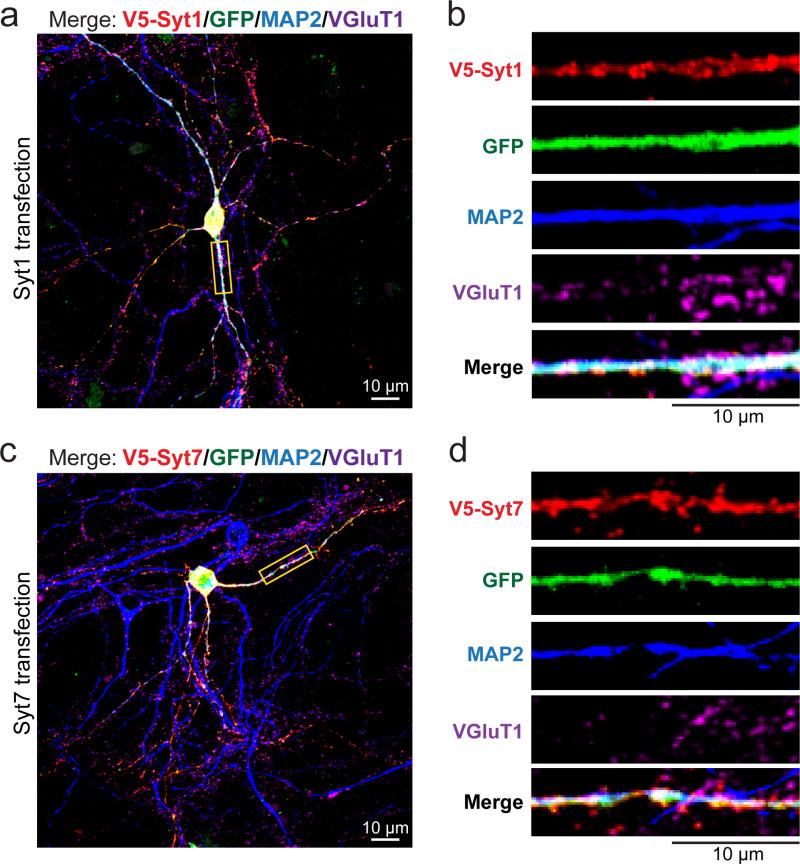
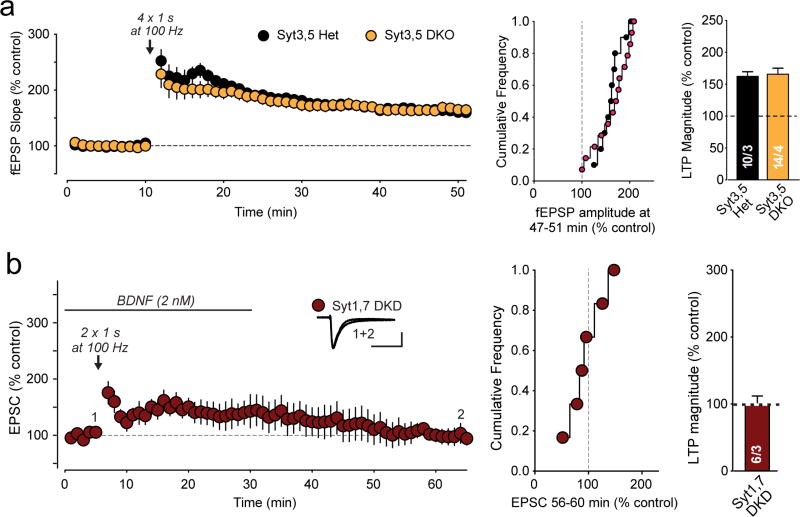
Viewed together, these data show that inhibition of postsynaptic Syt1 and Syt7 expression blocks LTP induced by postsynaptic increases in Ca2+, independent of the source of Ca2+. The postsynaptic Ca2+-dependent function of Syt1 and Syt7 is surprising given the abundant presynaptic localization of Syt1 and Syt711. Although most Syt1 and Syt7 is indeed presynaptic, postsynaptic dendritic Syt1 and Syt7 can nevertheless be detected (ED Fig. 4). Moreover, double KO neurons lacking Syt3 and Syt5 –which belong to a different class of synaptotagmins11 and are the only other two Ca2+-binding synaptotagmins abundantly expressed in CA1 pyramidal neurons– exhibited no impairment of LTP (ED Fig. 5a), demonstrating that the block of LTP by inhibition of postsynaptic Syt1,7 expression is specific to these synaptotagmins.
Syt1,7 in other AMPAR trafficking events
Although our results suggest that Syt1 and Syt7 are redundantly essential for AMPAR exocytosis during LTP, alternative explanations are possible. BDNF may play a role in synaptic plasticity23,24, prompting us to ask whether the Syt1,7 double deficiency may block LTP by inhibiting BDNF secretion. However, BDNF application did not rescue the phenotype, arguing against this explanation (ED Fig. 5b).
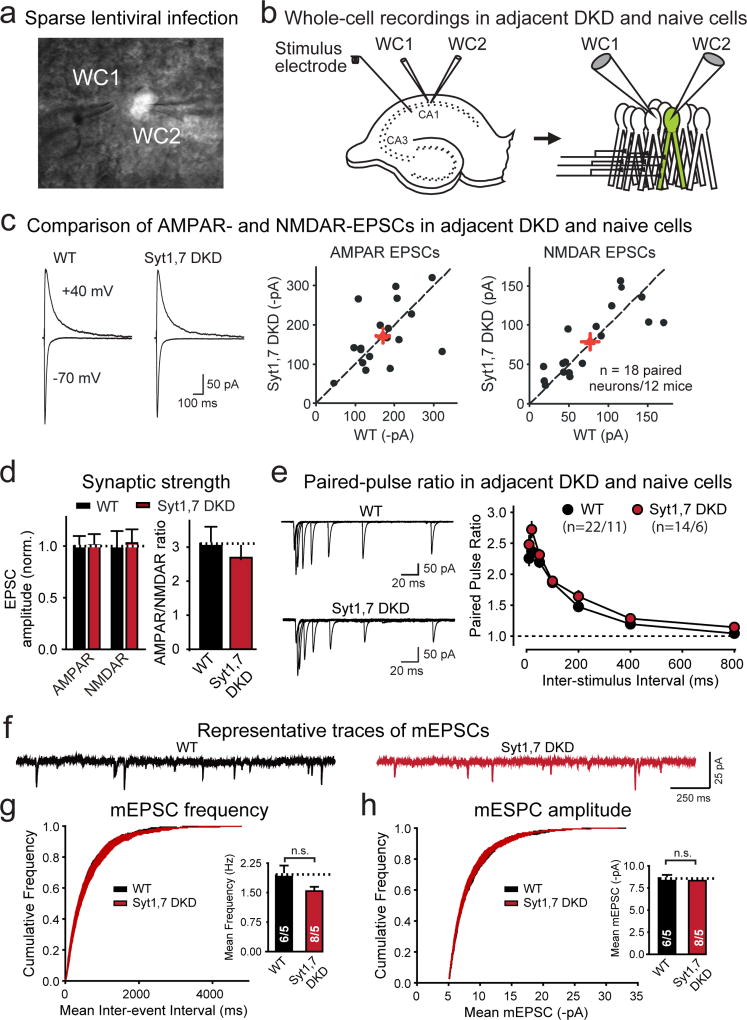
Another possible explanation for the Syt1,7 requirement in LTP is that the Syt1,7 double deficiency may decrease basal synaptic strength, although this would not explain the loss of voltage-pulse induced LTP. However, we observed no differences in basal AMPAR- or NMDAR-EPSCs between control and Syt1,7 double-deficient neurons during dual patch-clamp recordings of adjacent control and Syt1,7-deficient pyramidal CA1 neurons (ED Fig. 6a, b). Moreover, we observed no major differences between control and Syt1,7 double-deficient neurons in paired-pulse ratio (PPR) of AMPAR-EPSCs (ED Fig. 6e) or in the properties of spontaneous miniature excitatory postsynaptic currents (mEPSCs) (ED Fig. 6f–h). Thus, postsynaptic Syt1,7 loss-of-function does not change basal synaptic transmission at synapses on the affected neuron.
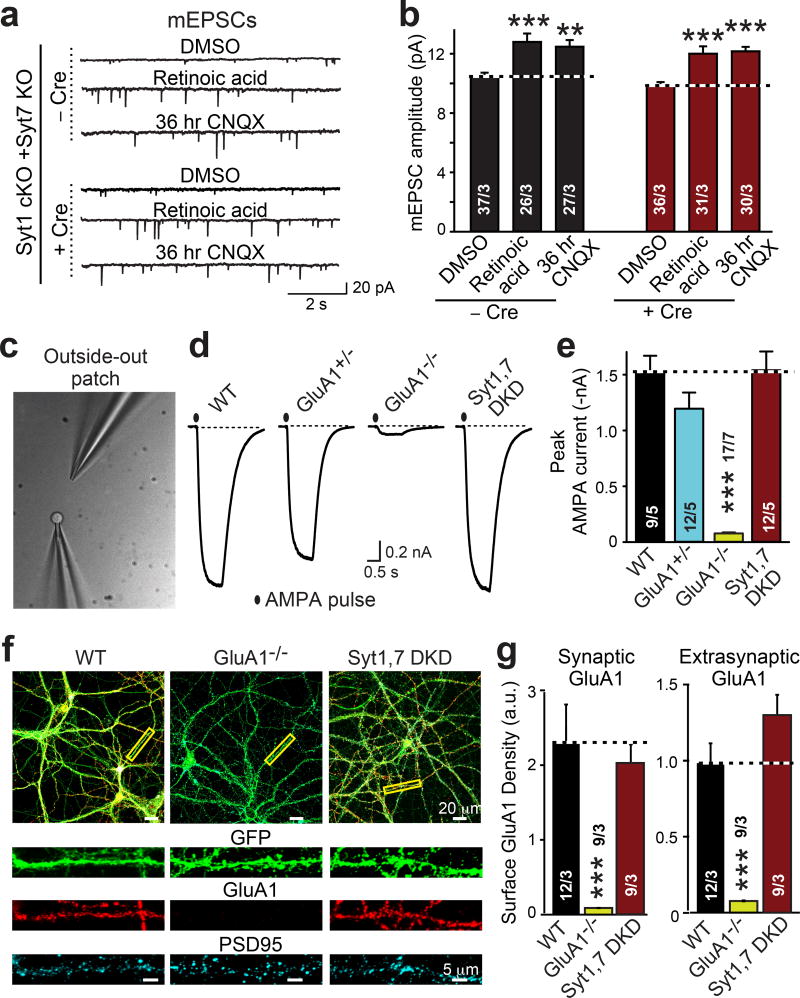
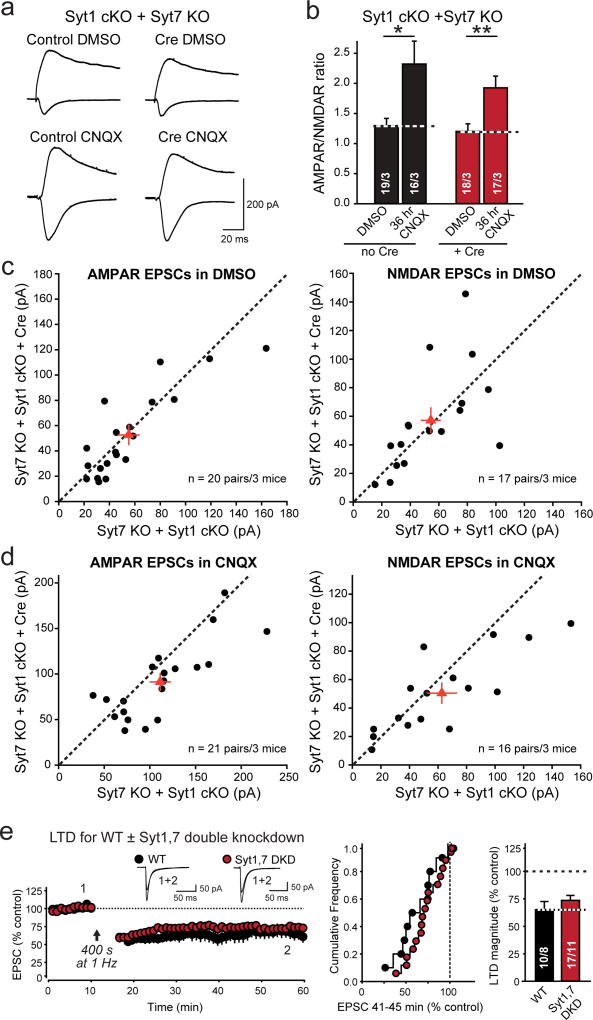
Next, we assessed whether other forms of synaptic plasticity involving AMPAR trafficking may be impaired by the Syt1,7 double deficiency. Both homeostatic plasticity induced by chronic synaptic silencing (36 hr application of CNQX) or by direct application of retinoic acid (4 hr application) potently stimulate synaptic AMPAR recruitment25. Syt1,7 double deficiency had no effect on either form of synaptic AMPAR recruitment (Fig. 3a, b; ED Fig. 7a–d), demonstrating that Syt1 and Syt7 are selectively essential for Ca2+-induced AMPAR recruitment during LTP. Similarly, we observed no effect of the Syt1,7 double deficiency on postsynaptic long-term depression (LTD) that involves NMDAR-dependent AMPAR endocytosis2,3,26 (ED Fig. 7e). Thus, postsynaptic loss of Syt1 and Syt7 in CA1 pyramidal neurons does not detectably impair the activity-dependent trafficking of AMPARs except during LTP.
Figure 3. Postsynaptic Syt1,7 deficiency neither decreases AMPAR recruitment during homeostatic plasticity nor surface AMPAR levels.
a & b, Syt1,7 DKO does not impair AMPAR exocytosis induced in cultured hippocampal slices by chronic synaptic silencing with CNQX (36 hr) or by acute application of retinoic acid (4 hr).
c, Phase-contrast image of a patch pipette with a nucleated outside-out patch (left) and an AMPA-puffing pipette (right).
d, Representative traces of currents induced by s-AMPA (10 µM for 1 s) in outside-out patches.
e, Summary graph of the mean AMPA-puff-induced peak current amplitude.
f, Representative images of control (WT), GluA1 KO (GluA1−/−), and Syt1,7 DKD hippocampal neurons that express EGFP (green) and were stained for surface GluA1 receptors (red) and cytoplasmic PSD95 (cyan).
g, Summary graphs of surface GluA1 staining intensity per pixel in synaptic (signal coincident with PSD95) and extrasynaptic membranes (signal non-coincident with PSD95).
Data are means ± SEM (numbers in bars = number of neurons/mice analyzed). Statistical significance was assessed with Kruskal-Wallis ANOVA followed by pairwise comparisons with the Mann-Whitney U test (***, p<0.001).
Extrasynaptic AMPARs
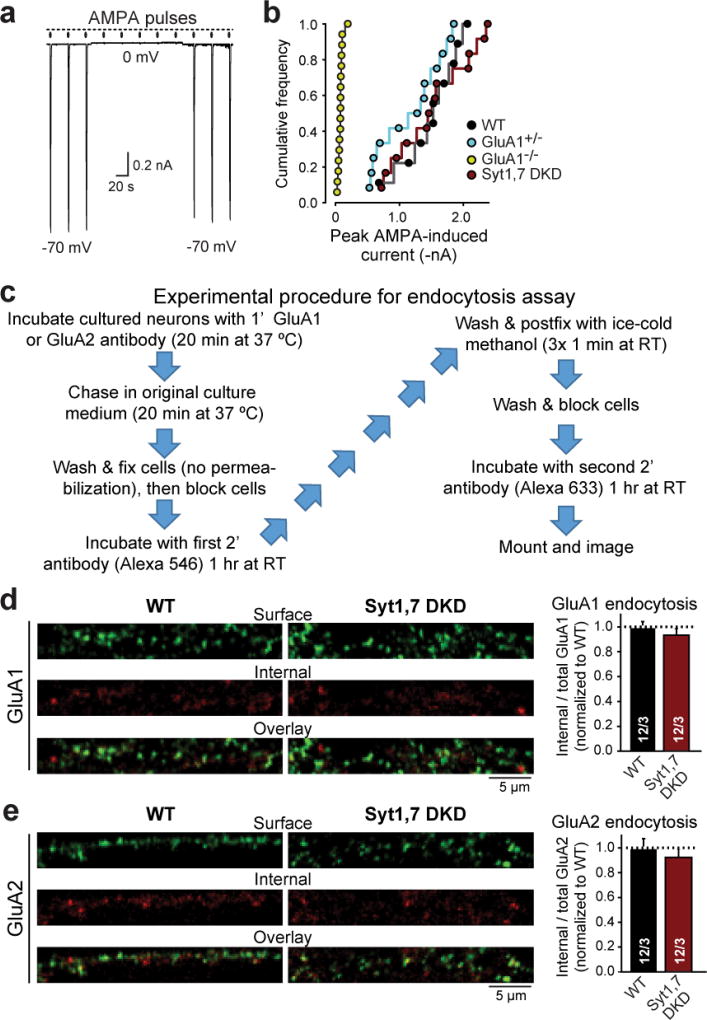
As a further alternative explanation of our results, we asked whether the postsynaptic Syt1,7 deficiency could block LTP by reducing delivery of extrasynaptic AMPARs without decreasing synaptic AMPARs, as observed after genetic deletion of the AMPAR subunit GluA110,27. To test this hypothesis, we pulled nucleated somatic outside-out patches from CA1 neurons in acute slices, and measured currents induced by application of AMPA (Fig. 3c, d). We observed no change in AMPA-induced currents in Syt1,7 double-deficient neurons, but detected a massive decrease in homozygous GluA1 KO neurons as expected (Fig. 3e, ED Fig. 8a, b)10,27. Moreover, we analyzed immunocytochemical staining of surface GluA1 in cultured Syt1,7 double-deficient hippocampal neurons, using WT and GluA1 KO neurons as controls (Fig. 3f). Syt1,7 double-deficient neurons again exhibited no detectable change in extrasynaptic or synaptic surface GluA1 (as defined by co-localization with PSD95), whereas GluA1 KO neurons displayed a dramatic decrease in surface GluA1 receptors as expected (Fig. 3g). Thus, two different complementary assays demonstrate that the postsynaptic Syt1,7 deficiency does not cause a decrease in extrasynaptic AMPARs.
The normal levels of synaptic and extrasynaptic AMPARs in Syt1,7-deficient neurons show that either constitutive AMPAR exo- and endocytosis are normal, or that AMPAR exo- and endocytosis are both changed in parallel. To test the latter possibility, we analyzed the effect of the Syt1,7 double deficiency on the constitutive endocytosis of AMPARs, but detected no significant change (ED Fig. 8c–e). Thus, constitutive AMPAR trafficking is normal.
Syt1,7 loss impairs AMPAR exocytosis
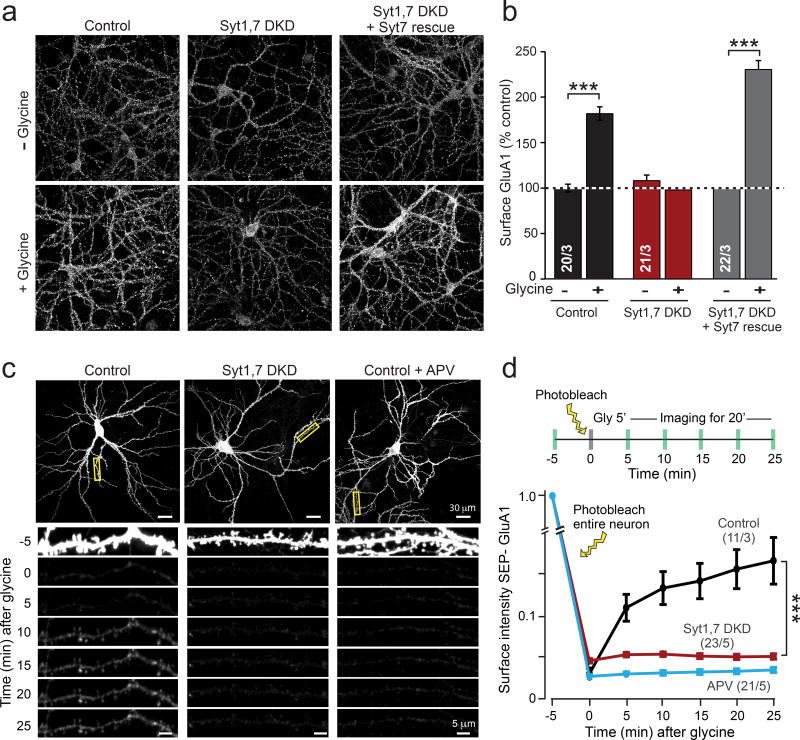
To further assess whether the Syt1,7 double deficiency blocks LTP-induced, Ca2+-triggered AMPAR exocytosis, we directly measured AMPAR exocytosis elicited by NMDAR activation in cultured hippocampal neurons, using a well-established chemical LTP (cLTP) protocol28,29. cLTP induction efficiently increased GluA1 surface levels in control neurons but not in Syt1,7 double-deficient neurons (Fig. 4a, b), confirming that the Syt1,7 deficiency impairs AMPAR exocytosis. Again, the block of cLTP by the Syt1,7 DKD was rescued by WT Syt7 (Fig. 4a, b).
Figure 4. Syt1,7 deficiency blocks AMPAR exocytosis during ‘chemical LTP’ in cultured hippocampal neurons.
a & b, Representative images (a) and summary graphs (b) of GluA1 surface immunostaining as a function of chemical LTP (cLTP) induced by glycine.
c & d, Representative images (c) and summary graph (d) of live-cell SEP-GluA1 fluorescence in hippocampal control neurons expressing transfected SEP-GluA1, imaged before and after cLTP induction with glycine.
Data in b and d are means ± SEM (numbers in bars = number of neurons/independent cultures analyzed). Statistical significance was assessed by Mann-Whitney U test (b) or two-way ANOVA (d; ***p < 0.05).
It is formally possible that the NMDAR-dependent increase in surface GluA1 during cLTP could be due to clustering of pre-existing, diffuse surface GluA1-containing AMPARs, rendering them more detectable by immunocytochemistry, and that thus the Syt1,7 deficiency impairs AMPAR clustering instead of AMPAR exocytosis. To directly test this possibility, we visualized AMPAR exocytosis in real time by combining cLTP with live-cell imaging of neurons overexpressing SEP-GluA19,30,31. In SEP-GluA1, the extracellular N-terminus of GluA1 is fused with a superecliptic-phluorin (SEP), a pH-sensitive GFP that becomes fluorescent when exposed to the extracellular milieu, but not when it is within an acidic intracellular trafficking vesicle. To eliminate the possibility that cLTP increased detection of pre-existing surface SEP-GluA1 due to clustering, we photobleached all surface SEP-GluA1 before inducing cLTP (Fig. 4c, d). In control cells, subsequent cLTP induction significantly increased SEP-GluA1 fluorescence for the 25 min duration of the experiment; this increase was blocked by the NMDAR antagonist APV (Fig. 4c, d). Strikingly, the Syt1,7 deficiency almost abolished this increase (Fig. 4c, d). Thus, Syt1 and Syt7 are redundantly required for regulated AMPAR exocytosis.
Probing Ca2+-triggered exocytosis
Do Syt1 and Syt7 function in postsynaptic AMPAR exocytosis as actual Ca2+-sensors, or as Ca2+-independent trafficking proteins? This question arises because in presynaptic vesicle exocytosis, Syt1 and Syt7 act both as Ca2+-sensors and as priming factors11,14–17. The lack of LTP rescue by the Ca2+-binding mutant Syt7-C2A* supports the Ca2+-sensor hypothesis (Fig. 2b). To test this conclusion, we sought to develop tools that could differentiate between the priming vs. Ca2+-triggering functions of synaptotagmins.
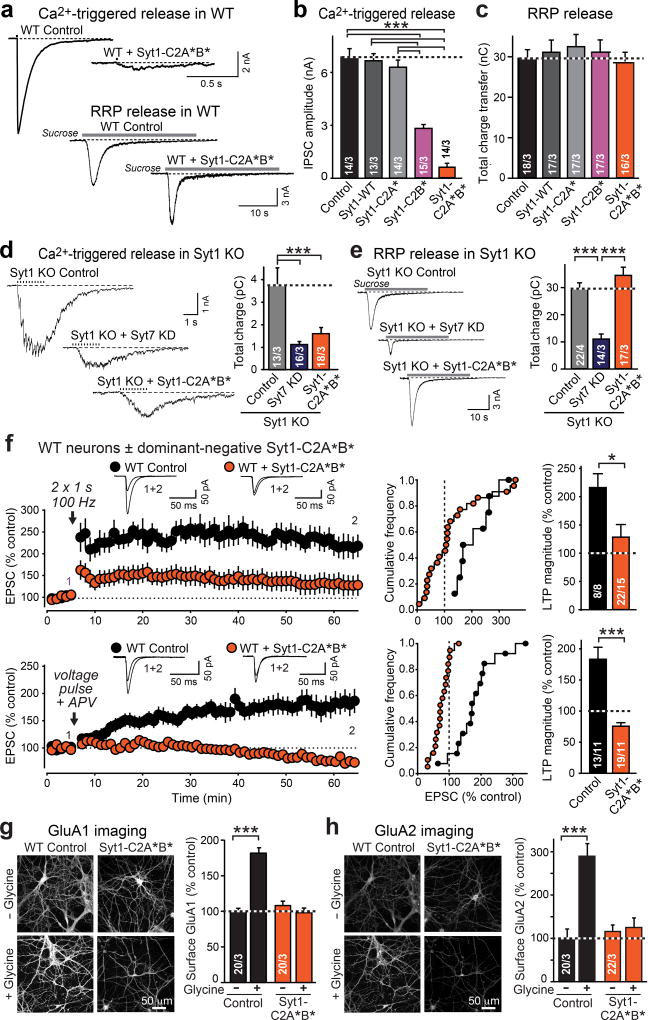
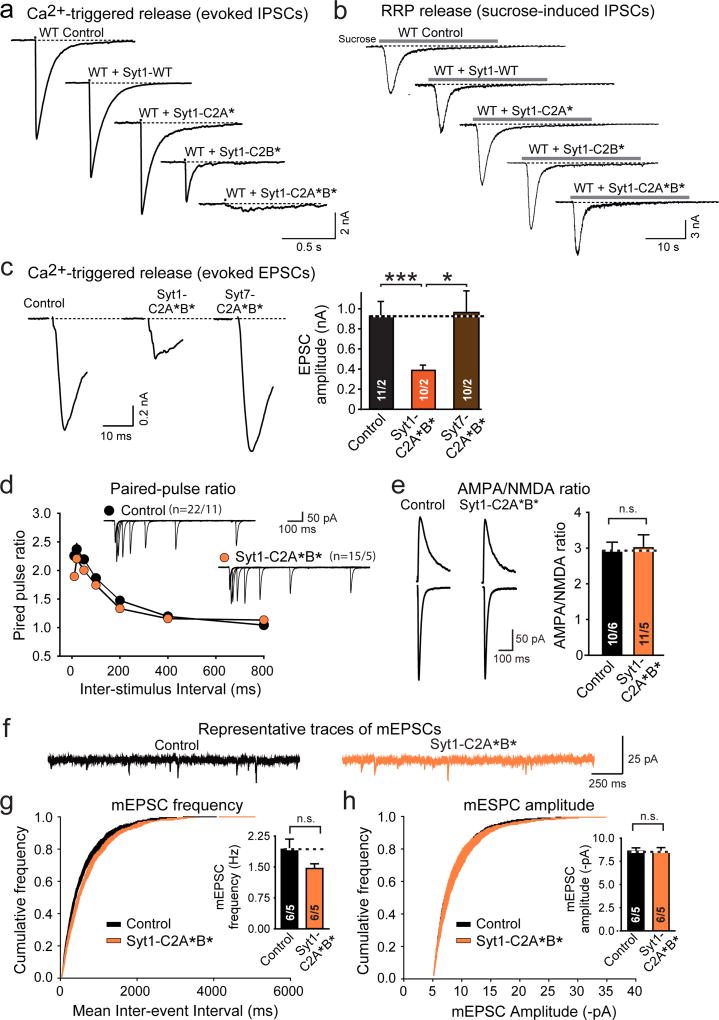
In Drosophila, Ca2+-binding site mutants of Syt1 are dominant-negative inhibitors of neurotransmitter release32. We examined whether this observation applies to mammals using mutant Syt1 with inactivating substitutions in the Ca2+-binding sites of the C2A-(Syt1-C2A*) or C2B-domain (Syt1-C2B*), or of both (Syt1-C2A*B*). In cultured WT hippocampal neurons, Syt1-C2B* robustly inhibited release, whereas Syt1-C2A* had no effect (Fig. 5a, b; ED Fig. 9a). The Syt1-C2A*B* double mutation enhanced its dominant-negative inhibition of release, suggesting that both C2-domains contribute (Fig. 5a, b). Syt1-C2A*B* blocked release at both excitatory and inhibitory synapses (Fig. 5a, b; ED Fig. 9a, c). The Syt1 mutants, however, did not impair Ca2+-independent vesicle exocytosis induced by hypertonic sucrose, which stimulates Ca2+-independent exocytosis of all primed synaptic vesicles33 (Fig. 5c; ED Fig. 9b).
Figure 5. Dominant-negative mutant Syt1 impairs presynaptic Ca2+-induced vesicle exocytosis and postsynaptic LTP-induced AMPAR exocytosis.
a–c. Effect of Syt1 with Ca2+-binding-site mutations in the C2A-domain (Syt1-C2A*), the C2B-domain (Syt1-C2B*), or both (Syt1C2A*B*) on IPSCs triggered by action potentials or by hypertonic sucrose in cultured hippocampal WT neurons (a, representative traces; b & c, summary graphs; for EPSCs, see ED Fig. 9a, b).
d & e. Comparative effect of the Syt7 KD vs. the dominant-negative Syt1-C2A*B* mutant on asynchronous IPSCs induced by a 1 s, 10 Hz stimulus train [d] or a 30 s application of 0.5 M sucrose [e] in cultured hippocampal Syt1 KO neurons.
f. Dominant-negative Syt1-C2A*B* mutant suppresses LTP in acute hippocampal slices (top, NMDAR-dependent LTP; bottom, voltage-pulse LTP in the presence of 50 µM APV). Experiments were performed as for Figs. 1 and 2.
g & h, Dominant-negative Syt1-C2A*B* suppresses cLTP in cultured WT hippocampal neurons. Representative images (left) and summary graphs (right) of neurons without or with glycine induction of cLTP that were surface-labeled for GluA1 (h) or GluA2 (i).
Data are means ± SEM (numbers in bars = number of neurons/independent cultures or neurons/mice analyzed). Statistical significance was assessed by Kruskal-Wallis ANOVA followed by the Mann-Whitney U test (b–e; ***, p<0.001) of only the Mann-Whitney U test (f–h; *p < 0.05; ***p < 0.001).
Strikingly, dominant-negative Syt1-C2A*B* suppressed not only synchronous release in WT synapses, but also asynchronous release that remains in Syt1 KO neurons and is ablated by additional deletion of Syt7 (Fig. 5d). Thus, Syt1-C2A*B* blocks both Syt1 and Syt7 function. However, inhibiting Syt7 expression in Syt1 KO neurons additionally decreased Ca2+-independent release induced by hypertonic sucrose17, whereas dominant-negative Syt1-C2A*B* had no effect on sucrose-induced release in Syt1 KO neurons (Fig. 5e). Thus, Syt1-C2A*B* is a dominant-negative inhibitor of Ca2+-dependent but not of Ca2+-independent synaptotagmin functions, rendering it a suitable tool to deconstruct the role of Syt1 and Syt7 in regulated AMPAR exocytosis.
Syt1-C2A*B* blocks LTP
We sparsely expressed dominant-negative Syt1-C2A*B* in CA1 WT neurons in vivo, and measured NMDAR-dependent LTP and voltage-pulse LTP in acute slices. Syt1-C2A*B* potently blocked both forms of LTP (Fig. 5f), but had no major effect on parameters of basal excitatory synaptic transmission, such as PPR, AMPAR/NMDAR ratio, mEPSC frequency, and mEPSC amplitude (ED Fig. 9d–h).
These results indicate that Syt1 and Syt7 perform an essential Ca2+-sensor function in AMPAR exocytosis during LTP. To independently test this conclusion with yet another approach, we examined the effect of dominant-negative Syt1-C2A*B* in cultured WT hippocampal neurons on cLTP, and monitored surface GluA1 and GluA2 levels (Fig. 5g, h). As expected, induction of cLTP dramatically increased both GluA1 and GluA2 surface levels in control neurons. In marked contrast, dominant-negative Syt1-C2A*B* completely blocked the increases in GluA1 and GluA2 surface levels during cLTP, but had no effect on steady-state surface levels of GluA1 or GluA2 (Fig. 5g, h). Thus, selectively blocking the Ca2+-sensor function of Syt1 and Syt7 using dominant-negative Syt1-C2A*B* blocks LTP-induced AMPAR exocytosis in slices and in cultured neurons.
Summary
Using multiple in vivo and in vitro manipulations of postsynaptic Syt1 and Syt7, we show that NMDAR-dependent LTP requires Syt1 or Syt7 as functionally redundant Ca2+-sensors for AMPAR exocytosis (ED Fig. 1, 10). Our results imply that Ca2+-triggered AMPAR exocytosis is a critical step in LTP and that Ca2+-regulated membrane traffic is governed by similar mechanisms in pre- and postsynaptic compartments, revealing a surprisingly economical organization of synapses. Two independent lines of evidence show that Syt1 and Syt7 act as Ca2+-sensors for AMPAR exocytosis during LTP. First, a mutation in Syt7 that abolishes Ca2+-binding but does not produce a dominant-negative effect fails to rescue LTP (Fig. 2b). Second, a mutation in Syt1 that abolishes Ca2+-binding and does render it dominant-negative for Ca2+-triggering but not for Ca2+-independent exocytosis also blocks LTP (Fig. 5). CaM-Kinase IIα, which is activated by Ca2+, is also essential for LTP34–36, raising the question of how Ca2+-sensing synaptotagmins and CaM-Kinase IIα collaborate in LTP. Several mechanisms are conceivable, for example activation of exocytosis by CaM-Kinase IIα, possibly via phosphorylation of Syt1 and Syt737,38, or a role for CaM-Kinase IIα in stably capturing AMPARs in postsynaptic sites39,40. It seems likely that Ca2+-induced AMPAR exocytosis during LTP is perisynaptic, with subsequent lateral diffusion of perisynaptic AMPARs into the postsynaptic density3,8 but direct exocytosis of AMPAR vesicles into the postsynaptic membrane cannot at present be excluded.
The unexpected discovery of a critical role of postsynaptic synaptotagmins as Ca2+-sensors for LTP provides a new avenue to the understanding of synaptic plasticity. Showing that pre- and postsynaptic mechanisms share critical features renders LTP a simple and economical process, as would be expected for a universal mechanism involved in circuit plasticity.
METHODS
Mice
All mouse lines used here (CD1, Syt7KO, Syt1cKO, GluA1KO, Syt1KO, Nrxn1-HA KI) except for 7SF (which was found to be a constitutive Syt7 KO; see ED Fig. 3d–f) were reported previously14,16,20,27. Experiments in Fig. 2c, 3a, 3b and ED Fig 7a–d used 7SF; experiments in ED Fig. 3c used our previously reported Syt7 KO mice. Mice were bred using standard procedures, and are deposited at Jackson Labs. All animal experiments were evaluated and approved by the Stanford University Administrative Panel on Laboratory Animal Care.
Plasmid constructs, and viruses
An overview of the plasmids used is present in ED Fig. 2. All plasmids, including the Syt1 and Syt7 KD lentiviral vectors used were also described previously16,17,19,20. The following oligonucleotide sequences were used for KDs: Syt7 KD606 AAAGACAAGCGGGTAGAGAAA, KD607 GATCTACCTGTCCTGGAAGAG, Syt1 GAGCAAATCCAGAAAGTGCAA. AAV-DJ viruses and lentiviruses were prepared as described16,17,19.
The Syt7 Ca2+-binding site mutant Syt7-C2A* contains the following mutations: D225A, D227A, and D233A42. The Syt1 Ca2+-binding site mutants contain the following mutations: Syt1-C2A*, D178A, D230A, and D232A; Syt1-C2B*, D309A, D363A, and D365A; Syt1-C2A*B*, a combination of all Syt1 mutations43.
In vivo stereotactic injections
Mice (male, aged P18–P22; weight 8–12 g) were anesthetized with a mixture of ketamine (75 mg/kg body weight) and dexmedetomidine (0.375 mg/kg body weight) by intraperitoneal injection. Mice were immobilized on a Kopf stereotaxic apparatus and small bilateral holes were drilled into the skull at −1.8 mm posterior and −1.5 mm lateral to bregma for injection into the hippocampal CA1 region. Glass cannulae filled with viral solution were lowered to a depth of 1.35 mm (from the dura), and viral medium (0.6 µl) was injected using a microinjection pump (Harvard Apparatus) at a flow rate of 0.1 µl/min sequentially into each hemisphere. The scalp was then sealed and atipamezole (10 mg/kg body weight) was injected by intraperitoneal injection to reverse the effect of dexmedetomidine. Animals were monitored as they recovered from anesthesia.
Acute slice electrophysiology
20–36 days following in vivo virus injections, mice were anesthetized with isoflurane, their brains were rapidly removed and placed in ice-cold, high sucrose cutting solution containing (in mM): 75 sucrose, 85 NaCl, 24 NaHCO3, 25 glucose, 2.5 KCl, 1.25 NaH2PO4, 4 MgCl2 and 0.5 CaCl2. Slices were sectioned on a Leica vibratome in high-sucrose cutting solution, and immediately transferred to an incubation chamber with artificial cerebrospinal fluid (ACSF) containing (in mM) 117.5 NaCl, 26.2 NaHCO3, 11 glucose, 2.5 KCl, 1 NaH2PO4, 1.3 MgSO4 and 2.5 CaCl2. Slices were allowed to recover at 32°C for 30 min before equilibration at room temperature for a further 1 h. During recordings, slices were placed in a recording chamber perfused with heated ACSF (28–30°C) and gassed continuously with 95% O2 and 5% CO2. All slice recordings were obtained with picrotoxin (50 µM) in the ACSF. Whole-cell recording pipettes (3–4 MΩ) were filled with a solution containing (in mM) 135 CsMeSO4, 8 NaCl, 10 HEPES-NaOH pH 7.3, 0.25 EGTA, 2 MgCl2, 4 Mg2ATP, 0.3 Na3GTP, and 5 phosphocreatine (osmolarity 300). Data were collected with a MultiClamp 700B amplifier (Molecular Devices) and digitized at 10 kHz using the Digidata 1322A data acquisition system (Molecular Devices), and analyzed using a custom program written with Igor Pro software (Wavemetrics) or Clampex/Clampfit (Molecular Devices). The frequency, duration, and magnitude of the extracellular stimulus were controlled with a Model 2100 Isolated Pulse Stimulator (A–M Systems). Evoked synaptic responses were triggered with a bipolar electrode.
LTP, voltage-pulse LTP, and LTD
CA1 pyramidal cells were visualized by infrared DIC, and GFP positive neurons were identified by epifluorescence. A bipolar stimulation electrode was placed in stratum radiatum to evoke EPSCs in CA1 pyramidal cells. Cells were held at −70 mV to record AMPAR EPSCs while stimulating afferent inputs at 0.1 Hz. LTP was induced by 2 trains of high frequency stimulation (100 Hz, 1 s) separated by 20 s with the patched cells depolarized to −10 mV. This induction protocol was always applied within 10 min of achieving whole-cell configuration to avoid “wash-out” of LTP. For voltage-pulse LTP, cells were depolarized 20 times from −70 mV to +10 mV for 1 s in the absence of stimulation but in the presence of APV. To induce LTD, cells were held at −45 mV and 1 train of low frequency stimulation (1 Hz, 400 s) was applied. To generate summary graphs, individual experiments were normalized to the baseline and 6 consecutive responses were averaged to generate 1 min bins. These were then averaged again to generate the final summary graphs. The magnitude of LTP and LTD was calculated based on the averaged EPSC values during the last 5 min of the LTP and LTD summary graphs.
Dual cell recordings
Neighboring infected and uninfected pairs of pyramidal cells were recorded simultaneously in CA1 with Schaffer collateral stimulation. The AMPAR/NMDAR ratio was calculated as the peak averaged AMPAR EPSC (30–50 consecutive events) at −70 mV divided by the averaged NMDAR EPSCs (20–40 consecutive events) measured at 50 ms after the onset of the dual component EPSC at +40 mV.
Miniature EPSCs
AMPAR mEPSCs were recorded in the presence of TTX (0.5 µM) holding the cells at −70 mV (detection threshold = 5 pA). The averaged mEPSC amplitude/frequency for each cell was calculated by collecting all mEPSCs recorded during the initial 5 minute period after whole-cell access with a stable series resistance (10–15 MΩ) was obtained. For the cumulative probability plots of mEPSC amplitude and frequency, the first 200 mEPSCs from each cell were included.
Nucleated outside-out patch recordings
Outside-out patches were pulled from the soma of hippocampal CA1 pyramidal neurons, and held at −70 mV. 10 µM of s-AMPA was applied to the patches using a Picospritzer II (Parker Hannifin Corp.) in the presence of 100 µM cyclothiazide, 50 µM picrotoxin, 25 µM APV, 0.5 µM tetrodotoxin.
Controls for slice physiology experiments
For analysis of Syt1 and Syt7 KDs using AAV-expressed shRNAs (Fig. 1c), all viruses expressed GFP, and the control slices were from separately infected animals that expressed only GFP without an shRNA (ED Fig. 2). For the experiments in constitutive Syt7 KO with lentiviral Syt1 KD (ED Fig. 3c), controls were from separately infected animals that were injected with a lentivirus expressing GFP only. These sets of experiments were done blindly. For analysis of Syt1 and Syt7 KD using lentivirally expressed shRNAs, conditional Syt1 KO experiments using lentivirally expressed Cre-recombinase, and lentiviral overexpression of the dominant negative Syt1-C2A*B* (Figs. 1d, 2a–d, 3a–g, 5d, 5e; ED Fig. 3b, 6, 7, 9-h), controls were recorded from uninfected nearby cells in the same animals and slices as the KDs.
Dissociated hippocampal culture electrophysiology
Cultures of hippocampal neurons were produced from wild-type, Syt1 KO, and Syt7 KO mice, and used for recording at 14–16 DIV essentially as described16,17, 44,45. Recordings were done blindly.
Organotypic cultures and recordings from cultured hippocampal slices
Organotypic slice cultures were prepared from young Syt1cKO/Syt7 KO mice (postnatal day 6 to 7) and placed on semiporous membranes (Milipore) for 5 to 7 days prior to recording25,46. Voltage-clamp whole-cell recordings were obtained from CA1 pyramidal neurons treated with either vehicle controls, 10 µM CNQX (for 36 hours prior to recording), or 10 µM RA (for 4 hours prior to recording), under visual guidance using transmitted light illumination. Tests and controls were from the same batches of slices on the same experimental day, and analyzed as described25. CNQX- or RA-treated slices were washed out prior to recording evoked responses.
Chemical LTP (cLTP) assay and immunocytochemistry
18–21 DIV (9–11 days post-infection) hippocampal cultures were thoroughly washed with extracellular solution (ECS) containing (in mM): 150 NaCl, 2 CaCl2, 5 KCl, 10 HEPES pH 7.4, 30 glucose, 0.001 TTX, 0.01 strychnine, 0.03 picrotoxin. cLTP: Neurons were incubated without or with 0.3 mM glycine at room temperature for 3 min in ECS, and then for another 20–25 min in ECS without glycine at 37 °C. Neurons were fixed with 4% paraformaldehyde for 15 min on ice, which does not permeabilize the cells. Surface AMPARs were labeled for 1 hr at 37°C with a polyclonal rabbit primary antibody to an N-terminal extracellular epitope of GluA1 (Calbiochem) or a mouse monoclonal antibody against an extracellular epitope of GluA2 (MAB397, EMD Millipore), washed multiple times with PBS, and reacted for 1 hr at 37°C with appropriate secondary antibodies. Confocal stacks were obtained for 6–12 individual fields from multiple coverslips per culture with a 60× 1.4 NA oil-immersion objective mounted on a Nikon A1 laser-scanning confocal microscope. Three independent cultures that included control, non-stimulated coverslips and glycine-treated coverslips were examined for each manipulation.
GluA1 synaptic and extrasynaptic levels
WT and GluA1-KO cultured neurons were infected with GFP- expressing lentivirus with or without shRNAs at DIV8, and fixed at DIV18–21 in 4% paraformaldehyde/4% sucrose for 15 min on ice (no permeabilization). Surface GluA1 AMPARs were labeled using a polyclonal rabbit primary antibody to an N-terminal extracellular epitope of GluA1 (Calbiochem) and visualized with anti-rabbit Alexa 568-conjugated secondary antibodies. After permeabilizing the cells with 0.1% Triton X-100 for 30 min at room temperature, a mouse monoclonal anti-PSD-95 antibody (Abcam 2723) was co-applied with anti-GFP antibody (raised in chicken; Aves Labs) followed by anti-mouse Alexa 647-conjugated and anti-chicken Alexa 488-conjugated secondary antibodies respectively. Primary and subsequently secondary antibodies were incubated with cells at 37 °C for 1 hr spaced with multiple PBS washes. For image acquisition, coverslips were mounted on glass slides in Fluoromount-G (Southern Biotech). Confocal stacks were obtained in 3-color channels for 6–12 individual fields from multiple coverslips per culture (3 cultures) preparation with a 60× 1.4 NA oil-immersion objective mounted on a Nikon A1 laser-scanning confocal microscope. Imaging and analyses were performed using raw images without knowledge of the experimental manipulation that had been performed. Confocal images were acquired maintaining Nyquist criteria for digital microscopy. A maximum intensity Z-projection was obtained from each confocal image stack using custom Nikon software and quantitative image analysis was performed on these images; non-induced control cells from the same culture were used as baseline to comparisons. Total dendritic surface AMPARs in a field were determined by calculating the total number of pixels enriched in AMPARs above an arbitrary threshold value that was kept constant for all images from that culture preparation and that was selected by visual inspection of images from non-induced control cells using ImageJ (W.S. Rasband, ImageJ, U. S. National Institutes of Health, Bethesda, Maryland, USA, http://rsb.info.nih.gov/ij/, 1997–2009). This value was divided by the total surface area calculated using a lower threshold value that captured the entire dendritic arbor and that was again kept constant for all images from a culture preparation. To calculate changes in AMPAR surface expression following experimental manipulations, AMPAR surface expression values for each image were normalized to the average value obtained from non-treated control cells for each individual culture preparation. Image thresholds, area measurement and numerical calculations were performed using software developed in Matlab (The MathWorks, Inc.). To identify synaptic and extrasynaptic fraction of GluA1 staining, Z-projection was obtained from three individual color images of 50 µm dendritic segments. Total area and synaptic area masks were created by applying threshold values to GFP and PSD95 images respectively. Then, extrasynaptic area mask was obtained by subtracting the synaptic area from the total area mask image. These two masks, synaptic and extrasynaptic, were then applied to the GluA1 image to extract average intensity of GluA1 staining on GluA1-WT, Syt1,7 DKD and GluA1-KO dendritic segments.
V5-tagged Syt1 and Syt7 immunocytochemistry
WT cultured neurons were transfected at DIV7 using Ca2+-phosphate with constructs expressing either V5-tagged Syt1 or Syt7 and EGFP. Cells were fixed at DIV14–16 in 4% paraformaldehyde/4% sucrose for 15 min and permeabilized with 0.1% Triton X-100 for 20 min at room temperature. Coverslips were incubated in primary antibodies against V5 (rabbit, V8137, Sigma), MAP2 (mouse, M1406, Sigma), and VGluT1 (guinea pig, ab5905, Millipore) and secondary antibodies anti-mouse AlexaFluor405, anti-rabbit AlexaFluor546, and anti-guinea pig AlexFluor633. Primary and subsequently secondary antibodies were incubated with cells at 37 °C for 1 hr spaced with multiple PBS washes. For image acquisition, coverslips were mounted on glass slides in Fluoromount-G (Southern Biotech). Confocal stacks were obtained in 4-color channels with a 60× 1.4 NA oil-immersion objective.
Endocytosis assay
AMPAR internalization assays were essentially performed as described47. After 14–16 days in vitro, cultured hippocampal neurons were labeled at 37°C for 20 min with a primary antibody against an extracellular epitope of GluA1 (Calbiochem) or GluA2 (MAB397, Millipore) to allow labeling of surface AMPARs. Cells were washed in PBS, then incubated at 37°C with neuron growth media for 20 min to allow for basal internalization. Cells were then washed and fixed with 4% PFA/4% sucrose, blocked in a detergent-free blocking solution for 1 hr, followed by incubation with AlexaFluor546 secondary antibody at room temperature for 1 hr to label surface receptors. Neurons were then postfixed with 100% methanol at −20°C, blocked for 1 hr, and incubated with an AlexaFluor633 secondary antibody at room temperature for 1 hr to label the internalized AMPAR fraction. Fluorescent images were acquired at room temperature with a Nikon A1 laser-scanning confocal microscope using a 60× 1.4 NA oil-immersion objective. Within the same experiment, the same settings for laser power, PMT gain, and offset were used. Digital images were taken using Nikon NIS-Elements imaging software. Data shown represent the average of the mean values from at least 3 independent experiments. To calculate internalization, the integrated red fluorescence intensity, identifying internalized GluA1, was divided by the total (red + green) intensity and normalized to the averaged WT levels.
Glycine treatment on live cells after photobleaching
Hippocampal cultures at DIV7–8 were transfected using Ca2+-phosphate with SEP-GluA1 constructs with or without shRNAs. Live cells on coverslip (18–21 DIV) were thoroughly washed and mounted in a live imaging chamber with extracellular solution (ECS) at 37°C. First, a Z-stack image of an entire transfected neuron was obtained with a 40× 1.3 NA oil-immersion objective mounted on a Nikon A1 laser-scanning confocal microscope. High laser power was used to scan and bleach the whole cell. Immediately after bleaching, another Z-stack image was taken to ensure a > 95% reduction of surface fluorescence intensity. 500 µM glycine in ECS was perfused into the chamber for 3–4 min to induce the cLTP, followed by ECS (no glycine) perfusion at 37°C for 20 min. A series of Z-stack images was obtained after induction at the 5 min interval in order to capture recovery of fluorescence. Z-projections were obtained from each time point using Nikon’s maximum intensity projection method. Images multiple time points were then stacked as time series in ImageJ. Dendritic segments (50 µm) were used for quantification of fluorescence intensity emitted from SEP-GluA1 expressed at the cell surface. A mask of a dendritic segment was created using the first image (pre-bleach) of the time series and then applied on all images to extract total intensity under the same mask for all three different conditions. Each intensity value was normalized with respect to the initial intensity and means ± SEMs graph plot was made in MS Excel for presentation.
qPCR
For mRNA measurements of cultured neurons, RNA was isolated at DIV14 using the RNAqueous kit (Ambion). RT-PCR reactions were set up in duplicates for each condition (150 ng total RNA) using the LightCycler 480 reagent kit (Roche), gene-specific primers (Roche), and a 7900HT Fast RT-PCR instrument (Applied Biosystems) with GAPDH as internal control.
Immunoblotting
Whole brains were homogenized in PBS with 0.3% Triton X-100 and protease inhibitor cocktail. Lysates were centrifuged at 14,000 rpm at 4°C for 15 min. 20 µl of supernatant was added to sample buffer and loaded onto a 10% SDS-containing polyacrylamide gel and run at 120 V for 1 hr. Proteins on the gel was transferred to a nitrocellulose membrane and incubated in 5% milk blocking solution for 1 hr, incubated in 1:1000 dilution of primary antibody overnight (Syt7: rabbit S757 Sysy, HA: rat 3F10 Roche, VCP: rabbit K331, actin: mouse a1978 Sigma), and incubated in 1:10,000 dilution of secondary antibody conjugated to fluorescent probes for 1 hr. Proteins were visualized using the Licor Odyssey CLx system.
Data analyses and statistics
Electrophysiology data were analyzed with either a custom program written with Igor Pro software (Wavemetrics), MiniAnalysis (Synaptosoft), or Clampfit (Molecular Devices). Statistical significance was assessed by Mann-Whitney U test for all pairwise comparisons with the exception of simultaneous dual cell recordings for which Wilcoxon signed rank test was used to test for significance. Two-way ANOVA was used for the SEP-GluA1 experiment in Fig. 4d. For all other experiments with three or more groups, statistical significance was assessed with Kruskal-Wallis ANOVA; when significant differences were observed, pairwise comparisons were assessed by Mann-Whitney U test (*, p<0.05; **, p<0.01; ***, p<0.001).
Data availability statement (DAS)
All relevant data are included with the manuscript as source data or Supplementary Information.
Extended Data
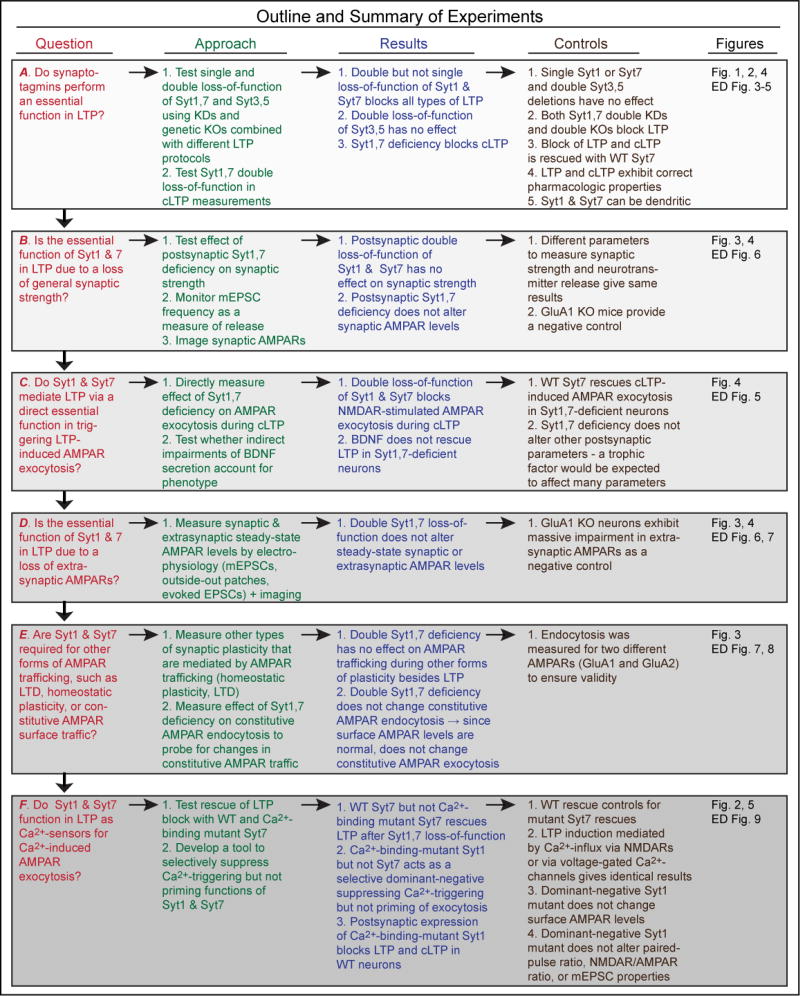
Extended Data Figure 1. Overview of experimental questions, approaches, results and controls.
The diagram organizes the goals of the present study into 6 logically connected questions labeled A–F, and provides an overview of the experimental approaches, results, and controls.
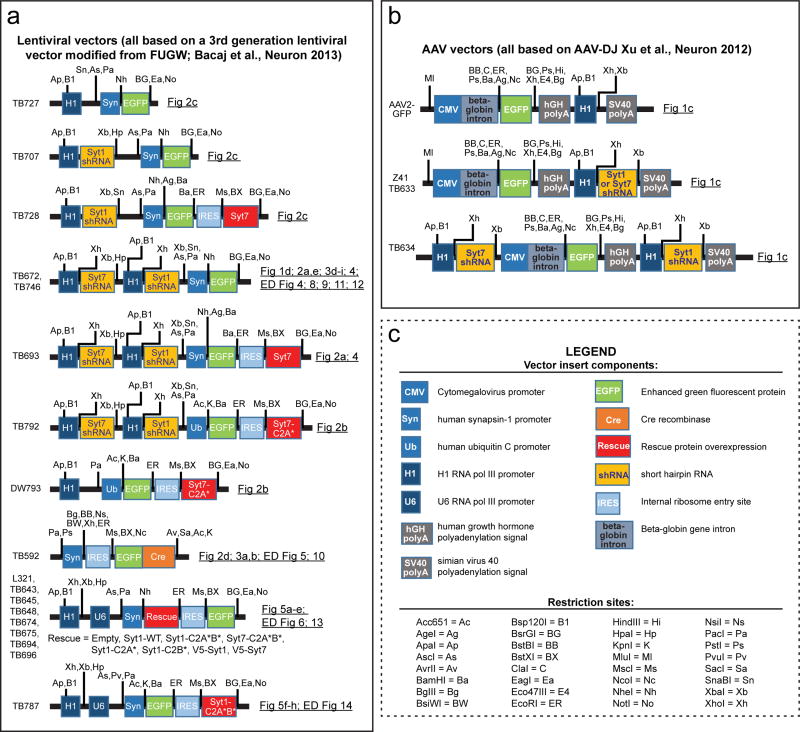
Extended Data Figure 2. Schematic overview of all viral vectors used in the current study.
a, Lentiviral vectors used. Vector names are listed on the left. Backbones are indicated with various insert elements in colored boxes; promoters and encoded sequences (shRNAs or cDNAs) are color-coded. Key restriction enzyme sites are shown for mapping and cloning purposes. Figures describing the experiments in which these vectors are used are listed on the right. Drawings are not to scale. Most vectors were described in refs. 16, 17, and 19.
b, Same as a, but for AAV vectors.
c, Legend of vector components and restriction sites found in a and b.
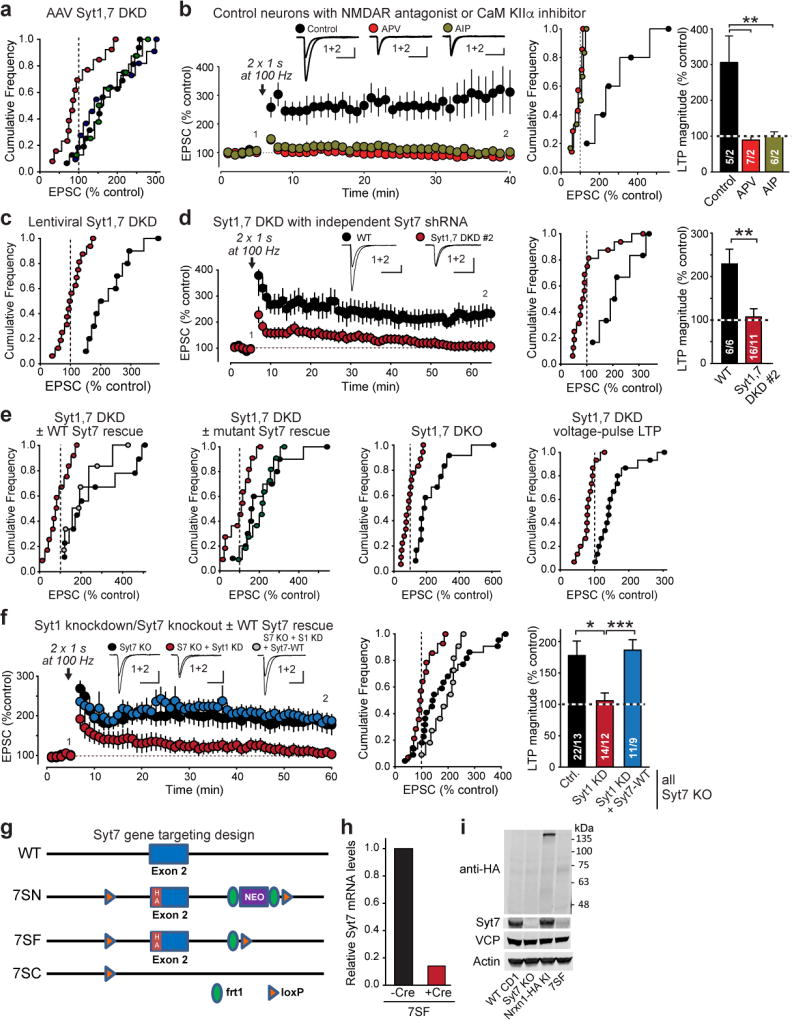
Extended Data Figure 3. Control experiments for LTP measurements, and characterization of a new Syt7 mutant mouse.
a, Cumulative frequency plots of LTP magnitude for acute slices from AAV-infected mice expressing control (black), Syt1 KD (green), Syt7 KD (blue) or Syt1,7 DKD virus (red). Data are from Fig. 1b.
b, APV (50 µM) in the extracellular solution or AIP (autocamide-2-related inhibitory peptide, 20 µM included in the pipette solution) impair LTP. Left, representative traces and LTP time course; center and right, cumulative frequency plots and summary graphs of LTP magnitude.
c, Cumulative frequency plots of LTP magnitude for acute slices from lentivirally infected mice expressing control (black) or Syt1,7 DKD virus (red). Data are from Fig. 1c.
d, Lentiviral in vivo Syt1,7 DKD with a second, independent shRNA against Syt7 impairs LTP.
e, Cumulative frequency plots of LTP magnitude for the experiments shown in Fig. 2a–d. In addl experiments, black and red denote the control and Syt1,7 double-deficiency condition; blue and green signify rescue with WT Syt7 or Syt7 C2A-domain mutant, respectively.
f, LTP is blocked by postsynaptic KD of Syt1 in constitutive Syt7 KO mice, but rescued by WT shRNA-resistant Syt7.
g, Schematic showing design of the new Syt7 mutant alleles. Using homologous recombination, exon 2 of the mouse Syt7 gene that encodes the transmembrane region was modified to introduce an HA-tag into the Syt7 protein N-terminal to the transmembrane region; in addition, a loxP site was introduced into the 5’ intron, and a neomycin resistance cassette (NEO) that was flanked by frt1 sites and was followed by a second loxP site was introduced in the 3’ intron. The initial mouse mutant was named 7SN; FLP recombination removed the NEO cassette to produce strain 7SF that per design should have expressed HA-tagged Syt7 but failed to do so (see panel f). 7SF at the same time was designed to also serve as a conditional KO (cKO) in which Cre recombination deletes exon 2 to produce mouse strain 7SC, which represents a true constitutive Syt7 KO since exon 2 is out-of-frame and encodes the vital transmembrane region.
h, Lentiviral Cre expression in cultured hippocampal 7SF neurons reduced Syt7 mRNA levels by ~90%, demonstrating the 7SF neurons express Syt7 mRNA and that the 7SF locus is a conditional KO.
i, Immunoblotting of brain homogenates from adult mice with the indicated genotypes using antibodies to the HA epitope, Syt7, VCP, or actin (the latter two as loading controls) shows that 7SF does not express Syt7 protein. Neither HA antibodies nor Syt7 antibodies detected Syt7 protein in 7SF mice designed to express HA-tagged but otherwise normal Syt7 (see panel d). Immunoblots of proteins from wild-type CD1 mice and for another strain of Syt7 KO mice were included as positive and negative controls for Syt7, respectively; immunoblots of Nrxn1-HA knockin mice (unpublished) were used as a positive control for the HA-epitope immunoblot. Molecular weight markers indicated on right. For gel source data, see Supplementary Figure 1.
Data are means ± SEM (numbers in bars = number of neurons/mice analyzed). Statistical significance was assessed in a, c with Kruskal-Wallis ANOVA followed by pairwise comparisons with the Mann-Whitney U test, and in b by the Mann-Whitney U test (*, p<0.05; **, p<0.01; ***, p<0.001). Calibration bars = 50 pA, 50 ms for a–c.
Extended Data Figure 4. Dendroaxonal localizations of Syt1 and Syt7 in cultured hippocampal neurons.
a, Representative image of a WT cultured hippocampal neuron transfected with a vector co-expressing V5-tagged Syt1 and GFP. Neurons were stained for V5 (red), MAP2 (blue), and VGluT1 (magenta) with GFP in green; image shows the merged staining for all four markers.
b, Enlarged images of a segment of the dendrite marked by a yellow box in a, illustrating the distribution of individual markers.
c & d, Same as a & b, but for V5-tagged Syt7.
Extended Data Figure 5. Double deletion of both Syt3 and Syt5 (Syt3,5 DKO) does not alter LTP and BDNF does not rescue the blocked LTP in Syt1,7 double-deficient neurons.
a, Field EPSPs (fEPSPs) recordings from heterozygous (Syt3,5 Het) and homozygous constitutive Syt3 and Syt5 double KO mice (Syt3,5 DKO). Left, representative traces and LTP time course; center and right, cumulative frequency plots and summary graphs of LTP magnitude.
b, LTP recordings were performed in Syt1,7 double knockdown cells from acute hippocampal slices as described for Fig. 1. BDNF (2 nM) was applied as indicated, following the general protocol of Patterson et al.32 Scale bars below sample EPSCs are 50 pA, 50 ms.
All data are means ± SEM; numbers in bars indicate number of neurons/mice analyzed.
Extended Data Figure 6. Postsynaptic Syt1,7 ablation does not impair basal synaptic transmission or alter short-term plasticity, and does not affect the amplitude or frequency of spontaneous mEPSCs in CA1-region pyramidal neurons.
a & b, Fluorescence image of a slice with patched adjacent non-fluorescent uninfected and fluorescent infected neurons (a), and schematic of simultaneous whole-cell recordings from uninfected and infected Syt1,7 DKD pyramidal neurons (b).
c, Syt1,7 DKD does not decrease NMDAR- and AMPAR-mediated synaptic transmission (left, representative AMPAR- and NMDAR-EPSCs; right, scatter plots of dual recordings; red crosses = means ± SEMs).
d, Normal AMPAR/NMDAR ratios in Syt1,7 DKD neurons (left, summary graphs of AMPAR- and NMDAR-mediated EPSCs; right, summary graphs of AMPAR/NMDAR ratios).
e, Syt1,7 DKD does not cause major changes in paired-pulse ratio (left, representative traces; right, summary plot of the paired-pulse ratio vs. inter-stimulus interval).
f–h, Lentiviral in vivo Syt1,7 DKD has no significant effect on the frequency and amplitude of spontaneous miniature excitatory postsynaptic currents (mEPSCs). Representative mEPSC traces are shown in f; cumulative plots and summary graphs of the mEPSC frequency are displayed in g, and cumulative plots of the inter-event interval and summary graphs of the mean mEPSC amplitude in h.
Data are means ± SEM (numbers in bars or graphs = number of neurons/mice analyzed; numbers for c also apply to d). Statistical significance in d was assessed by Wilcoxon signed rank test for normalized amplitude and Mann-Whitney U test for AMPAR/NMDAR ratios, and in g and h by Mann-Whitney U test. Statistical significance in e was assessed with Kruskal-Wallis ANOVA; significant differences were examined in pairwise comparisons by Mann-Whitney U test (***, p<0.001).
e, Representative traces showing that AMPA-puff-induced net current is blocked at a 0 mV holding potential.
f & g, Summary graph (f) and cumulative frequency plot (g) of the mean AMPA-puff-induced peak current amplitude.
Extended Data Figure 7. RA-dependent homeostatic plasticity and LTD are normal in Syt1,7 double-deficient neurons.
a, Representative traces of evoked AMPAR- and NMDAR-mediated EPSCs in dual recordings of infected Cre and uninfected adjacent neurons in the same cultured hippocampal slice that had been incubated for 36 hrs in DMSO and CNQX.
b, Summary graph of AMPAR-/NMDAR-ESPC ratios calculated from the EPSCs monitored in a.
c & d, Scatter plots of individual dual recordings of AMPAR- and NMDAR-EPSCs in Syt1,7 double KO and control neurons in slices that had been incubated DMSO or CNQX.
e, Syt1,7 DKD does not alter NMDAR-dependent LTD (left, representative traces and time course of LTD induced; center and right, cumulative frequency plots and summary graphs of the LTD magnitude).
All data are means ± SEM; numbers in bars indicate number of neurons/mice analyzed. Statistical significance was assessed by Mann-Whitney U test comparing test conditions to control (**, p<0.01).
Extended Data Figure 8. Measurements of GluA1 and GluA2 endocytosis in control and Syt1,7 double-deficient cultured hippocampal neurons.
a, Representative traces showing that AMPA-puff-induced net currents in nucleated outside-out patch are blocked at a 0 mV holding potential.
b, Cumulative frequency plot of the mean peak current amplitude induced by AMPA puffs in nucleated outside-out patches. Note that the only conditions that decreases such currents in all independent experiments is the homozygous GluA1 KO (GluA1−/−).
c, Experimental procedure flowchart for the endocytosis assay. See methods for detailed protocol.
d, Representative images of GluA1 endocytosis in control and Syt1,7 DKD neurons (left), and quantification of GluA1 endocytosis (right). Endocytosis was measured as the ratio of the internal GluA1 fraction (red) to the total GluA1 fraction (internal [red] + surface [green]), and was normalized to WT.
e, Same as b, but for GluA2.
All data are means ± SEM; numbers in bars indicate number of neurons/mice analyzed. Statistical significance was assessed by Mann-Whitney U test comparing test conditions to control (**, p<0.01).
Extended Data Figure 9. Presynaptic and postsynaptic expression of dominant negative Syt1-C2A*B*.
a & b, Action potential-evoked (a) and sucrose-induced IPSCs (b) from cultured hippocampal wild-type neurons infected with control lentiviruses or lentiviruses encoding the indicated Syt1 or Syt7 constructs. In culture, lentiviruses uniformly infect all neurons; thus, recordings reflect conditions in which lentiviruses had infected both pre- and postsynaptic cells.
c, Evoked EPSCs recorded in cultured wild-type neurons that were infected either with a control lentivirus or with lentiviruses encoding the equivalent mutants of Syt1 (Syt1-C2A*B*) or Syt7 (Syt7-C2A*B*). Note that only the Syt1 but not the Syt7 mutant is dominant negative (left, representative traces; right, summary graph of the EPSC amplitude).
d–h, In vivo expression of dominant negative Syt1-C2A*B* in postsynaptic neurons alone does not affect basal transmission. Postsynaptic overexpression of dominant-negative mutant Syt1-C2A*B* in a subset of CA1-region pyramidal neurons by stereotactic injection of lentiviruses does not cause a major change in paired-pulse ratios of AMPAR EPSCs at different inter-stimulus intervals (d), AMPAR/NMDAR-ratio (e), or frequency or amplitude of mEPSCs (f, sample traces; g, cumulative probability plot of the mEPSC inter-event interval with the summary graph of the mean frequency; h, cumulative probability plot of the mEPSC amplitude with the summary graph of the mean amplitude.
All data are means ± SEM; numbers in bars indicate number of neurons/mice analyzed. Statistical significance was assessed by Mann-Whitney U test (*, p<0.05; ***, p<0.001).
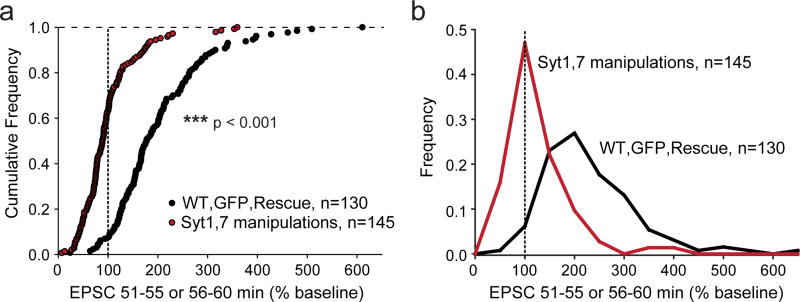
Extended Data Figure 10. Summary graphs of the combined effects of all Syt1,7 loss-of-function manipulations on postsynaptic LTP.
a, Cumulative data for all LTP and voltage-pulse LTP experiments. Control, GFP, and Syt7 rescue experiments are shown in black. Manipulations to both Syt1 and Syt7 by KD and KO as well as Syt1-C2A*B* overexpression experiments are shown in red. Statistical significance was assessed by Mann-Whitney U test (***p < 0.001) comparing test conditions to control. Dotted line represents the 100% mark corresponding to an absence of a change in synaptic strength as a function of LTP induction.
b, Normalized frequency of the same data in a grouped in bins of 50%.
Supplementary Material
Acknowledgments
This study was supported by grants from the NIH (P50 MH086403 to R.C.M., T.C.S. and L.C., and F32 MH100752 and K99 MH107618 to D.W.).
Footnotes
AUTHOR CONTRIBUTIONS
D.W., T.B., W.M., D.G., and K.L.A. performed the experiments; all authors planned the experiments, participated in data analyses, and wrote the paper.
COMPETING INTERESTS
The authors declare no competing interests or conflicts of interest.
References
- 1.Bliss TV, Collingridge GL. A synaptic model of memory: long-term potentiation in the hippocampus. Nature. 1993;361:31–39. doi: 10.1038/361031a0. [DOI] [PubMed] [Google Scholar]
- 2.Malenka RC, Bear MF. LTP and LTD: an embarrassment of riches. Neuron. 2004;44:5–21. doi: 10.1016/j.neuron.2004.09.012. [DOI] [PubMed] [Google Scholar]
- 3.Huganir RL, Nicoll RA. AMPARs and synaptic plasticity: the last 25 years. Neuron. 2013;80:704–17. doi: 10.1016/j.neuron.2013.10.025. [DOI] [PMC free article] [PubMed] [Google Scholar]
- 4.Morris RG. NMDA receptors and memory encoding. Neuropharmacology. 2013;74:32–40. doi: 10.1016/j.neuropharm.2013.04.014. [DOI] [PubMed] [Google Scholar]
- 5.Opazo P, Choquet D. A three-step model for the synaptic recruitment of AMPA receptors. Mol Cell Neurosci. 2011;46:1–8. doi: 10.1016/j.mcn.2010.08.014. [DOI] [PubMed] [Google Scholar]
- 6.Makino H, Malinow R. AMPA receptor incorporation into synapses during LTP: the role of lateral movement and exocytosis. Neuron. 2009;64:381–390. doi: 10.1016/j.neuron.2009.08.035. [DOI] [PMC free article] [PubMed] [Google Scholar]
- 7.Granger AJ, Shi Y, Lu W, Cerpas M, Nicoll RA. LTP requires a reserve pool of glutamate receptors independent of subunit type. Nature. 2013;493:495–500. doi: 10.1038/nature11775. [DOI] [PMC free article] [PubMed] [Google Scholar]
- 8.Lledo PM, et al. Postsynaptic membrane fusion and long-term potentiation. Science. 1998;279:399–403. doi: 10.1126/science.279.5349.399. [DOI] [PubMed] [Google Scholar]
- 9.Ahmad M, et al. Postsynaptic Complexin Controls AMPA Receptor Exocytosis During LTP. Neuron. 2012;73:260–267. doi: 10.1016/j.neuron.2011.11.020. [DOI] [PMC free article] [PubMed] [Google Scholar]
- 10.Jurado S, et al. LTP Requires a Unique Postsynaptic SNARE Fusion Machinery. Neuron. 2013;77:542–558. doi: 10.1016/j.neuron.2012.11.029. [DOI] [PMC free article] [PubMed] [Google Scholar]
- 11.Südhof TC. Neurotransmitter release: The last millisecond in the life of a synaptic vesicle. Neuron. 2013;80:675–690. doi: 10.1016/j.neuron.2013.10.022. [DOI] [PMC free article] [PubMed] [Google Scholar]
- 12.Reim K, et al. Complexins regulate the Ca2+ sensitivity of the synaptic neurotransmitter release machinery. Cell. 2001;104:71–81. doi: 10.1016/s0092-8674(01)00192-1. [DOI] [PubMed] [Google Scholar]
- 13.Maximov A, et al. Complexin Controls the Force Transfer from SNARE complexes to membranes in Fusion. Science. 2009;323:516–521. doi: 10.1126/science.1166505. [DOI] [PMC free article] [PubMed] [Google Scholar]
- 14.Geppert M, et al. Synaptotagmin I: A major Ca2+ sensor for transmitter release at a central synapse. Cell. 1994;79:717–727. doi: 10.1016/0092-8674(94)90556-8. [DOI] [PubMed] [Google Scholar]
- 15.Wen H, et al. Distinct roles for two synaptotagmin isoforms in synchronous and asynchronous transmitter release at zebrafish neuromuscular junction. Proc Natl Acad Sci USA. 2010;107:13906–13911. doi: 10.1073/pnas.1008598107. [DOI] [PMC free article] [PubMed] [Google Scholar]
- 16.Bacaj T, et al. Synaptotagmin-1 and -7 Trigger Synchronous and Asynchronous Phases of Neurotransmitter Release. Neuron. 2013;80:947–959. doi: 10.1016/j.neuron.2013.10.026. [DOI] [PMC free article] [PubMed] [Google Scholar]
- 17.Bacaj T, et al. Synaptotagmin-1 and -7 Are Redundantly Essential for Maintaining the Capacity of the Readily-Releasable Pool of Synaptic Vesicles. PLOS Biology. 2015;13:e1002267. doi: 10.1371/journal.pbio.1002267. [DOI] [PMC free article] [PubMed] [Google Scholar]
- 18.Schonn J, Maximov A, Lao Y, Südhof TC, Sørensen JB. Synaptotagmin-1 and -7 are functionally overlapping Ca2+ sensors for exocytosis in adrenal chromaffin cells. Proc. Natl. Acad. Sci. USA. 2008;105:3998–4003. doi: 10.1073/pnas.0712373105. [DOI] [PMC free article] [PubMed] [Google Scholar]
- 19.Xu W, et al. Distinct Neuronal Coding Schemes in Memory Revealed by Selective Erasure of Fast Synchronous Synaptic Transmission. Neuron. 2012;73:990–1001. doi: 10.1016/j.neuron.2011.12.036. [DOI] [PMC free article] [PubMed] [Google Scholar]
- 20.Zhou Q, et al. Architecture of the Synaptotagmin-SNARE Machinery for Neuronal Exocytosis. Nature. 2015;525:62–67. doi: 10.1038/nature14975. [DOI] [PMC free article] [PubMed] [Google Scholar]
- 21.Wyllie DJ, Manabe T, Nicoll RA. A rise in postsynaptic Ca2+ potentiates miniature excitatory postsynaptic currents and AMPA responses in hippocampal neurons. Neuron. 1994;12:127–138. doi: 10.1016/0896-6273(94)90158-9. [DOI] [PubMed] [Google Scholar]
- 22.Kato HK, Watabe AM, Manabe T. Non-Hebbian synaptic plasticity induced by repetitive postsynaptic action potentials. J Neurosci. 2009;29:11153–60. doi: 10.1523/JNEUROSCI.5881-08.2009. [DOI] [PMC free article] [PubMed] [Google Scholar]
- 23.Kang H, Schuman EM. Long-lasting neurotrophin-induced enhancement of synaptic transmission in the adult hippocampus. Science. 1995;267:1658–1662. doi: 10.1126/science.7886457. [DOI] [PubMed] [Google Scholar]
- 24.Harward SC, Hedrick NG, Hall CE, Parra-Bueno P, Milner TA, Pan E, Laviv T, Hempstead BL, Yasuda R, McNamara JO. Autocrine BDNF-TrkB signalling within a single dendritic spine. Nature. 2016;538:99–103. doi: 10.1038/nature19766. [DOI] [PMC free article] [PubMed] [Google Scholar]
- 25.Arendt KL, et al. Calcineurin mediates homeostatic synaptic plasticity by regulating retinoic acid synthesis. Proc Natl Acad Sci USA. 2015;112:5744–5752. doi: 10.1073/pnas.1510239112. [DOI] [PMC free article] [PubMed] [Google Scholar]
- 26.Dudek SM, Bear MF. Homosynaptic long-term depression in area CA1 of hippocampus and effects of N-methyl-D-aspartate receptor blockade. Proc Natl Acad Sci USA. 1992;89:4363–4367. doi: 10.1073/pnas.89.10.4363. [DOI] [PMC free article] [PubMed] [Google Scholar]
- 27.Zamanillo D, et al. Importance of AMPA receptors for hippocampal synaptic plasticity but not for spatial learning. Science. 1999;284:1805–1811. doi: 10.1126/science.284.5421.1805. [DOI] [PubMed] [Google Scholar]
- 28.Lu W, et al. Activation of synaptic NMDA receptors induces membrane insertion of new AMPA receptors and LTP in cultured hippocampal neurons. Neuron. 2001;29:243–54. doi: 10.1016/s0896-6273(01)00194-5. [DOI] [PubMed] [Google Scholar]
- 29.Passafaro M, Piëch V, Sheng M. Subunit-specific temporal and spatial patterns of AMPA receptor exocytosis in hippocampal neurons. Nat Neurosci. 2001;4:917–926. doi: 10.1038/nn0901-917. [DOI] [PubMed] [Google Scholar]
- 30.Lin DT, Huganir RL. PICK1 and phosphorylation of the glutamate receptor 2 (GluR2) AMPA receptor subunit regulates GluR2 recycling after NMDA receptor-induced internalization. J Neurosci. 2007;27:13903–13908. doi: 10.1523/JNEUROSCI.1750-07.2007. [DOI] [PMC free article] [PubMed] [Google Scholar]
- 31.Kwon OB, et al. Neuregulin-1 reverses long-term potentiation at CA1 hippocampal synapses. J Neurosci. 2005;25:9378–9383. doi: 10.1523/JNEUROSCI.2100-05.2005. [DOI] [PMC free article] [PubMed] [Google Scholar]
- 32.Lee J, Guan Z, Akbergenova Y, Littleton JT. Genetic analysis of synaptotagmin C2 domain specificity in regulating spontaneous and evoked neurotransmitter release. J Neurosci. 2013;33:187–200. doi: 10.1523/JNEUROSCI.3214-12.2013. [DOI] [PMC free article] [PubMed] [Google Scholar]
- 33.Rosenmund C, Stevens CF. Definition of the readily releasable pool of vesicles at hippocampal synapses. Neuron. 1996;16:1197–1207. doi: 10.1016/s0896-6273(00)80146-4. [DOI] [PubMed] [Google Scholar]
- 34.Malinow R, Schulman H, Tsien RW. Inhibition of postsynaptic PKC or CaMKII blocks induction but not expression of LTP. Science. 1989;245:862–866. doi: 10.1126/science.2549638. [DOI] [PubMed] [Google Scholar]
- 35.Malenka RC, et al. An essential role for postsynaptic calmodulin and protein kinase activity in long-term potentiation. Nature. 1989;340:554–557. doi: 10.1038/340554a0. [DOI] [PubMed] [Google Scholar]
- 36.Silva AJ, Stevens CF, Tonegawa S, Wang Y. Deficient hippocampal long-term potentiation in alpha-calcium-calmodulin kinase II mutant mice. Science. 1992;257:201–6. doi: 10.1126/science.1378648. [DOI] [PubMed] [Google Scholar]
- 37.Thiagarajan TC, Piedras-Renteria ES, Tsien RW. alpha- and betaCaMKII. Inverse regulation by neuronal activity and opposing effects on synaptic strength. Neuron. 2002;36:1103–1114. doi: 10.1016/s0896-6273(02)01049-8. [DOI] [PubMed] [Google Scholar]
- 38.Pang ZP, Xu W, Cao P, Südhof TC. Calmodulin Controls Synaptic Strength via Presynaptic Activation of CaM Kinase II. J Neurosci. 2010;30:4132–4142. doi: 10.1523/JNEUROSCI.3129-09.2010. [DOI] [PMC free article] [PubMed] [Google Scholar]
- 39.Chetkovich DM, et al. Phosphorylation of the postsynaptic density-95 (PSD-95)/discs large/zona occludens-1 binding site of stargazin regulates binding to PSD-95 and synaptic targeting of AMPA receptors. J Neurosci. 2002;22:5791–5796. doi: 10.1523/JNEUROSCI.22-14-05791.2002. [DOI] [PMC free article] [PubMed] [Google Scholar]
- 40.Opazo P, et al. CaMKII triggers the diffusional trapping of surface AMPARs through phosphorylation of stargazin. Neuron. 2010;67:239–252. doi: 10.1016/j.neuron.2010.06.007. [DOI] [PubMed] [Google Scholar]
- 41.Fernández-Busnadiego R, Zuber B, Maurer UE, Cyrklaff M, Baumeister W, Lucic V. Quantitative analysis of the native presynaptic cytomatrix by cryoelectron tomography. J Cell Biol. 2010;188:145–156. doi: 10.1083/jcb.200908082. [DOI] [PMC free article] [PubMed] [Google Scholar]
- 42.Maximov A, et al. Genetic analysis of synaptotagmin-7 function in synaptic vesicle exocytosis. Proc Natl Acad Sci USA. 2007;105:3986–3991. doi: 10.1073/pnas.0712372105. [DOI] [PMC free article] [PubMed] [Google Scholar]
- 43.Xu, et al. Synaptotagmin-1 functions as a Ca2+ sensor for spontaneous release. Nat Neurosci. 2009;12:759–766. doi: 10.1038/nn.2320. [DOI] [PMC free article] [PubMed] [Google Scholar]
- 44.Tang J, et al. A complexin/synaptotagmin 1 switch controls fast synaptic vesicle exocytosis. Cell. 2006;126:1175–1187. doi: 10.1016/j.cell.2006.08.030. [DOI] [PubMed] [Google Scholar]
- 45.Maximov A, et al. Monitoring synaptic transmission in primary neuronal cultures using local extracellular stimulation. J Neurosci Methods. 2007;161:75–87. doi: 10.1016/j.jneumeth.2006.10.009. [DOI] [PubMed] [Google Scholar]
- 46.Gähwiler BH, et al. Organotypic slice cultures: a technique has come of age. Trends Neurosci. 1997;20:471–477. doi: 10.1016/s0166-2236(97)01122-3. [DOI] [PubMed] [Google Scholar]
- 47.Aoto, et al. Presynaptic neurexin-3 alternative splicing trans-synaptically controls postsynaptic AMPA receptor trafficking. Cell. 2013;154:75–88. doi: 10.1016/j.cell.2013.05.060. [DOI] [PMC free article] [PubMed] [Google Scholar]
Associated Data
This section collects any data citations, data availability statements, or supplementary materials included in this article.
Supplementary Materials
Data Availability Statement
All relevant data are included with the manuscript as source data or Supplementary Information.


