

Abstract
This paper proposes an adaptive cultural algorithm with improved quantum-behaved particle swarm optimization (ACA-IQPSO) to detect the underwater sonar image. In the population space, to improve searching ability of particles, iterative times and the fitness value of particles are regarded as factors to adaptively adjust the contraction-expansion coefficient of the quantum-behaved particle swarm optimization algorithm (QPSO). The improved quantum-behaved particle swarm optimization algorithm (IQPSO) can make particles adjust their behaviours according to their quality. In the belief space, a new update strategy is adopted to update cultural individuals according to the idea of the update strategy in shuffled frog leaping algorithm (SFLA). Moreover, to enhance the utilization of information in the population space and belief space, accept function and influence function are redesigned in the new communication protocol. The experimental results show that ACA-IQPSO can obtain good clustering centres according to the grey distribution information of underwater sonar images, and accurately complete underwater objects detection. Compared with other algorithms, the proposed ACA-IQPSO has good effectiveness, excellent adaptability, a powerful searching ability and high convergence efficiency. Meanwhile, the experimental results of the benchmark functions can further demonstrate that the proposed ACA-IQPSO has better searching ability, convergence efficiency and stability.
Introduction
Sonar imaging has the advantages of long-distance detection and strong penetration. Therefore, it is being extensively used for underwater inspections, hydrographic and bathymetric surveys, underwater positioning, dredging, cable-laying, pipe-line inspections, and numerous other marine applications. The underwater sonar image contains three kinds of regions, including object-highlight, shadow and background regions. The purpose of object detection is to segment the object-highlight and shadow regions from complex background region and preserve as much of the original edge information of underwater sonar image as possible1. A number of techniques have been proposed to detect underwater objects of the sonar image. A fuzzy clustering method on the sonar image has been proposed to solve the detection problem2. However, fuzzy clustering is very sensitive to speckle noise. A Markov segmentation algorithm was used for three-class sonar image detection3. Later, many improved image detection algorithms on Markov random field model were proposed by scholars4. Although their results are satisfactory, the processing procedures are quite complex and computationally costly. Maria Lianantonakis and Yvan R. Petillot developed active contours and level set methods, which were applied to the detection of regions like the seabed5. Subsequently, Implicit Active Contours were used in sonar image detection6. On this basis, Xiu-FenYe et al. proposed a new detection method of sonar images, Gauss-Markov random field model was integrated into level set energy function model to dynamically extract regions of interest7. Wang Xingmei et al. presented a narrowband Chan-Vese model by adaptive ladder initialization to precisely and quickly detect underwater objects of sonar images8. However, sometimes if the block mode k-means clustering algorithm cannot quickly and accurately complete initial segmentation, approximate position of object-highlight and shadow regions will not be obtained, and higher detection precision will not be possible.
In recent years, the cultural algorithm (CA) has gradually attracted more global attention. It can provide a powerful framework for the solution of complicated problems9. Youlin Lu et al. proposed a hybrid multi-objective cultural algorithm to solve short-term hydrothermal scheduling problems, which combined the differential evolutionary algorithm with CA framework10. It can obtain a more accurate solution. Later, Zhou Wei et al. presented the cultural particle swarm optimization algorithm (CPSO) to solve the partner selection problems of virtual enterprise11. The proposed algorithm has some feasibility and efficiency. To solve the optimization problems, Noor H. Awad et al. proposed a CA with an improved local searching algorithm12. Compared with the basic CA, the performance of this algorithm is greatly improved. Mostafa Z. Ali et al. combined the niche algorithm with the Tabu search algorithm in CA to solve engineering optimization problems, which was efficient and robust to some extent13. Tianyu Liu et al. introduced the QPSO into CA to solve multiobjective optimization problems14. The proposed algorithm has high efficiency. Through the comparative analysis, many intelligent optimization algorithms can be used as evolution strategy in the population space, which can increase population diversity, improve the searching ability and promote efficiency. Among intelligent optimization algorithms, QPSO is one of most commonly used algorithms in the population space of CA. This algorithm supposes that particles have quantum behaviour such that particles are attracted by a quantum potential well centered on its local attractor. It has fewer parameters and a relatively good searching ability15. The contraction-expansion coefficient is the only parameter in the QPSO algorithm, which plays an important role in balancing the global and local searching abilities. However, it is a random value, which easily leads to blindness in the searching process. To solve this problem, the revised QPSO algorithm regarded iterative times as an important factor to adjust the contraction-expansion coefficient16. The contraction-expansion coefficient can linearly decrease with the increase of iterative times in the interval [0.5 1). Although this method is often used in practice, it only solves the linear problem and easily falls into the local optimal solution in the searching process of complex problems. Subsequently, in order to improve the performance of the QPSO algorithm, Jun Sun et al. further presented a diversity-maintained QPSO algorithm17. When the population diversity is lower than a set value, contraction-expansion coefficient is set as the boundary of convergence, or contraction-expansion coefficient linearly decreases. On this basis, Tian Jin constructed a new contraction-expansion coefficient using Sigmoid function to solve high-dimensional multimodal functions optimization problems in the QPSO algorithm18. This method can make the contraction-expansion coefficient decrease nonlinearly with the iterative times and increase the flexibility of the QPSO algorithm. Although these adjustments of the contraction-expansion coefficient in the QPSO algorithm can to some extent improve searching ability, these algorithms only regard iterative times as the factor to adjust the contraction-expansion coefficient. In fact, the quality of particles also influences their searching ability. Therefore, the fitness value is an important factor to adjust the contraction-expansion coefficient.
In addition, the communication protocol between population space and belief space can influence the performance of CA. Accept function is used to set the rate of accepted individuals in the population space, and the rate of accepted individuals usually decreases with iterative times. Ricardo Landa Becerra and Carlos A.Coello improved accept function by resetting the rate of accepted individuals when the best solution had not changed over the last several iterations19. Since this method can improve the performance of CA, it is widely used in CAs20,21. However, appropriate range of rate is different when solving different problems, the rate of accepted individuals still need to be reset. To enhance the flexibility, the fitness values of individuals were used in accept function22. Although this adjustment can somewhat enhance the flexibility, the utilization of evolution information was not adequately used. Influence function is used to guide the evolution of poor individuals in the population space by the knowledge in the belief space. Different types of knowledge are chosen according to different problems23,24. These types of knowledge can determine the searching step size and searching direction of the individuals in the population space.
In these regards, to obtain more accurate detection results, this paper presents an ACA-IQPSO to detect underwater sonar image. In the population space, the contraction-expansion coefficient of the IQPSO is adaptively adjusted according to iterative times and the fitness value of particles. In the belief space, a new update strategy is adopted to update the cultural individuals using the idea of SFLA. In addition, accept function and influence function are redesigned in the new communication protocol. The new communication protocol can make belief space with adequate evolutionary information that can more precisely guide the evolution of particles in the population space and further improve the searching ability of the algorithm. The new communication protocol can enhance convergence efficiency of the algorithm. The experimental results demonstrate that the ACA-IQPSO can locate good clustering centres according to the grey distribution information of underwater sonar images, and accurately complete underwater object detection. Through the analysis of benchmark functions, it can show that the proposed ACA-IQPSO is significantly better than other algorithms in searching ability, convergence efficiency and stability. Therefore, the proposed method has important theoretical and practical value.
Methods
CA and QPSO
CA
CA is a model with double level evolutionary space. It defines both population space and belief space. The two spaces evolve respectively, and the communication protocol between these spaces is accomplished by accept function and influence function. The schematic diagram is shown in Fig. 1. In the population space, the intelligent optimization algorithm can be used as evolution strategy to achieve the evolution of individuals. These individuals in the population space can contribute their experience and evolution information to the belief space through accept function. In the belief space, the experience and evolutionary information are converted into the cultural individuals. And the knowledge is extracted from the cultural individuals to guide the evolution of individuals in the population space. There are five types of knowledge in the belief space, including situational knowledge, normative knowledge, historical knowledge, topographical knowledge and domain knowledge. These types of knowledge are used to influence the evolution of poor individuals in the population space by influence function, and guide individuals to generate elite offspring.
Figure 1.
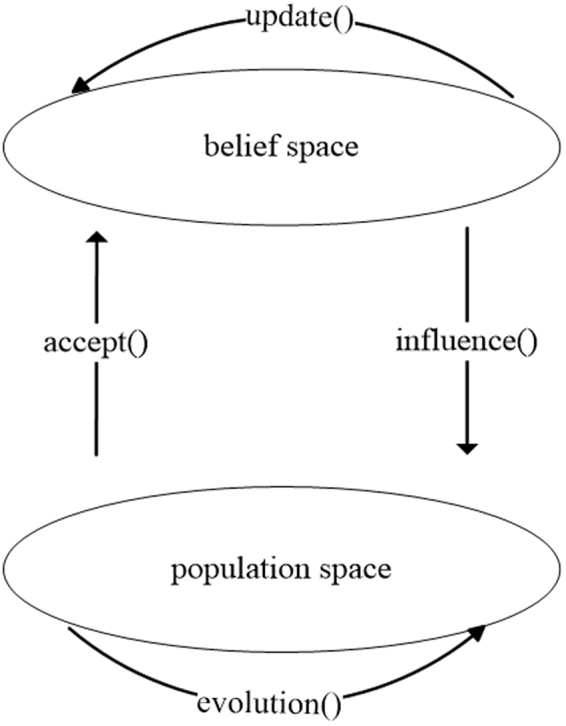
Schematic diagram of CA.
QPSO
The QPSO supposes that particles have quantum behaviour, and they move in a quantum potential well centred on its local attractor. When one particle finds a local optimal state, some particles quickly converge to it, and others appear on any position of the whole space in a certain probability. Particles with quantum-behaved maintain high levels of population diversity, which can avoid falling into the local optimal solution to a certain extent. In addition, it only updates the position without speed. Therefore, the QPSO has relatively fewer parameters and a good searching ability.
In the D-dimensional space, N is the population size. The particle swarm is defined as X = [X 1, X 2, X 3, ... X N], and X i = [X i1, X i2, X i3, ... X iD] represents the current position of the i th particle. The position update of particles is shown as:
| 1 |
where μ is a random number in the interval [0,1], P m(t) is the local attractor, L(t) is the characteristic length of the wave function, and t is the current iterative times.
P m(t) is defined as:
| 2 |
where P i(t) is the personal best position of the particle, and G(t) is the global best position.
L(t) is expressed as:
| 3 |
where β is the contraction-expansion coefficient, which can control the convergence speed of the algorithm. The contraction-expansion coefficient β has an important influence on the searching ability of particles. mbest (t) is the mean best position of all particles.
mbest(t) is given by:
| 4 |
According to Eq. (1) and Eq. (3), the position of the particles can be expressed as:
| 5 |
The proposed ACA-IQPSO
Population space
The IQPSO is integrated into CA as the evolution strategy of the population space in the ACA-IQPSO.
IQPSO: In the QPSO, the quality of particles influences their behaviour in the searching process. The contraction-expansion coefficient is an important factor to control the particles’ behaviour. It only regards iterative times as the factor to generally adjust the contraction-expansion coefficient. However, this method easily falls into the local optimal solution in the searching process of complex problems. Furthermore, the quality of particles depends on information carried by themselves in each iteration, and all the information also has important influence on particles’ behaviour in the searching process. Therefore, iterative times and the fitness value of particles are used to adaptively adjust the contraction-expansion coefficient in IQPSO. In each iteration, when the quality of particles is worse, the contraction-expansion coefficient is larger, and the global searching ability of the particles is relatively stronger. When the quality of particles is better, the contraction-expansion coefficient is relatively smaller, and the local searching ability of the particles is stronger.
The contraction-expansion coefficient β is defined as follows:
| 6 |
where T is the maximum iterative times, f g is the fitness value of G(t), is the average fitness value of particles in the population space, f i is the fitness value of the i th particle, and f w is the fitness value of the worst particle. k is a positive integer, that can adjust β to balance the relationship between iterative times and the fitness value of particles.
The performance analysis of IQPSO: To verify the superiority of the IQPSO in searching ability, Sphere function and Griewank function are used in this paper to test position distribution of particles. Sphere function is unimodal and contains only one global optimal solution. Griewank function is multimodal and contains many local optimal solutions, but only one global optimal solution. Fig. 2 shows position distribution of particles in IQPSO and QPSO16. The relevant parameters are as follows. The dimension of the solution space is 2, the population size is 30, and the maximum number of iterations is 5.
Figure 2.

Position distribution of particles in IQPSO and QPSO. (a) Position distribution of particles on Sphere function. (b) Position distribution of particles on Griewank function.
As seen from Fig. 2, the solution scope is relatively larger in the IQPSO, and IQPSO more easily obtains the global optimal solution. Therefore, compared with the QPSO, the IQPSO can increase population diversity and improve searching ability.
To further verify the effectiveness of the IQPSO in searching ability, the fitness values are calculated by Sphere and Griewank functions in the IQPSO and the QPSO. The optimization results are shown in Fig. 3. The relevant parameters are as follows. The dimension of the solution space is 10, the population size is 30, the maximum number of iterations is 30, and the experiment runs for 30 times in each algorithm.
Figure 3.

The optimization results in IQPSO and QPSO. (a) The optimization results of Sphere function. (b) The optimization results of Griewank function.
As depicted in Fig. 3, whether it is unimodal function or multimodal function, the fitness values of the IQPSO are always smaller than the QPSO in the iterative process. Therefore, the optimal solutions of the IQPSO are always better than the QPSO. The optimization results further show that the searching ability of the IQPSO is better than the QPSO.
Belief space
In the ACA-IQPSO, the cultural individuals in the belief space are updated by a new update strategy. Meanwhile, three types of knowledge are extracted from the cultural individuals. These types of knowledge are used to influence the evolution of particles in the population space by influence function, and guide particles to generate elite offspring.
Update strategy: Cultural individuals are updated by selection, crossover and mutation in many CAs11. However, this update strategy needs many parameters that make the algorithm not easy to control and lead to poor searching ability. In SFLA, the worst frog is updated by the step size that is the difference between the best frog and the worst frog. This update strategy has few parameters, powerful searching ability and is easy to implement25. Therefore, a new update strategy is adopted to update the cultural individuals in the belief space according to the idea of the update strategy in SFLA. The new update strategy adopts the difference between the situational knowledge and the cultural individuals as step size. New update strategy is expressed as follows:
| 7 |
where Y j(t) is the position of the j th cultural individual, S(t) is situational knowledge of the t th iteration in belief space, and rand is a random number in the interval [0,1].
Knowledge structure: Situational knowledge, normative knowledge and domain knowledge are adopted in the belief space of ACA-IQPSO. In each iteration, these types of knowledge are updated by cultural individuals.
Situational knowledge contains the best cultural individual in the belief space. In each iteration, when the fitness value of the best cultural individual is larger than that of the current situational knowledge, the best cultural individual is used as situational knowledge in the update process. Update formula of situational knowledge is:
| 8 |
where Y g(t) is the best cultural individual in the t th iteration, f S(t) is the fitness value of S(t), and f yg(t) is the fitness value of Y g(t).
Normative knowledge describes the feasible solution space of the problem in the belief space. It stores the boundary information that can guide particles in the population space to search for a better region. The update of normative knowledge reflects the change of the feasible search space. With the increase of iterative times, the searching scope can be concentrated in the dominant region. Therefore, when an excellent cultural individual is out of the current searching scope in each iteration, normative knowledge is updated. Update formula of normative knowledge is as follows:
| 9 |
| 10 |
where Y j(t) is the position of the j th cultural individual, f j(t) is the fitness value of Y j(t), f l(t) is lower limit of fitness value in the t th iteration, f u(t) is upper limit of fitness value in the t th iteration.
Domain knowledge is used to statically or dynamically guide the particles in the population space to evolve along the predictive direction, and record a good evolutionary trend. In the belief space, the centre of gravity can reflect the overall distribution of the cultural individuals and guide the particles in the population space to search better solutions. The evolutionary direction of the particles in the population space can be predicted by updating the centre of gravity in each iteration, which can improve the searching efficiency. Therefore, domain knowledge stores the centre of gravity in the belief space to guide the evolution of particles in the population space in this paper. The centre of gravity GT(t) is defined as follows:
| 11 |
where M is the size of cultural individuals, and D is the dimension of cultural individuals.
New communication protocol
The communication protocol between the population and belief spaces is accomplished by accept function and influence function. To enhance utilization of information in the population and belief spaces, accept and influence functions are redesigned in the new communication protocol.
Accept function: Accept function is used to set the rate of accepted particles in the population space. To further improve the flexibility of the rate, accept function is redesigned in this paper. The new accept function can adaptively change the rate of accepted particles according to the quality of particles in each iteration. Meanwhile, it can enhance utilization degree of information in the population space. When the quality of particles is better, the accept rate is larger. The new accept function is defined as follows:
| 12 |
where is the average fitness value of particles in the population space, f w is the fitness value of the worst particle in the population space, and f i is the fitness value of the i th particle.
Therefore, the number of accepted particles in population space is calculated according to Eq. (12). It is:
| 13 |
where N is the population size.
For new accept function, Eq. (12) is analysed in detail. The fitness values of particles in population space are sorted in descending order. Therefore, if there is a position c where the fitness value f c is larger than , and the fitness value f c + 1 is smaller than . Af is:
| 14 |
where c is an integer in the interval [1, N − 1], A = f c + 1 + ... + f N, and A ≥ (N − c) . f N.
Therefore, Eq. (15) is as follows:
| 15 |
As seen from Eq. (15), when c = N − 1, the maximum value of Af is 0.5. When c is relatively larger, there are more particles whose fitness values are larger than the average fitness value, and the quality of particles in the population space is better. Correspondingly, more particles are accepted. When c is relatively smaller, there are fewer particles whose fitness values are larger than the average fitness value, and the quality of particles in the population space is worse. Correspondingly, fewer particles are accepted. Therefore, new accept function is effective in this paper.
Influence function: Influence function is used to guide the evolution of poor particles in the population space by using the knowledge in the belief space. These types of knowledge determine searching step size and searching direction of the particles in the population space. To enhance utilization of information in the belief space and more precisely guide the evolution of poor particles in the population space, influence function is also redesigned in this paper. The new influence function adopts situational, normative and domain knowledge to guide the evolution of poor particles in the population space. Situational and domain knowledge are used to determine searching step size, and normative knowledge is used to determine searching direction. When the fitness values of the poor particles are less than the lower limit of fitness value in the belief space, domain knowledge is used to control searching step size. When the fitness values of poor particles are less than the upper limit of fitness value in the belief space, situational knowledge is used to control searching step size. Otherwise, the positions of poor particles are randomly generated in the solution space.
The influence function is defined as follows:
| 16 |
where bound1 and bound2 are the lower bound and upper bound of solution space respectively. α, ω, and rand are random number in the interval [0,1].
The performance analysis of new communication protocol: To verify the effectiveness of the new accept function and influence function in the ACA-IQPSO, Sphere and Griewank functions are used to compare the ACA-IQPSO with a cultural algorithm with improved quantum-behaved particle swarm optimization (CA-IQPSO). The CA-IQPSO introduces the IQPSO into CA, which uses the communication protocol in cultural algorithm for power system stabilizer (CA-PSS)20. The fitness values are calculated by Sphere and Griewank functions in the ACA-IQPSO and the CA-IQPSO. The optimization results are shown in Fig. 4.The relevant parameters are as follows. The dimension of the solution space is 10, the population size is 30, the maximum number of iterations is 30, the size of cultural individuals is 8, and the experiment runs for 30 times in each algorithm.
Figure 4.

The optimization results in ACA-IQPSO and CA-IQPSO. (a) The optimization results of Sphere function. (b) The optimization results of Griewank function.
As depicted in Fig. 4, whether it is unimodal function or multimodal function, the ACA-IQPSO can converge to global optimal solution after 10 iterations, convergence speed of ACA-IQPSO is faster in the iterative process. It can indicate that convergence efficiency of the ACA-IQPSO is superior to the CA-IQPSO. Meanwhile, the fitness values of the ACA-IQPSO are smaller than the CA-IQPSO. The new communication protocol can make belief space with adequate evolutionary information that can more precisely guide the evolution of particles in the population space. Therefore, the new communication protocol can further improve searching ability remarkably.
Results and Discussion
Experimental results and discussion of sonar image detection
In this section, the original sonar image has serious noise. To remove some noise points and make the image smoother, Butterworth lower-pass filter is used for the noise smoothing26. On this basis, numerical examples are shown to validate the effectiveness and adaptability of the proposed ACA-IQPSO for sonar image detection. Meanwhile, the ACA-IQPSO is compared with CA-IQPSO, CPSO11, IQPSO, QPSO16, and PSO27. In addition, the fitness function is mainly used to evaluate the quality of particles in the process of sonar image detection. Therefore, a fitness function combining intra-class difference with inter-class difference is adopted in these algorithms28.When the fitness value is larger, the detection result is better. The relevant parameters are as follows. The number of clustering centers is 4, the population size is 20, the maximum number of iterations is 20, the acceleration coefficient is c1 = c2 = 2, the inertia weight is w = 0.8 in CPSO and PSO, size of cultural individuals is M = 8 in the ACA-IQPSO, CA-IQPSO and CPSO, and the contraction-expansion coefficient β linearly decreases from 1.0 to 0.5 in the QPSO.
Fig. 5 shows the detection results of the original sonar image with floating objects.
Figure 5.

Detection results of original sonar image (image size: 277 × 325). (a) Original sonar image. (b) Smoothed image. (c) ACA-IQPSO. (d) CA-IQPSO. (e) CPSO. (f) IQPSO. (g) QPSO. (h) PSO.
As depicted in Fig. 5, the proposed ACA-IQPSO can better detect object-highlight and shadow regions from complex background region. The edge information is preserved as much as possible in Fig. 5(c). While the detection result of the CA-IQPSO can only detect the shadow region in Fig. 5(d), it is not suitable for detecting the sonar image with floating objects. Although the CPSO can detect the object-highlight and shadow regions, it has serious information loss in the object-highlight region in Fig. 5(e). At the same time, IQPSO can also detect the object-highlight and shadow regions, but the detection result contains a lot of noise and the integrity of the underwater object is seriously weak in Fig. 5(f). The detection result of the QPSO has serious noise, which is not an ideal detection result in Fig. 5(g). PSO can only detect the object-highlight region in Fig. 5(h).Therefore, compared with the detection results of CA-IQPSO, CPSO, IQPSO, QPSO and PSO, the proposed ACA-IQPSO can locate good clustering centres according to the grey distribution information of the underwater sonar image with floating objects and accurately complete underwater object detection.
To further verify the effectiveness of the proposed ACA-IQPSO, Fig. 6 shows the detection results of the original sonar image with underwater stones on the bottom, which has a relatively weak contrast. Fig. 7 shows the detection results of structured seabed that is an object in sand ripples. Fig. 8 shows the detection results of larboard original sonar image including rocks, which are partly buried in the sand.
Figure 6.

Detection results of original sonar image (image size: 203 × 257). (a) Original sonar image. (b) Smoothed image. (c) ACA-IQPSO. (d) CA-IQPSO. (e) CPSO. (f) IQPSO. (g) QPSO. (h) PSO.
Figure 7.

Detection results of original sonar image (image size: 259 × 368). (a) Original sonar image. (b) Smoothed image. (c) ACA-IQPSO. (d) CA-IQPSO. (e) CPSO. (f) IQPSO. (g) QPSO. (h) PSO.
Figure 8.

Detection results of original sonar image (image size: 173 × 167). (a) Original sonar image. (b) Smoothed image. (c) ACA-IQPSO. (d) CA-IQPSO. (e) CPSO. (f) IQPSO. (g) QPSO. (h) PSO.
As seen from Figs 6, 7 and 8, the proposed ACA-IQPSO can obtain relatively better detection results in Figs 6(c), 7(c) and 8(c). While Fig. 6(d) has information loss in the object-highlight region. Although Fig. 6(e),(f),(g) and (h) can detect the object-highlight region and shadow region, the detection results have serious noise, especially in Fig. 6(g) and (h). Therefore, QPSO and PSO are failed to detect the sonar image with relatively weak contrast. Meanwhile, some information is lost in the object-highlight region and shadow region in Fig. 7(d),(e),(f),(g) and (h), which is not conducive to the subsequent feature extraction and underwater object recognition. In Fig. 8, the detection results of Fig. 8(d),(f),(g) and (h) show information loss in the shadow region and over detection in object-highlight region. At the same time, the detection results have different degrees of noise. Fig. 8(e) has serious information loss in object-highlight region. They are not ideal detection results.
Through the above comparative experiments, the proposed ACA-IQPSO can obtain relatively accurate results in sonar image detection. Moreover, the detection results of the CA-IQPSO are not better than ACA-IQPSO, which further verifies the effectiveness of the new communication protocol in this paper. Meanwhile, IQPSO can relatively obtain better detection results than QPSO, this indicates that IQPSO can improve searching ability of particles.
To demonstrate the advantages of proposed ACA-IQPSO more clearly, Table 1 shows the best fitness values after 20 iterations for the ACA-IQPSO and other intelligent optimization algorithms. Fig. 9 shows the variation of the best fitness values in each iteration.
Table 1.
The best fitness values of detection results.
Figure 9.

Variation of the fitness values in each iteration. (a) Variation of fitness values of Fig. 5. (b) Variation of fitness values of Fig. 6. (c) Variation of fitness values of Fig. 7. (d) Variation of fitness values of Fig. 8.
It can be seen from Table 1 and Fig. 9 that the best fitness values of the proposed ACA-IQPSO are larger than other intelligent optimization algorithms after 20 iterations, which shows the powerful searching ability and high convergence efficiency of ACA-IQPSO. Meanwhile, the best fitness values of CA-IQPSO are larger than IQPSO and the best fitness values of CPSO are larger than PSO, which can demonstrate the effectiveness of CA. Among IQPSO, QPSO and PSO, the best fitness values of IQPSO and QPSO are close, but the IQPSO is superior to the QPSO, and they are larger than PSO. These results indicate that IQPSO has the merit of searching ability.
To further verify the adaptability of the proposed ACA-IQPSO in this paper, Fig. 10 shows the detection results of another original sonar image with floating objects. Fig. 11 shows the detection results of starboard original sonar image with ship. Fig. 12 shows the detection results of an original sonar image with bottom tire.
Figure 10.

Detection results of original sonar image (image size: 130 × 201). (a) Original sonar image. (b) Smoothed image. (c) Detection result of ACA-IQPSO.
Figure 11.

Detection results of original sonar image (image size: 393 × 218). (a) Original sonar image. (b) Smoothed image. (c) Detection result of ACA-IQPSO.
Figure 12.

Detection results of original sonar image (image size: 197 × 211). (a) Original sonar image. (b) Smoothed image. (c) Detection result of ACA-IQPSO.
From the results shown in Figs 10, 11 and 12, the proposed ACA-IQPSO can better detect original sonar image with floating objects, partly buried objects and objects on the bottom in this paper, and it has a certain effectiveness and adaptability. Moreover, it provides better preconditions for the subsequent feature extraction and underwater object recognition.
Experimental results and discussion of benchmark functions
To further verify the performance of the proposed ACA-IQPSO, 10 benchmark functions are used to compare the ACA-IQPSO with CA-IQPSO, CPSO, IQPSO, QPSO, and PSO. Among these benchmark functions, unimodal functions and multimodal functions are used to test local searching ability and global searching ability respectively. The details of benchmark functions are shown in Table 2.
Table 2.
The details of benchmark functions.
| Function | Name | Searching range | Global optimum | Dimension | Modality |
|---|---|---|---|---|---|
| F1 | Sphere | [−5.12, 5.12] | 0 | 10/30/50 | unimodal |
| F2 | Generalized Griewank | [−600, 600] | 0 | 10/30/50 | multimodal |
| F3 | Stretched_V sine | [−10, 10] | 0 | 10/30/50 | multimodal |
| F4 | Generalized Rastrigin’s | [−5.12, 5.12] | 0 | 10/30/50 | multimodal |
| F5 | Generalized Rosenbrock’s | [−2.048, 2.048] | 0 | 10/30/50 | unimodal |
| F6 | Quartic | [−1.28, 1.28] | 0 | 10/30/50 | unimodal |
| F7 | Schwefel’s problem 2.22 | [−10, 10] | 0 | 10/30/50 | unimodal |
| F8 | Alpine | [−10, 10] | 0 | 10/30/50 | multimodal |
| F9 | Salomon | [−100, 100] | 0 | 10/30/50 | multimodal |
| F10 | Zakharov | [−5, 10] | 0 | 10/30/50 | unimodal |
Minimum value, maximum value, mean value and standard deviation are obtained after each algorithm running 20 times. These values are used to evaluate the performance of algorithms in this paper. The relevant parameters of each run are as follows. The population size is 50, the maximum number of iterations is 50, and the dimensions are 10, 30 and 50 respectively. The acceleration coefficient is c1 = c2 = 2, the inertia weight is w = 0.8 in CPSO and PSO, size of cultural individuals is M = 15 in ACA-IQPSO, CA-IQPSO and CPSO, and the contraction-expansion coefficient linearly decreases from 1.0 to 0.5 in QPSO.
The performance of the algorithms is related to the dimension. When the dimension increases, the performance differences will be more significant. To analyse the performance of the algorithms in different dimensions, Table 3 shows the minimum value, maximum value, mean value and standard deviation of the different algorithms when the dimension is 10.
Table 3.
Comparative results of different algorithm benchmark functions (10 dimension).
| Fun | Eva | ACA-IQPSO | CA-IQPSO | CPSO | IQSO | QPSO | PSO |
|---|---|---|---|---|---|---|---|
| F1 | min | 0.001e-016 | 0.032 | 0.011 | 0.015 | 0.003 | 0.351 |
| max | 3.391e-016 | 2.834 | 5.402 | 4.206 | 5.926 | 1.953 | |
| mean | 0.192e-016 | 0.958 | 1.203 | 1.042 | 1.458 | 1.079 | |
| Std | 0.754e-016 | 0.924 | 1.707 | 1.345 | 1.644 | 0.426 | |
| F2 | min | 0.001e-7 | 0.681 | 0.796 | 0.670 | 0.593 | 1.949 |
| max | 2.986e-7 | 16.011 | 17.917 | 13.338 | 17.836 | 10.359 | |
| mean | 0.212e-7 | 4.046 | 5.221 | 3.379 | 4.634 | 5.001 | |
| Std | 0.709e-7 | 4.023 | 4.603 | 3.443 | 4.923 | 2.055 | |
| F3 | min | 3.933 | 9.215 | 6.677 | 6.543 | 8.427 | 8.899 |
| max | 16.723 | 17.619 | 18.490 | 18.422 | 17.623 | 17.052 | |
| mean | 12.947 | 13.028 | 10.908 | 13.865 | 13.677 | 13.632 | |
| Std | 3.340 | 2.908 | 2.824 | 3.304 | 2.350 | 2.222 | |
| F4 | min | 0.004e-7 | 12.681 | 17.006 | 13.178 | 14.619 | 49.939 |
| max | 5.933e-7 | 69.138 | 73.348 | 78.304 | 70.314 | 81.346 | |
| mean | 0.567e-7 | 38.767 | 36.329 | 44.271 | 46.230 | 66.521 | |
| Std | 1.434e-7 | 14.791 | 14.522 | 18.715 | 15.437 | 10.228 | |
| F5 | min | 2.649e-10 | 1.325e-009 | 6.888e-9 | 0.388 | 1.645 | 16.785 |
| max | 4.215 | 6.986 | 6.680 | 74.023 | 62.363 | 101.409 | |
| mean | 0.533 | 2.578 | 1.755 | 18.506 | 22.168 | 35.422 | |
| Std | 1.184 | 2.164 | 2.238 | 25.789 | 20.582 | 24.832 | |
| F6 | min | 0.003e-37 | 2.394e-6 | 1.782e-5 | 2.569e-5 | 5.216e-5 | 1.253e-4 |
| max | 8.433e-36 | 0.894 | 0.095 | 0.105 | 0.180 | 0.030 | |
| mean | 1.041e-36 | 0.078 | 0.023 | 0.015 | 0.042 | 0.007 | |
| Std | 2.004e-036 | 0.220 | 0.032 | 0.030 | 0.056 | 0.007 | |
| F7 | min | 0.241e-8 | 0.186 | 0.723 | 0.134 | 0.330 | 4.795 |
| max | 3.673e-8 | 21.762 | 38.13 | 25.642 | 33.333 | 15.042 | |
| mean | 0.993e-8 | 7.362 | 9.168 | 9.518 | 12.018 | 9.494 | |
| Std | 0.795e-8 | 5.823 | 9.072 | 6.622 | 9.465 | 3.415 | |
| F8 | min | 0.011 | 0.785 | 0.984 | 9.407 | 10.707 | 9.575 |
| max | 7.469 | 6.767 | 6.350 | 17.312 | 19.301 | 18.995 | |
| mean | 2.586 | 3.449 | 3.077 | 14.455 | 14.093 | 14.944 | |
| Std | 1.782 | 1.434 | 1.454 | 2.0588 | 2.704 | 2.467 | |
| F9 | min | 2.842e-16 | 15.831 | 5.857 | 0.427 | 6.068 | 0.168e + 3 |
| max | 3.572e-11 | 2.743e + 3 | 2.346e + 3 | 2.290e + 3 | 2.125e + 3 | 0.911e + 3 | |
| mean | 2.385e-12 | 0.750 e + 3 | 0.570e + 3 | 0.474e + 3 | 0.571e + 3 | 0.451e + 3 | |
| Std | 7.875e-12 | 0.923 e + 3 | 0.697e + 3 | 0.665e + 3 | 0.631e + 3 | 0.183e + 3 | |
| F10 | min | 3.666e-13 | 14.815 | 7.553 | 1.650 | 13.058 | 20.870 |
| max | 5.889e-6 | 120.323 | 94.352 | 101.203 | 75.740 | 340.018 | |
| mean | 3.091e-7 | 65.831 | 35.188 | 46.302 | 49.468 | 88.978 | |
| Std | 1.311e-6 | 25.901 | 22.231 | 27.809 | 15.914 | 74.781 |
Table 4 shows the minimum value, maximum value, mean value and standard deviation of the different algorithms when the dimension is 30.
Table 4.
Comparative results of different algorithm benchmark functions (30 dimension).
| Fun | Eva | ACA-IQPSO | CA-IQPSO | CPSO | IQSO | QPSO | PSO |
|---|---|---|---|---|---|---|---|
| F1 | min | 0.039e-15 | 0.426 | 3.022 | 0.807 | 1.483 | 12.816 |
| max | 6.512e-15 | 43.273 | 92.352 | 38.831 | 42.565 | 63.996 | |
| mean | 1.359e-15 | 14.248 | 29.618 | 16.657 | 16.566 | 30.769 | |
| Std | 1.641e-15 | 10.955 | 25.664 | 10.757 | 12.917 | 12.267 | |
| F2 | min | 00.003e-10 | 2.779 | 19.372 | 4.260 | 13.011 | 52.608 |
| max | 2.068e-10 | 96.362 | 218.610 | 166.551 | 124.224 | 188.514 | |
| mean | 0.150e-10 | 50.053 | 81.213 | 72.252 | 56.278 | 104.889 | |
| Std | 0.454e-10 | 29.201 | 218.620 | 47.163 | 31.852 | 40.233 | |
| F3 | min | 0.003 | 31.242 | 36.615 | 22.703 | 32.767 | 54.192 |
| max | 0.008 | 70.987 | 71.181 | 70.508 | 71.353 | 76.834 | |
| mean | 0.005 | 55.235 | 54.264 | 53.203 | 53.933 | 68.053 | |
| Std | 0.002 | 10.980 | 8.427 | 12.734 | 10.160 | 6.381 | |
| F4 | min | 0.011e-11 | 113.299 | 109.928 | 163.012 | 171.195 | 251.666 |
| max | 2.876e-11 | 265.058 | 287.250 | 262.475 | 312.808 | 342.299 | |
| mean | 0.491e-11 | 191.147 | 186.260 | 204.204 | 234.890 | 304.058 | |
| Std | 0.755e-11 | 46.833 | 39.916 | 34.786 | 38.261 | 23.294 | |
| F5 | min | 0.116 | 1.452 | 1.861 | 20.269 | 23.604 | 253.122 |
| max | 20.526 | 17.469 | 14.236 | 294.183 | 386.263 | 1.938e + 3 | |
| mean | 9.896 | 7.640 | 7.447 | 118.545 | 146.226 | 818.542 | |
| Std | 6.325 | 3.799 | 3.155 | 55.172 | 79.135 | 462.124 | |
| F6 | min | 0.006e-32 | 0.004 | 1.782e-5 | 0.003 | 0.019 | 0.857 |
| max | 3.368e-31 | 9.526 | 0.095 | 5.822 | 7.337 | 14.646 | |
| mean | 0.405e-31 | 1.853 | 0.023 | 1.163 | 1.391 | 4.836 | |
| Std | 0.788e-31 | 2.551 | 0.032 | 1.508 | 1.858 | 3.681 | |
| F7 | min | 0.484e-7 | 17.658 | 19.433 | 3.982 | 18.169 | 39.452 |
| max | 3.909e-7 | 97.709 | 1.216e + 3 | 96.656 | 394.806 | 8.842e + 3 | |
| mean | 1.416e-7 | 52.346 | 110.072 | 47.747 | 67.819 | 1.343e + 3 | |
| Std | 0.847e-7 | 25.481 | 260.379 | 26.436 | 83.225 | 2.664e + 3 | |
| F8 | min | 4.566 | 4.629 | 3.721 | 8.549 | 6.546 | 7.514 |
| max | 29.001 | 26.483 | 35.020 | 19.312 | 18.643 | 20.997 | |
| mean | 16.498 | 19.514 | 18.621 | 13.845 | 14.355 | 14.919 | |
| Std | 6.683 | 6.553 | 7.576 | 2.320 | 3.120 | 3.079 | |
| F9 | min | 1.160e-14 | 17.427 | 273.426 | 0.001 | 4.816 | 72.762 |
| max | 5.880e-11 | 1823e + 4 | 2.092e + 4 | 634.916 | 750.721 | 1.332e + 3 | |
| mean | 7.973e-12 | 6.332e + 3 | 5.224e + 3 | 138.511 | 165.441 | 409.494 | |
| Std | 1.569e-11 | 5.626e + 3 | 5.019e + 3 | 185.771 | 187.897 | 257.137 | |
| F10 | min | 3.785e-7 | 201.443 | 59.370 | 4.303 | 4.763 | 10.925 |
| max | 0.683 | 357.637 | 353.937 | 30.387 | 42.082 | 190.550 | |
| mean | 0.044 | 280.598 | 169.655 | 17.611 | 22.617 | 79.999 | |
| Std | 0.152 | 48.145 | 74.141 | 7.403 | 9.759 | 46.027 |
Table 5 shows the minimum value, maximum value, mean value and standard deviation of the different algorithms when the dimension is 50.
Table 5.
Comparative results of different algorithm benchmark functions (50 dimension).
| Fun | Eva | ACA-IQPSO | CA-IQPSO | CPSO | IQSO | QPSO | PSO |
|---|---|---|---|---|---|---|---|
| F1 | min | 0.079e-15 | 5.993 | 3.022 | 5.687 | 10.155 | 50.737 |
| max | 6.226e-15 | 72.933 | 92.352 | 102.872 | 65.798 | 120.925 | |
| mean | 2.789e-15 | 33.574 | 29.618 | 32.045 | 31.107 | 83.588 | |
| Std | 1.763e-15 | 18.837 | 25.664 | 25.771 | 16.246 | 18.127 | |
| F2 | min | 0.003e-10 | 11.413 | 9.414 | 18.179 | 19.553 | 155.707 |
| max | 1.255e-10 | 239.987 | 292.441 | 238.381 | 352.719 | 392.073 | |
| mean | 0.263e-10 | 143.819 | 102.649 | 96.500 | 130.760 | 276.319 | |
| Std | 0.344e-10 | 66.769 | 74.853 | 67.903 | 94.867 | 57.905 | |
| F3 | min | 0.007 | 60.837 | 76.891 | 38.798 | 56.907 | 108.870 |
| max | 0.022 | 126.338 | 117.621 | 117.436 | 126.870 | 147.691 | |
| mean | 0.011 | 93.902 | 94.424 | 91.066 | 84.466 | 125.894 | |
| Std | 0.004 | 18.486 | 12.151 | 20.197 | 19.590 | 10.936 | |
| F4 | min | 0.011e-11 | 274.721 | 287.470 | 230.325 | 269.614 | 512.951 |
| max | 1.199e-11 | 493.853 | 586.535 | 447.801 | 513.792 | 625.668 | |
| mean | 0.344e-11 | 381.700 | 361.106 | 359.192 | 388.933 | 558.881 | |
| Std | 0.332e-11 | 61.096 | 74.189 | 60.012 | 76.402 | 32.732 | |
| F5 | min | 1.081 | 5.610 | 2.703 | 21.911 | 0.062e + 3 | 812.024 |
| max | 26.163 | 22.874 | 22.951 | 967.887 | 1.110e + 3 | 4.904e + 3 | |
| mean | 15.445 | 11.520 | 10.221 | 289.082 | 0.375e + 3 | 2.286e + 3 | |
| Std | 8.625 | 4.924 | 5.120 | 252.810 | 0.365e + 3 | 1.230e + 3 | |
| F6 | min | 0.001e-29 | 0.013 | 0.025 | 0.115 | 0.899 | 2.226 |
| max | 0.540e-28 | 5.436 | 17.217 | 25.656 | 24.134 | 71.606 | |
| mean | 0.053e-28 | 1.916 | 3.834 | 4.258 | 5.964 | 30.829 | |
| Std | 0.121e-28 | 1.826 | 4.326 | 5.827 | 6.581 | 18.573 | |
| F7 | min | 0.161e-6 | 21.388 | 48.744 | 25.611 | 30.336 | 101.733 |
| max | 1.009e-6 | 403.579 | 1.868e + 6 | 262.016 | 154.344 | 2.214e + 9 | |
| mean | 0.429e-6 | 114.307 | 8.917e + 4 | 86.307 | 80.571 | 2.212e + 8 | |
| Std | 0.211e-6 | 102.428 | 4.176e + 5 | 57.587 | 43.984 | 5.443e + 8 | |
| F8 | min | 12.171 | 20.174 | 15.978 | 102.736 | 90.465 | 8.113 |
| max | 67.160 | 75.547 | 58.729 | 126.795 | 127.968 | 19.749 | |
| mean | 38.540 | 43.109 | 36.572 | 111.762 | 114.639 | 14.570 | |
| Std | 14.330 | 12.646 | 11.917 | 7.749 | 7.380 | 3.224 | |
| F9 | min | 1.167e-14 | 1.277e + 3 | 2.456e + 3 | 2.320 | 3.478 | 278.003 |
| max | 1.252e-10 | 3.376e + 4 | 3.185e + 4 | 188.456 | 636.117 | 1.140e + 3 | |
| mean | 1.643e-11 | 1.253e + 4 | 1.316e + 4 | 47.756 | 113.181 | 530.507 | |
| Std | 3.053e-11 | 9.087e + 3 | 7.354e + 3 | 51.224 | 141.091 | 212.928 | |
| F10 | min | 1.548e-5 | 288.425 | 99.606 | 1.441 | 3.799 | 27.471 |
| max | 26.913 | 927.776 | 465.631 | 22.398 | 33.833 | 157.421 | |
| mean | 1.492 | 552.816 | 297.274 | 11.694 | 17.970 | 83.039 | |
| Std | 5.977 | 168.856 | 110.946 | 6.713 | 7.287 | 42.022 |
From the comparative results in Table 3, Table 4 and Table 5, mean values of the IQPSO are smaller than the QPSO when the dimension is 10, 30 and 50, which indicates that the searching ability of the IQPSO is stronger than the QPSO. The standard deviation of the IQPSO and QPSO are close when dimension is 10, while standard deviation of the IQPSO are smaller than QPSO when dimension is 30 and 50. This demonstrates that the stability of the IQPSO is superior to QPSO in high dimension. Meanwhile, compared with the other algorithms, the proposed ACA-IQPSO is relatively closer to the global optimum value 0 after 50 iterations, which shows that the ACA-IQPSO has high convergence efficiency. In addition, minimum values, maximum values, mean values and standard deviation of the ACA-IQPSO in different benchmark functions are the smallest, which indicates that the proposed ACA-IQPSO has obvious advantages in searching ability and stability.
Similarly, Wilcoxon Signed-Rank Test and the Friedman test in nonparametric tests are adopted to further evaluate the performance of the algorithms by 10 benchmark functions in different dimensions29,30. Wilcoxon Signed-Rank Test is a paired comparison, which is used to compare the performance differences between two algorithms. If the p-values are less than or equal to the statistical significance value τ, the null hypothesis is rejected, which indicates that the two algorithms are different in performance. Friedman test is multiple comparison, which is used to compare the performance differences between more than two algorithms. When average rank is smaller, the performance of the algorithm is better.
Table 6 shows the p-values of Wilcoxon Signed-Rank Test by 10 benchmark functions in different dimensions (the statistical significance value τ = 0.05). Table 7 shows the average rank of Friedman Test by 10 benchmark functions in different dimensions.
Table 6.
The p-values of Wilcoxon Signed-Rank Test.
| Dimension | ACA-IQPSO vs CA-IQPSO | ACA-IQPSO vs CPSO | ACA-IQPSO vs IQPSO | ACA-IQPSO vs QPSO |
|---|---|---|---|---|
| 10 | 0.0020 | 0.0195 | 0.0020 | 0.0020 |
| 30 | 0.0059 | 0.0098 | 0.0059 | 0.0059 |
| 50 | 0.0059 | 0.0137 | 0.0020 | 0.0020 |
Table 7.
The average rank of Friedman Test.
| Dimension | ACA-IQPSO | CA-IQPSO | CPSO | IQPSO | QPSO | PSO |
|---|---|---|---|---|---|---|
| 10 | 1.1 | 3.6 | 3.1 | 3.8 | 4.9 | 4.5 |
| 30 | 1.5 | 3.9 | 4.0 | 2.8 | 3.5 | 5.3 |
| 50 | 1.0 | 4.3 | 4.0 | 2.8 | 3.5 | 5.4 |
As seen in Table 6 and Table 7, the p-values between the ACA-IQPSO and other algorithms are smaller than the statistical significance value, which shows the significant performance differences between the ACA-IQPSO and other algorithms. Meanwhile, the average ranks of the ACA-IQPSO are smaller than the other algorithms. It can indicate that the performance of the ACA-IQPSO is superior to other algorithms. Therefore, through the analysis of benchmark functions, it can demonstrate that the proposed ACA-IQPSO is obviously better than other algorithms in searching ability, convergence efficiency and stability.
Conclusions
Considering the growing requirements of underwater sonar image detection, this paper proposed the ACA-IQPSO to detect underwater sonar images In the population space, iterative times and the fitness value of particles are used as factors to adaptively adjust the contraction-expansion coefficient of the QPSO. IQPSO can make particles adjust their behaviour to improve searching ability. In belief space, a new update strategy is adopted to update the cultural individuals according to the update strategy in SFLA. Moreover, to enhance utilization of information in population and belief spaces, accept function and influence function are redesigned in the new communication protocol. The new communication protocol can make belief space with adequate evolutionary information that can more precisely guide the evolution of particles in the population space and further improve the searching ability of the algorithm. Furthermore, the new communication protocol can enhance convergence efficiency of algorithm.
The proposed ACA-IQPSO is based on a clustering model. The object-highlight, shadow and background regions in the sonar image are detected by clustering centres. The experimental results demonstrate that ACA-IQPSO can locate good clustering centers and accurately complete underwater objects detection. Compared with other algorithms, the proposed ACA-IQPSO has good effectiveness and adaptability, and it has powerful searching ability and high convergence efficiency. Meanwhile, the performance of the proposed ACA-IQPSO is further demonstrated by the analysis of benchmark functions, it can show that the proposed ACA-IQPSO is significantly better than the other algorithms in searching ability, convergence efficiency and stability. Therefore, the proposed method can provide better preconditions for the subsequent feature extraction and underwater object recognition. It has important theoretical and practical value.
Acknowledgements
The authors are grateful to the guest editors and anonymous reviewers for their constructive comments based on which the presentation of this paper has been greatly improved. This research was supported by the National Natural Science Foundation of China (No.41306086), technology innovation talent special foundation of Harbin (No.2014RFQXJ105). The authors thank LAUREL TECNOLOGIES in Beijing for providing numerous real sonar pictures. Sonar images in Figs 7 and 8 are derived from the Internet, and the URL is “http://www.marinesonic.us/archives.php”. The authors thank the providers for these images.
Author Contributions
X.W., W.H. and Q.L. designed the research project; X.W., W.H. performed experiments; W.H. and Q.L. analyzed data and interpreted results; W.H. prepared figures and drafted manuscript; X.W. and Q.L. supervised the project and approved final version of manuscript.
Competing Interests
The authors declare that they have no competing interests.
Footnotes
Publisher's note: Springer Nature remains neutral with regard to jurisdictional claims in published maps and institutional affiliations.
References
- 1.Wang, X. M., Liu, S., Teng, X. Y., Sun, J. C. & Jiao, J. SFLA with PSO Local Search for detection sonar image. CCC, 3852–3857 (2016).
- 2.Wang L, Ye XF, Wang T. Segmentation algorithm of fuzzy clustering on sidescan sonar image. Huazhong Ligong Daxue Xuebao. 2012;40:25–29. [Google Scholar]
- 3.Mignotte M, Collet C, Perez P, Bouthemy P. Three-class Markovian segmentation of high-resolution sonar image. Comput Vision Image Understanding. 2012;76:191–204. doi: 10.1006/cviu.1999.0804. [DOI] [Google Scholar]
- 4.Ye XF, Zhang YK. Unsupervised sonar image segmentation method based on Markov random field. Harbin Gongcheng Daxue Xuebao. 2015;36:516–521. [Google Scholar]
- 5.Lianantonakis, M. & Petillot, Y. R. Sidescan sonar segmentation using active contours and level set methods. Oceans 2005 Eur., 719–724 (2005).
- 6.Sang, E. F. et al. Sonar Image Segmentation Based on Implicit Active Contours. IEEE Int. Conf., 228–231 (2009).
- 7.Ye XF, Zhang ZH, Liu PX, Guan HL. Sonar image segmentation based on GMRF and level-set models. Ocean Eng. 2010;37:891–901. doi: 10.1016/j.oceaneng.2010.03.003. [DOI] [Google Scholar]
- 8.Wang XM, et al. Narrowband Chan-Vese model of sonar image segmentation: A adaptive ladder initialization approach. Appl. Acoust. 2016;113:238–254. doi: 10.1016/j.apacoust.2016.06.028. [DOI] [Google Scholar]
- 9.Awad NH, Ali MZ, Suganthan PN, Reynolds RG. CADE: A hybridization of Cultural Algorithm and Differential Evolution for numerical optimization. Inf. Sci. 2017;378:215–241. doi: 10.1016/j.ins.2016.10.039. [DOI] [Google Scholar]
- 10.Lu YL, et al. A hybrid multi-objective cultural algorithm for short-term environmental/economic hydrothermal scheduling. Energy Convers. Manage. 2011;52:2121–2134. doi: 10.1016/j.enconman.2010.12.003. [DOI] [Google Scholar]
- 11.Zhou, W. & Bu, Y. P. Cultural Particle Swarm Optimization Algorithm and Its Application. CCDC, 740–744 (2012).
- 12.Awad, N. H., Ali, M. Z. & Duwairi. R. M. Cultural Algorithm with Improved Local Search for Optimization Problems. IEEE CEC, 284–291 (2013).
- 13.Ali MZ, Awad NH. A novel class of niche hybrid Cultural Algorithms for continuous engineering optimization. Inf. Sci. 2014;267:158–190. doi: 10.1016/j.ins.2014.01.002. [DOI] [Google Scholar]
- 14.Liu TY, et al. A new quantum-behaved particle swarm optimization based on cultural evolution mechanism for multiobjective problems. Knowl. Based Syst. 2016;101:90–99. doi: 10.1016/j.knosys.2016.03.009. [DOI] [Google Scholar]
- 15.Sun, J., Feng, B. & Xu, W. B. Particle swarm optimization with particles having quantum behavior. Proc.CEC2004, 325–331 (2004).
- 16.Sun, J., Xu, W. B. & Feng, B. A Global Search Strategy of Quantum-Behaved Particle Swarm Optimization. IEEE Conf. Cybern. Intell. Syst, 111–116 (2004).
- 17.Sun J, et al. Multiple sequence alignment using the Hidden Markov Model trained by an improved quantum-behaved particle swarm optimization. Inf. Sci. 2012;182:93–114. doi: 10.1016/j.ins.2010.11.014. [DOI] [Google Scholar]
- 18.Tian J. Improvement of quantum-behaved particle swarm optimization algorithm for high-dimensional and multi-modal functions. Kongzhi yu Juece/Control Decis. 2016;31:1967–1972. [Google Scholar]
- 19.Becerra RL, Coello CAC. Cultured differential evolution for constrained optimization. Comput. Methods Appl. Mech. Eng. 2006;195:4303–4322. doi: 10.1016/j.cma.2005.09.006. [DOI] [Google Scholar]
- 20.Khodabakhshian A, Hemmati R. Multi-machine power system stabilizer design by using cultural algorithms. Int. J. Electr. Power Energy Syst. 2013;44:571–580. doi: 10.1016/j.ijepes.2012.07.049. [DOI] [Google Scholar]
- 21.Chen CH, Yang SY. Neural fuzzy inference systems with knowledge-based cultural differential evolution for nonlinear system control. Inf. Sci. 2014;270:154–171. doi: 10.1016/j.ins.2014.02.071. [DOI] [Google Scholar]
- 22.Liu WY, Lin CC. Spatial forest resource planning using a cultural algorithm with problem-specific information. Environ Model Softw. 2015;71:126–137. doi: 10.1016/j.envsoft.2015.06.002. [DOI] [Google Scholar]
- 23.Ali MZ, et al. A novel hybrid Cultural Algorithms framework with trajectory-based search for global numerical optimization. Inf. Sci. 2016;334–335:219–249. doi: 10.1016/j.ins.2015.11.032. [DOI] [Google Scholar]
- 24.Ali MZ, Awad NH, Suganthan PN, Reynolds RG. A modified cultural algorithm with a balanced performance for the differential evolution frameworks. Knowl. Based Syst. 2016;111:73–86. doi: 10.1016/j.knosys.2016.08.005. [DOI] [Google Scholar]
- 25.Kumar JV, Kumar DMV. Generation bidding strategy in a pool based electricity market using Shuffled Frog Leaping Algorithm. Appl. Soft Comput. J. 2014;21:407–414. doi: 10.1016/j.asoc.2014.03.027. [DOI] [Google Scholar]
- 26.Shi ZH, et al. A Chinese character structure preserved denoising method for Chinese tablet calligraphy document images based on KSVD dictionary learning. Multimedia Tools Appl. 2017;76:14921–14936. doi: 10.1007/s11042-016-4284-3. [DOI] [Google Scholar]
- 27.Zhang B, et al. Solving inverse problems of radiative heat transfer and phase change in semitransparent medium by using Improved Quantum Particle Swarm Optimization. Int. J. Heat Mass Transf. 2015;85:300–310. doi: 10.1016/j.ijheatmasstransfer.2015.01.140. [DOI] [Google Scholar]
- 28.Wang XM, Liu S, Liu ZP. Underwater Sonar Image Detection: A Combination of Non-local Spatial Information and Quantum-inspired Shuffled Frog Leaping Algorithm. PLOS ONE. 2017;12:1–30. doi: 10.1371/journal.pone.0177666. [DOI] [PMC free article] [PubMed] [Google Scholar]
- 29.Tang DY, Cai YM, Zhao J. A quantum-behaved particle swarm optimization with memetic algorithm and memory for continuous non-linear large scale problems. Inf. Sci. 2014;289:162–189. doi: 10.1016/j.ins.2014.08.030. [DOI] [Google Scholar]
- 30.Derrac J, et al. A practical tutorial on the use of nonparametric statistical tests as a methodology for comparing evolutionary and swarm intelligence algorithms. Swarm Evol. Comput. 2011;1:3–18. doi: 10.1016/j.swevo.2011.02.002. [DOI] [Google Scholar]