SUMMARY
Purpose
Obstructive Sleep Apnea Syndrome (OSAS) is a respiratory disorder characterized by repeated obstructive episodes affecting upper airways.
This study aims at examining the anatomical craniofacial and pharyngeal characteristics of the patient as to identify the obstructive site which triggers the pathologic process.
Correlations between otolaryngologic data observed in the patient and the cephalometric ones for the identification of the obstructive site were also highlighted.
Materials and methods
We worked on a sample of 16 patients, 12 males and 4 females, attended to at the Otolaryngology Operative Unit of Bari University Hospital.
The patients underwent an otolaryngologic (ORL) diagnostic procedure which provided for ApneaGraph (AG) recording, and a dental diagnostic procedure with cephalometric assessment.
Results
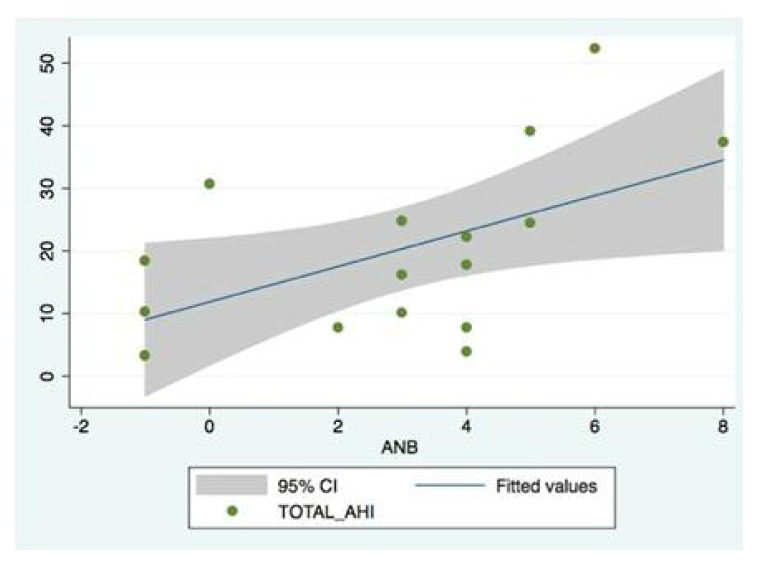
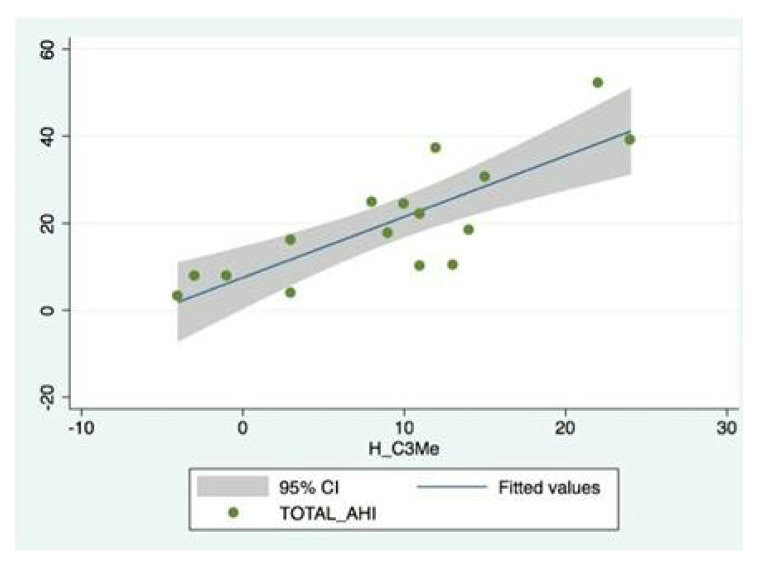
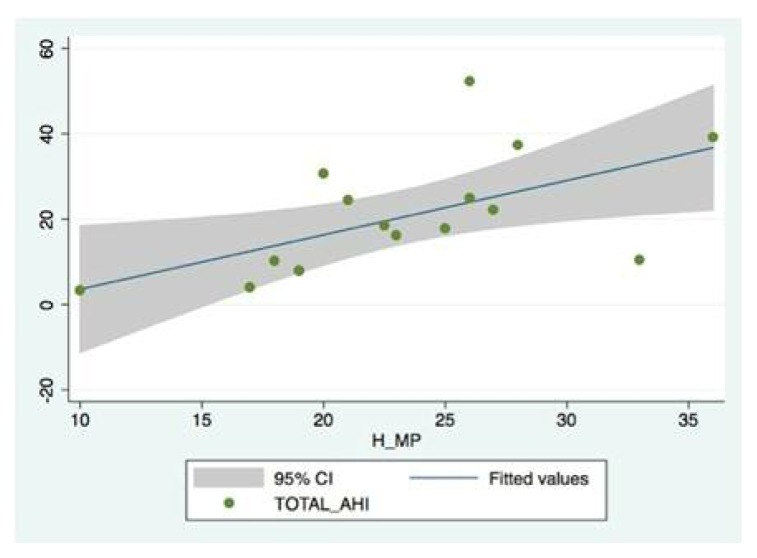
The statistical analysis highlighted a strict correlation between the otolaryngologic value of AHI and the cephalometric values of the ANB angle, with the distance between the hyoid bone and the mandibular plane and with the distance between the hyoid bone and the plane passing between C3 and Me.
Conclusions
We observed a concurrence between the ORL diagnosis of the obstruction level assessed with AG and the cephalometric values regarding respiratory tracts (IPAS and SAS). More precisely, we observed the correlation between the otolaryngologic value of AHI with cephalometric values of the ANB angle, with the distance between hyoid bone and mandibular plan, and with the distance between the hyoid bone and the plane passing between C3 and Me. Furthermore, the identification of the caudal position of the hyoid bone can be considered an alarm bell in the diagnosis of severe OSAS.
Keywords: sleep apnea, cephalometric evaluation, apneagraph, upper airways obstruction
Introduction
OSAS is a respiratory disorder characterized by repeated episodes of apnea and/or hypopnea, occurring during sleep, caused by the obstruction of upper airways (mainly upper airways-VAS), but it is also characterized by diurnal symptoms (sleepiness, fatigue). Obstructions are normally associated with phasic falls of oxygen saturation of blood (1, 2).
Nowadays, most epidemiologic studies define OSAS on the basis of the number of obstructive sleep apnea/hypopnea episodes per hour (AHI) setting a severity cutpoint at a value of 5.15 and 30 sleep episodes per hour to indicate mild, moderate and severe OSAS. The definition of ‘OSA Syndrome’ means a clinical entity characterized by high AHI>30/sleep hour, associated with excessive diurnal sleepiness, arterial hypertension, cardiovascular diseases, stroke, increased frequency of car and work accidents, impaired cognitive abilities with consequent impaired quality of life (3–6).
The prevalence of the syndrome in adult population fluctuates between 2 and 10% showing an increase with age and a male preponderance.
If initially the syndrome was exclusively relevant for neurology because of the relation with sleep phases and the presence of diurnal sleepiness, it has then involved cardiologists, pneumologists, otorhinolaryngologists, maxillofacial surgeons and odontologists, becoming a multi-disciplinarily relevant pathology (7–27).
Since, in most cases, OSAS reveals itself to be a pathology deriving from the obstruction of the airways at the level of the pharynx, our first aim was to study the anatomical craniofacial and pharyngeal characteristics of the patient as to identify the assumed obstructive site triggering the pathologic process.
In addition, our second aim was to assess the existence of a correlation between the values obtained by the otorhinolaryngologist with Apnea-Graph (AG) and those obtained by the odontologist through the cephalometric studio of the latero-lateral X-rays in the search for the obstructive site.
The gold standard investigation for the diagnosis of OSAS is polysomnography (PSG) (28) even though the cardio-respiratory monitoring (AG) is usually sufficient for the diagnosis of OSAS (over 90% of the cases). In dubious cases PSG is opportune (diagnosis of neurologic disorders). As compared to traditional PSG, AG does not provide for the application of thorax and abdominal sensors and it could potentially be done at home with considerable economic saving and a higher compliance for patients. AG is a screening procedure which is well tolerated, safe and with low morbidity, reproducible, sufficiently reliable and, once the initial purchase cost is offset, cheaply and easily manageable (29, 30).
This study is characterized by the assessment of the alterations which can be observed in patients with OSAS associated with high BMI, that is in overweight and obese patients. This is due to the fact that alterations in soft tissues are susceptible to body weight alteration creating anatomical alterations which can affect the obstructive site or sites.
We investigated the identification of new relationships between cephalometric measurements and otolaryngologic values aiming at simplifying diagnostic procedures, making them faster, less expensive and harmful for the patient (think of radiations taken, for instance, with a volumetric tomography) as to identify, as quickly as possible, the obstructive site in order to set a suitable treatment plan.
Materials and methods
The study refers to observations performed on a sample of 20 patients attended to at Otolaryngology Operative Unit of Bari University Hospital. The work covered a time period of about 20 months, from September 2012 to the end of April 2014.
The inclusion criteria were adult (or coinciding with the end of growth) age of the patient, acceptance diagnosis of roncopathy or suspect OSAS, consent to hospitalization, for one night, with ApneaGraph nasogastric tube (cooperation of the patient was necessary), consent to high-resolution radiographic exam and tolerability of the nasogastric tube as to allow the carrying out of the normal physiologic sleep processes.
The exclusion criteria, instead were: non-cooperative patient or in developmental age, refuse to hospitalization, missing tolerability of nasogastric tube with missing capability to fall asleep or reduction of minimum sleep hours to obtain a reliable exam, displacement of the nasogastric tube due to brisk movements, low radiographic quality.
On the basis the aforementioned criteria, 4 patients were excluded, the final sample therefore resulting in a group of 16 patients, 12 males and 4 females of age ranging from 17 and 74 (average 41.5 +/−16.31) (Table 1).
Table 1.
Anthropometric values and patients’ acceptance diagnosis.
| Patient | Age | Sex | BMI | Diagnosis of acceptance |
|---|---|---|---|---|
| 1 | 39 | M | 21,1 | Roncopathy |
| 2 | 44 | M | 20,9 | Roncopathy and hypertrophy ugula |
| 3 | 37 | F | 22,43 | OSAS |
| 4 | 53 | M | 26,9 | Nocturnal snoring and nasal septum deviation |
| 5 | 20 | F | 38 | OSAS and recurrent tonsillitis |
| 6 | 31 | M | 28 | OSAS |
| 7 | 38 | M | 27,5 | Severe OSAS |
| 8 | 74 | M | 28 | Roncopathy |
| 9 | 27 | M | 28,7 | OSAS |
| 10 | 26 | M | 26 | Roncopathy and sleep apnea |
| 11 | 40 | M | 41,2 | OSAS |
| 12 | 60 | M | 31,6 | OSAS |
| 13 | 41 | M | 34,7 | OSAS |
| 14 | 43 | F | 44,9 | OSAS |
| 15 | 17 | M | 39,3 | Post-operative monitoring in patient operated adenotonsillectomy for OSA |
| 16 | 74 | F | 40 | Roncopathy and OSAS |
Patients were informed about all the procedures and signed the consent form provided.
During hospitalization, all the patients underwent otolaryngologic diagnostic procedures including ApneaGraph recording.
Patients were then addressed to the Dentistry Operative Unit in order to carry out a radiographic exam and finally, to the Orthodontics clinic for cephalometric assessment.
The otolaryngologic exam consisted in carrying out anamnesis, objective examination, rhinomanometry, acoustic rhynometry, fibroendoscopy and, finally, ApneaGraph (AG 200 – MRA, Medical Ltd.) with the execution of Muller manoeuvre and the overall exam of the obstructive site of the patient, with following assessment and recording of the saturation, cardiac activity and monitoring of the number of apneas and hypopneas (Table 2).
Table 2.
Main values recorded by AG for each patient.
| Patient | Total AHI | Upper Mixed | Upper Obstr | Upper Obstr Hypo | Lower Mixed | Lower Obstr | Lower Obstr Hypo | Lowest Sao2 (%) |
|---|---|---|---|---|---|---|---|---|
| 1 | 7,71 | 0 | 0 | 13 | 1 | 5 | 24 | 94 |
| 2 | 10,29 | 0 | 0 | 17 | 0 | 3 | 36 | 90 |
| 3 | 3,27 | 0 | 0 | 7 | 0 | 0 | 5 | 92 |
| 4 | 10.00 | 0 | 0 | 12 | 0 | 0 | 31 | 91 |
| 5 | 7,71 | 2 | 3 | 18 | 2 | 2 | 14 | 92 |
| 6 | 17,71 | 0 | 10 | 99 | 0 | 0 | 4 | 88 |
| 7 | 39 | 65 | 80 | 72 | 0 | 1 | 1 | 72 |
| 8 | 24.43 | 0 | 2 | 11 | 0 | 30 | 67 | 85 |
| 9 | 22.14 | 0 | 0 | 15 | 0 | 16 | 64 | 86 |
| 10 | 3,86 | 0 | 1 | 22 | 0 | 0 | 0 | 92 |
| 11 | 52,28 | 4 | 59 | 21 | 0 | 10 | 18 | 56 |
| 12 | 30,57 | 42 | 70 | 25 | 0 | 16 | 30 | 80 |
| 13 | 24,71 | 0 | 8 | 14 | 2 | 47 | 30 | 79 |
| 14 | 16,14 | 0 | 4 | 9 | 0 | 17 | 55 | 87 |
| 15 | 37,29 | 0 | 37 | 174 | 0 | 0 | 0 | 73 |
| 16 | 18,43 | 0 | 3 | 30 | 4 | 6 | 45 | 88 |
AG enabled us to observe obstructive sites, by means of a catheter with temperature and pressure sensors:
pressure transducer for upper airways placed under the soft palate;
sensor for temperature/air flux for upper airways placed in the nasal cavity;
pressure transducer for lower airways placed in the esophageal cavity;
sensor for temperature/air flux for lower airways placed on the base of the tongue.
For the exam of the cephalometric values, a trace on the radiographic picture was drawn by a sole operator.
For what concerns the craniofacial skeletal assessment, we used the parameters as provided by Gianni technique (intermaxillary angle, SNA, SNB, ANB, craniomandibular angle, PC-Go-Gn, S-N-Pog, Ba-S-SNP, SNP-A, SN, Go-Me, Sor-SNA, SNA-Me, Ba-Snp); for the assessment of the space of the upper airways, and in particular, of the lower pharyngeal region, of the dimension of the soft palate and of the position of the hyoid bone in relation to the mandibular plane, we mainly relied on the parameters as provided by Riley (31), Bibby (32) and Baik (33) (Me-C3, H-C3, H-MP, H-C3Me, H-Me, pm-P, pm-UPW, pm-P-NL, P-SNP e PAS, IPAS, SAS, MAS).
From a statistical point of view, the first approach was to elaborate the anthropometric data obtained through the calculation of the mean and the standard deviation for each single value.
Then, for each selected patient a data collection file was filled in (Tables 3–5).
Table 3.
Linear and angular values concerning the craniofacial skeletal structures.
| Patient | Intermaxillary ang | SNA | SNB | ANB | Craniomandibular ang | Snp-a | SN | Go-Me | SOR-SNA | SNA-Me | PcGoGn |
|---|---|---|---|---|---|---|---|---|---|---|---|
| 1 | 14 | 83 | 81 | 2 | 24 | 51 | 71 | 68,5 | 65 | 66 | 118 |
| 2 | 26 | 77 | 78 | −1 | 33 | 46 | 68,5 | 75 | 62 | 70,5 | 121 |
| 3 | 28 | 75 | 76 | −1 | 36 | 50,5 | 75 | 70 | 61 | 77 | 128 |
| 4 | 10,5 | 81 | 78 | 3 | 17,5 | 53 | 75,5 | 85 | 69 | 63 | 111 |
| 5 | 24 | 85 | 81 | 4 | 33 | 49 | 71 | 76 | 62,5 | 67,5 | 125 |
| 6 | 26 | 83 | 79 | 4 | 32 | 53,5 | 75 | 74 | 68 | 73 | 123 |
| 7 | 14 | 77 | 72 | 5 | 25 | 46 | 73 | 65 | 67 | 61 | 115 |
| 8 | 22 | 83 | 78 | 5 | 33 | 55,5 | 74 | 62 | 74 | 71 | 127 |
| 9 | 22 | 84 | 80 | 4 | 31 | 57 | 80 | 91 | 68 | 76 | 122 |
| 10 | 28 | 80 | 76 | 4 | 32,5 | 48 | 67 | 66,5 | 62 | 77 | 123 |
| 11 | 12,5 | 85 | 79 | 6 | 23 | 58 | 70 | 71 | 64 | 69 | 118 |
| 12 | 20 | 77 | 77 | 0 | 30 | 56,5 | 80 | 70 | 70 | 69 | 133 |
| 13 | 18 | 77 | 74 | 3 | 38 | 53 | 78,5 | 66 | 76 | 68,5 | 133 |
| 14 | 31 | 80 | 77 | 3 | 42 | 52 | 72 | 70 | 70 | 79 | 131 |
| 15 | 24 | 89 | 81 | 8 | 31 | 54 | 70 | 74 | 57,5 | 68 | 121 |
| 16 | 7 | 83 | 84 | −1 | 17 | 46 | 69 | 68,5 | 68 | 52 | 119 |
Table 4.
Data about the position of the hyoid bone and soft palate.
| Patient | Iode including bone | C3-ME | HC3 | H-MP | H-C3Me | H-Me | pm-P | pm-UPW | pm-P-NL | SNPog | P-Snp | Ba-Snp | BaSSnp |
|---|---|---|---|---|---|---|---|---|---|---|---|---|---|
| 1 | 1 | 68 | 30 | 19 | −3 | 38 | 41 | 21 | 123 | 80 | 42,5 | 44 | 52 |
| 2 | 0 | 77 | 31 | 33 | 13 | 52 | 41 | 18 | 120 | 80 | 39 | 42 | 52 |
| 3 | 1 | 74 | 32 | 10 | −4 | 41 | 43 | 23 | 120 | 77 | 41,5 | 40 | 59 |
| 4 | 0 | 97 | 51 | 18 | 11 | 48 | 44 | 24 | 122 | 85 | 42 | 51,5 | 62 |
| 5 | 1 | 89 | 40 | 19 | −1 | 41 | 37 | 11 | 124 | 83 | 31 | 45 | 56 |
| 6 | 0 | 89 | 49 | 25 | 9 | 44 | 37 | 21 | 128 | 79 | 32 | 44,5 | 50,5 |
| 7 | 0 | 82 | 47 | 36 | 24 | 36 | 46 | 11 | 125 | 75 | 38 | 45 | 59 |
| 8 | 0 | 68 | 34 | 21 | 10 | 37 | 48 | 23 | 110 | 77 | 41,5 | 47 | 57 |
| 9 | 0 | 84 | 45 | 27 | 11 | 43 | 48 | 24 | 115 | 81 | 44 | 49 | 60 |
| 10 | 0 | 74 | 39 | 17 | 3 | 36 | 40 | 7 | 89 | 76 | 35 | 45 | 58 |
| 11 | 0 | 99 | 48 | 26 | 22 | 60 | 42 | 16 | 130 | 81 | 38,5 | 46 | 64 |
| 12 | 0 | 106 | 50 | 20 | 15 | 61 | 58 | 26 | 127 | 77 | 56 | 54 | 52 |
| 13 | 0 | 86 | 38 | 26 | 8 | 49 | 53 | 19 | 118 | 65 | 50 | 47,5 | 59 |
| 14 | 1 | 83 | 38 | 23 | 3 | 46 | 45 | 22 | 115 | 78 | 40 | 37 | 47 |
| 15 | 0 | 92 | 42 | 28 | 12 | 54 | 41 | 6 | 145 | 82 | 39 | 47,5 | 66 |
| 16 | 0 | 68 | 41 | 22 | 14 | 34 | 43 | 25 | 107 | 87 | 37 | 43 | 50 |
Table 5.
Data about airways.
| Patient | PAS | IPAS | SAS | MAS |
|---|---|---|---|---|
| 1 | 6 | 5,5 | 8 | 5 |
| 2 | 11 | 11 | 10 | 9 |
| 3 | 8 | 6 | 17 | 8 |
| 4 | 19 | 18 | 15 | 16 |
| 5 | 17 | 13 | 14 | 10 |
| 6 | 14 | 14 | 10 | 13 |
| 7 | 5 | 4 | 6 | 5 |
| 8 | 12 | 10 | 9 | 15 |
| 9 | 15 | 15 | 9 | 9 |
| 10 | 14 | 12 | 9 | 9 |
| 11 | 18 | 17 | 11 | 7 |
| 12 | 16 | 14 | 13 | 8 |
| 13 | 13 | 6 | 8 | 8 |
| 14 | 15 | 8 | 8 | 13 |
| 15 | 20 | 19 | 8 | 5 |
| 16 | 5 | 6 | 11 | 5 |
The files were entered in a data base created with File Maker Pro and then processed with Stata MP11 software.
In order to assess the correlation between total AHI per hour and the other measured parameters, the Pearson (ρ) coefficient was calculated performing the hypothesis test with significativity set at p < 0,05.
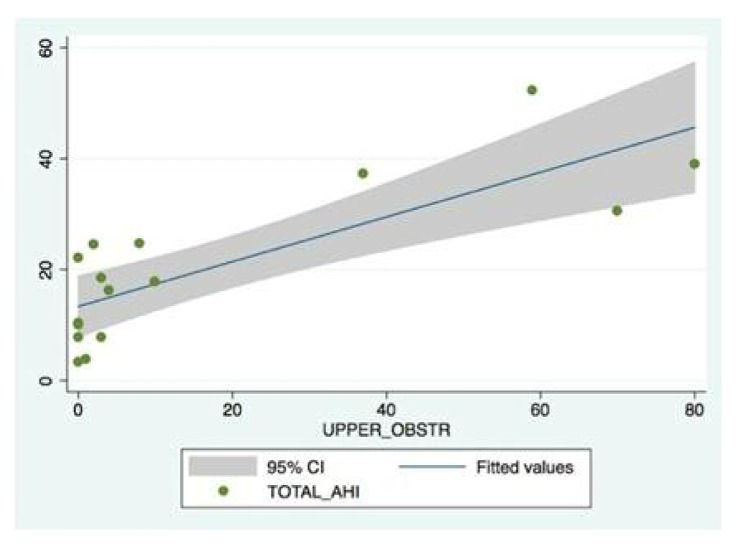
For indicators resulting to be correlated in a statistically significant way, we drew the correlation line with 95% confidence intervals we will analyze later.
The Pearson correlation coefficient was used to identify the correlation variable with total AHI, whereas multivariable regression analyses were created to define the contribution of anthropometric and cephalometric variables in the identification of the pharyngeal obstructive site.
Results
After completing the overall otolaryngologic diagnostic framing, patients were divided in two groups: Simple Snoring Group (SSG) and OSAS Group (OSASG). Simple Snoring Group consisted in 5 patients, 3 males and 2 females whose age ranged between 20 and 53 (average age 38.6+/− 10.81). At AG these patients recorded a AHI value which was not congruous with OSAS diagnosis. OSAS Group (OSASG): 11 patients, 9 males and 2 females whose age ranged between 17 and 74 (average age 45.8 +/− 17.75), who displayed definitive diagnosis of OSAS. In this group we also distinguished patients according to BMI, observing the absence of normal weight patients, and the presence of 5 overweight patients (average BMI= 27.8 +/− 0.97) and 6 obese patients (average BMI = 38.6 +/− 4.18).
For each group, we calculated the mean and standard deviation of data concerning the obstructive site that we obtained from the analysis with AG (Table 6).
Table 6.
Mean and standard deviation of the number of apneas and hypopneas distinguished in upper and lower in the two patient groups.
| Simple Snoring | OSAS | |||
|---|---|---|---|---|
| AVERAGE | D.S. | AVERAGE | D.S. | |
| UPPER-MIXED | 0,4 | 0,8 | 10,09 | 21,07 |
| UPPER-OBSTR | 0,6 | 1,2 | 24,9 | 29,41 |
| UPPER-OBSTR-HYPO | 13,4 | 3,92 | 44,72 | 48,92 |
| LOWER-MIXED | 0,6 | 0,8 | 0,54 | 1,23 |
| LOWER-OBSTR | 2 | 1,89 | 13 | 14,1 |
| LOWER-OBSTR-HYPO | 22 | 11,26 | 28,4 | 26,09 |
| LOWEST-SASO2 | 91,8 | 1,32 | 80,54 | 9,85 |
From the analysis of the obtained data we can observe that the apneas and hypopneas values, both upper and lower, are higher in OSAS patients, whereas the oxygen saturation in this group is considerably reduced.
From the comparison of the patients classified according to BMI, it emerges that in obese individuals the clinic frame is worse due to more frequent apneas and hypopneas, both upper and lower, with impaired oxygen saturation (Table 7). From a strictly dentistry point of view, we calculated the mean and standard deviations of the aforementioned cephalometric values (Table 8). We also calculated mean and standard deviation of cephalometric values of hard tissues and soft tissues in the two subgroups of OSASG, overweight patients and obese patients (Table 9).
Table 7.
Mean and standard deviation of the number of apneas and hypopneas distinguished in upper and lower, in patients with OSAS, distinguished by BMI.
| OSAS with BMI < 30 | OSAS with BMI > 30 | |||
|---|---|---|---|---|
| AVERAGE | D.S. | AVERAGE | D.S. | |
| UPPER-MIXED | 13 | 26 | 7,6 | 15,42 |
| UPPER-OBSTR | 18,6 | 30,9 | 30,16 | 27,01 |
| UPPER-OBSTR-HYPO | 43,8 | 35,27 | 45,5 | 57,87 |
| LOWER-MIXED | 0 | 0 | 1 | 1,52 |
| LOWER-OBSTR | 9,4 | 11,95 | 16 | 15,02 |
| LOWER-OBSTR-HYPO | 27,2 | 31,3 | 29,66 | 17,76 |
| LOWEST-SASO2 | 84,6 | 6,74 | 77,16 | 10,73 |
Table 8.
Mean and standard deviation of the cephalometric values of hard and soft tissues distinguished by the two study groups. The most relevant values in the comparison of the two groups are in bold.
| Simple Snoring | OSAS | |||
|---|---|---|---|---|
| AVERAGE | D.S. | AVERAGE | D.S. | |
| INTERMAXILLARY ANG | 20,4 | 7,08 | 20,36 | 6,85 |
| SNA | 80,2 | 3,7 | 81,63 | 3,64 |
| SNB | 78,8 | 1,93 | 77,9 | 3,14 |
| ANB | 1,4 | 2,05 | 3,72 | 2,41 |
| CRANIOMANDIBULAR ANG | 28,6 | 7,05 | 30,36 | 6,52 |
| SNP-A | 49,8 | 2,31 | 52,54 | 4 |
| SN | 72,4 | 2,65 | 73,54 | 4,33 |
| Go-Me | 74,8 | 5,91 | 70,63 | 7,35 |
| SOR-SNA | 63,8 | 2,92 | 67,63 | 5,05 |
| SNA-Me | 68,6 | 4,75 | 69,36 | 7,3 |
| PC-Go-Gn | 120,66 | 5,88 | 124,09 | 5,85 |
| PAS | 12,2 | 5,03 | 13,36 | 4,47 |
| IPAS | 10,6 | 4,75 | 11,36 | 4,69 |
| SAS | 12,8 | 3,31 | 9,27 | 1,81 |
| MAS | 9,6 | 3,61 | 8,81 | 3,32 |
| C3-Me | 81 | 10,52 | 84,63 | 11,33 |
| H-C3 | 36,8 | 7,93 | 42,81 | 5,05 |
| H-MP | 19,8 | 7,41 | 24,63 | 4,79 |
| H-C3-Me | 3,2 | 7,27 | 11,09 | 6,38 |
| H-Me | 44 | 5,17 | 45,45 | 9,18 |
| MP-P | 41,2 | 2,4 | 45,54 | 5,77 |
| MP-UPW | 19,4 | 4,67 | 18,18 | 6,85 |
| MP-P-NL | 121,8 | 1,6 | 119 | 13,93 |
| S-N-POG | 81 | 2,75 | 78 | 5,22 |
| P-SNP | 39,3 | 3,85 | 40,09 | 6,54 |
| BA-SNP | 44,4 | 3,72 | 45,81 | 3,95 |
| BA-S-SNP | 56,2 | 3,91 | 56,54 | 5,78 |
Table 9.
Mean and standard deviation of the cephalometric values of hard and soft tissues distinguished by the two subgroups of OSASG, overweight patients and obese patients.
| OSAS with BMI < 30 | OSAS with BMI > 30 | |||
|---|---|---|---|---|
| AVERAGE | D.S. | AVERAGE | D.S. | |
| INTERMAXILLARY ANG | 22,4 | 4,8 | 18,6 | 7,78 |
| SNA | 81,4 | 2,57 | 81,8 | 4,33 |
| SNB | 77 | 2,82 | 78,66 | 3,19 |
| ANB | 4,4 | 0,48 | 3,1 | 3,13 |
| CRANIOMANDIBULAR ANG | 30,6 | 2,87 | 30,16 | 8,43 |
| SNP-A | 51,8 | 4,16 | 53,16 | 3,76 |
| SN | 73,8 | 4,16 | 73,33 | 4,45 |
| Go-Me | 71,6 | 10,4 | 69,83 | 2,47 |
| SOR-SNA | 67,8 | 3,81 | 67,5 | 5,88 |
| SNA-Me | 71,6 | 5,71 | 67,5 | 7,93 |
| PC-Go-Gn | 122 | 3,89 | 125,83 | 6,59 |
| PAS | 12 | 3,63 | 14,5 | 4,78 |
| IPAS | 11 | 3,89 | 11,6 | 5,24 |
| SAS | 8,6 | 1,35 | 9,83 | 1,95 |
| MAS | 10,2 | 3,48 | 7,66 | 2,68 |
| C3-Me | 79,4 | 7,47 | 89 | 12,13 |
| H-C3 | 42,8 | 5,52 | 42,81 | 5,05 |
| H-MP | 25,2 | 6,4 | 24,16 | 2,73 |
| H-C3-Me | 11,4 | 6,88 | 12,33 | 5,9 |
| H-Me | 39,2 | 3,54 | 50,66 | 9,19 |
| MP-P | 43,8 | 4,48 | 47 | 6,29 |
| MP-UPW | 17,2 | 6,88 | 19 | 6,73 |
| MP-P-NL | 113,4 | 13,83 | 123,6 | 12,18 |
| S-N-POG | 77,6 | 2,15 | 78,33 | 6,77 |
| P-SNP | 38 | 4,24 | 43,33 | 7,11 |
| BA-SNP | 46 | 1,78 | 45,66 | 5,08 |
| BA-S-SNP | 56,8 | 3,54 | 56,5 | 7,04 |
The statistical analysis highlighted cephalometric variables strictly associated to total AHI value per hour.
From the same statistical analysis, we can observe a strict correlation between the otolaryngologic value of AHI with cephalometric values of ANB angle, with the distance between hyoid bone and mandibular plane and with the distance between hyoid bone and plane passing through C3 and Me (Table 10).
Table 10.
Pearson correlation coefficient of the relationship between AHI and cephalometric and otolaryngologic values.
| Coefficient of correlation (Rho) | p | |
|---|---|---|
| Intermaxillary ang | −0,4431 | 0,0856 |
| Sna | 0,2154 | 0,423 |
| Snb | −0,0312 | 0,9088 |
| → Anb | 0,5232 | 0,0376 |
| Craniomandibular ang | −0,2895 | 0,2768 |
| Snp_a | 0,486 | 0,0563 |
| Sn | 0,1756 | 0,5153 |
| Go_me | −0,1752 | 0,5164 |
| Sor_sna | 0,3045 | 0,2515 |
| Sna_me | −0,2756 | 0,3015 |
| Pcgogn | −0,0996 | 0,7135 |
| Pas | 0,1844 | 0,4943 |
| Ipas | 0,2024 | 0,4523 |
| Sas | −0,3656 | 0,1637 |
| Mas | −0,3605 | 0,1702 |
| → Including bone iode | −0,5954 | 0,015 |
| C3_me | 0,425 | 0,1008 |
| Hc3 | 0,4683 | 0,0673 |
| → H_mp | 0,7178 | 0,0017 |
| → H_c3me | 0,7856 | 0,0003 |
| H_me | 0,381 | 0,1454 |
| Pm_p | 0,4741 | 0,0635 |
| Pm_upw | −0,0649 | 0,8111 |
| Pm_p_nl | 0,4171 | 0,108 |
| Snpog | −0,0909 | 0,7377 |
| P_snp | 0,1444 | 0,5936 |
| Ba_snp | 0,4889 | 0,0546 |
| Bassnp | 0,3198 | 0,2273 |
| Total_ahi | 0,4785 | 0,0608 |
| Upper_mixed | 0,7617 | 0,0006 |
| Upper_obstr | 0,4709 | 0,0656 |
| Upper_obstr_hypo | −0,1539 | 0,5693 |
| Lower_mixed | 0,4081 | 0,1166 |
| Lower_obstr | 0,0486 | 0,858 |
| Lower_obstr_hypo | −0,9705 | 0,000 |
| Lowest_sao2 | −0,4431 | 0,0856 |
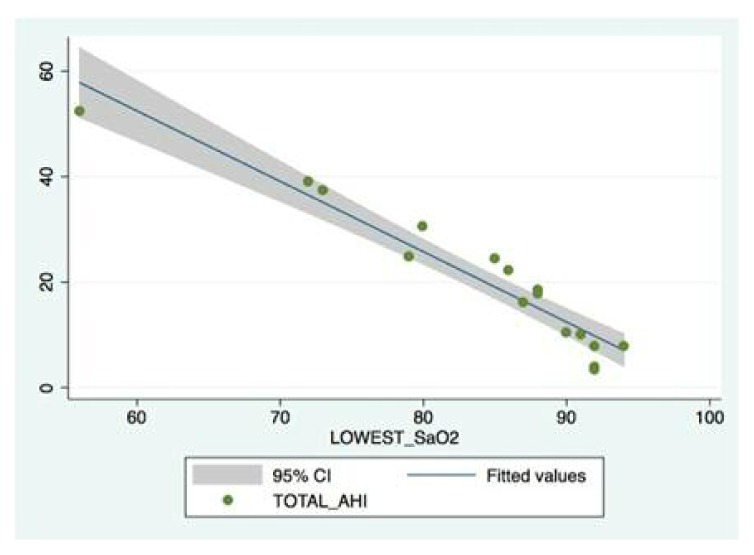
For these indicators, correlated in a more statistically relevant way, we outlined graphs (Figures 1–5).
Figure 1.
Graph about the correlation between AHI and ANB angle. Each patient is represented by a dot.
Figure 2.
Graph about the correlation between AHI and the distance between the hyoid bone and the C3Me line. Directly correlated variables.
Figure 3.
Graph about the correlation between AHI and the distance between the hyoid bone and the mandibular plane. Positively correlates variables.
Figure 4.
Graph about the correlation between AHI and the lowest O2 saturation observed. The two values are inversely correlated with the worsening of the pathology: as AHI increases, O2 saturation decreases.
Figure 5.
Graph about the correlation between AHI and upper apneas. Positively correlated variables.
Any correlation was observed between AHI and other cephalometric values.
The second aim was to highlight the existence of a concordance between ORL diagnosis of the obstruction level detected with AG and the cephalometric values concerning airways (IPAS and SAS) (Table 11).
Table 11.
Correlations in patients with OSAS between obstructive site and percentage of apneas/hypopneas recorded with ApneaGraph.
| PATIENT | TOTAL AHI OF 7h | IPAS | SAS | LOWER | UPPER | % LOWER | % UPPER |
|---|---|---|---|---|---|---|---|
| 6 | 124 | 14 | 10 | 4 | 109 | 3,2 | 87,9 |
| 7 | 273 | 4 | 6 | 2 | 217 | 0,73 | 79,4 |
| 8 | 171 | 10 | 9 | 97 | 13 | 56,7 | 7,6 |
| 9 | 155 | 15 | 9 | 80 | 15 | 51,61 | 9,67 |
| 10 | 27 | 12 | 9 | 0 | 23 | / | 85 |
| 11 | 366 | 17 | 11 | 28 | 84 | 7,65 | 22,9 |
| 12 | 214 | 14 | 13 | 46 | 137 | 21,49 | 64 |
| 13 | 173 | 6 | 8 | 79 | 22 | 45,66 | 45,6 |
| 14 | 113 | 8 | 8 | 72 | 13 | 63,71 | 11,5 |
| 15 | 261 | 19 | 8 | 0 | 211 | / | 80 |
| 16 | 129 | 6 | 11 | 55 | 33 | 42,63 | 25,5 |
| Patients in whom there is no correlation | |||||||
| Patients in which there is a relationship between the high percentage of apneas and hypopneas high with a reduction of the value of the SAS | |||||||
| Patients in which there is a relationship between high percentage of apneas and hypopneas low with a reduction of the value of IPAS | |||||||
Of the 6 patients showing higher percentage of upper apneas and hypopneas, 5 also displayed a reduction of SAS (Table 12).
Table 12.
Concordance between number of apneas/hypopneas observed with AG and SAS measurements.
| PATIENT | SAS | UPPER | % UPPER |
|---|---|---|---|
| 6 | 10 | 109 | 87,9 |
| 7 | 6 | 217 | 79,4 |
| 10 | 9 | 23 | 85 |
| 13 | 8 | 22 | 45,6 |
| 15 | 8 | 211 | 80 |
| 12 | 13 | 137 | 64 |
Of the 5 patients displaying, instead, a higher percentage of lower apneas and hypopneas, 4 also displayed a reduction of IPAS (underlined in Table 13).
Table 13.
Concordance between number of apneas/hypopneas observed with AG and IPAS measurements.
| PATIENT | IPAS | LOWER | % LOWER |
|---|---|---|---|
| 8 | 10 | 97 | 56,7 |
| u | 6 | 79 | 45,66 |
| 14 | 8 | 72 | 63,71 |
| 16 | 6 | 55 | 42,63 |
| 9 | 15 | 80 | 51,61 |
Discussion
Latero-lateral teleradiography was used in this study, as referred in literature, as an indispensable method to assess craniofacial anatomical characteristics of soft tissues and upper airways of patients with OSAS.
Despite this, significant variations may occur in cephalometric values of craniofacial and airway characteristics of patients with obstructive apneas associated with both the nature of the exam and the selection of the sample.
The limiting techniques of teleradiography are based on the phase of the respiratory act in which the X-rays is done and on the position of the patient, standing and not supine, not comparable with the position of the head during night recording as it happens for polysomnography and for AG.
As a result, the position of the soft tissues and the parameters calculated on them are not always 100% concordant because the soft tissues alter their position according to the position taken and the action of gravity.
A further limitation of cephalometry is the bidimensional – not tridimensional - vision of the anatomical structures to study.
In the present study, some parameters which are relevant in literature were for us statistically non-significant. Among these parameters we can enlist, for instance, hyperdivergence, mandibular and maxillary retrognathia and increased thickness of soft palate which, in the present study, were not highlighted as being significant parameters. It cannot always be seen a strict concordance between the single study and what is reported in literature (34, 35).
The cephalometric variables which showed a significant correlation with skeletal and soft tissue alterations in patients with OSAS were: reduced linear value Go-Me indicating hypomandibulism, development of a skeletal open bite highlighted by the alteration of the standard proportion between SNA-Me and SOR-Me (SOR-Me = SNA-Me + 5.6mm in females, SOR-Me = SNA-Me + 11,2 mm in males) in favor of SOR-Me segment, increased PcGpGn angle, increased length of soft palate (Snp-P > 37 mm) and dorsocaudal position of the hyoid bone.
Among the alterations characterizing patients with OSAS, it is important to underline the position of the hyoid bone. This bone, as seen before, has a vital role in the keeping of respiratory space. A correct position of the hyoid bone would enable geniohyoid muscles, genioglossus muscle and extrinsic tongue muscles to carry out a suitable function in keeping first airways accessible and in protruding the tongue in inspiratory acts.
A low and retruded position of the hyoid muscle, instead, could determine a posterior lingual posture engendering a mechanical disadvantage for the activation of the suprahyoid and genioglossus muscles. Such low position of the hyoid bone could also affect the onset of sleep apneas favoring a open-mouth posture and consequent back sliding of mandible and tongue during sleep due to the stretching of mandibular muscles.
The values which indicate the altered position of the hyoid muscle in patients with OSAS are multifarious (for instance the hyoid triangle of Bibby); in the present study we propose what we believe to be easiest to use (also for non-specialists): the analogue of hyoid bone-mandibular plane distance. This is the visual detection of the position, upper or lower, of the hyoid bone in relation to the between Menton/Me and third vertebra (C3) line (35).
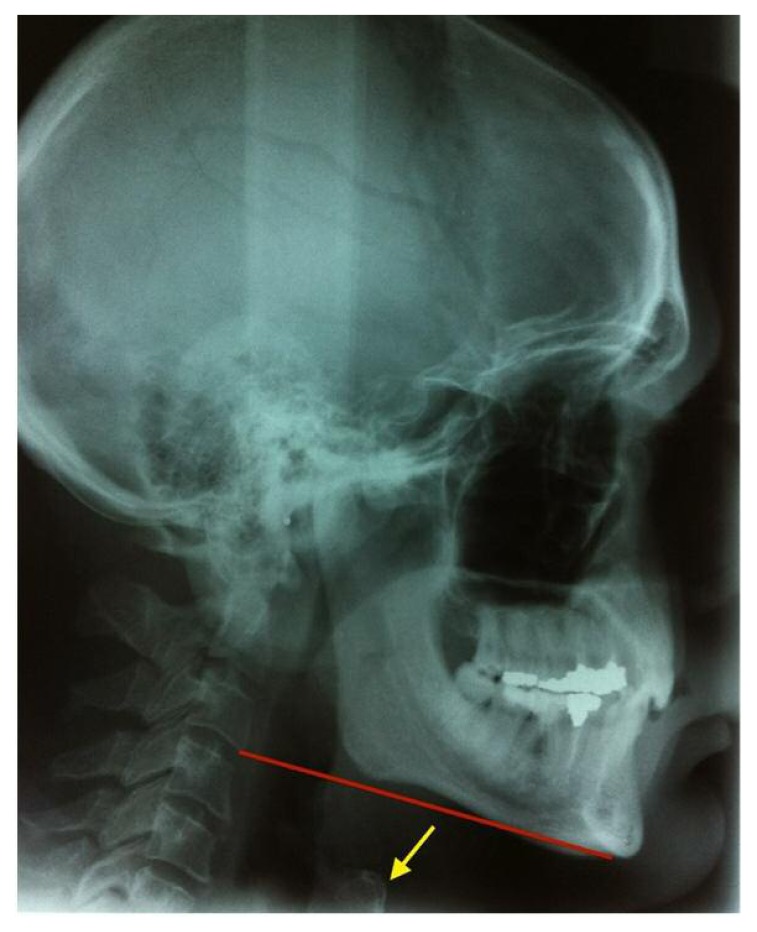
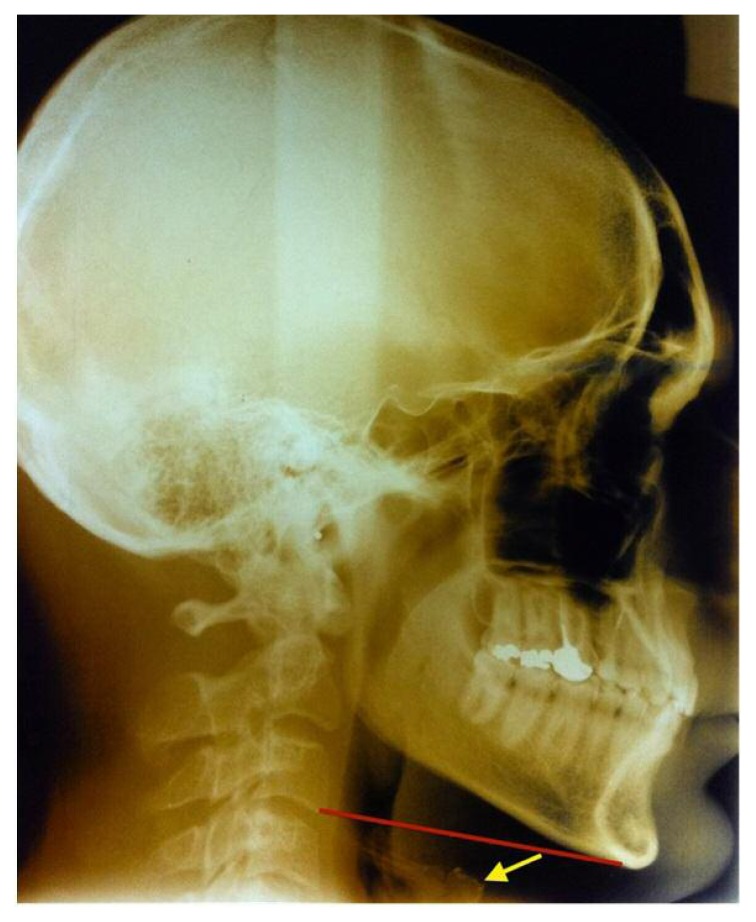
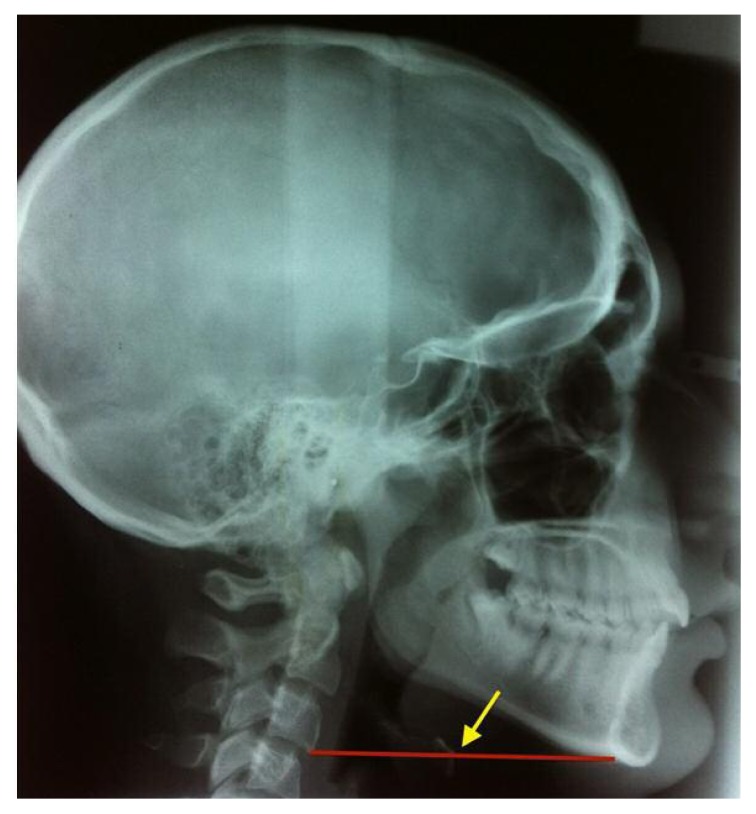
To confirm the data from literature, the 90.9% of our patients with OSAS showed a position of the hyoid bone which was lower than the straight line between Me and C3 (Figures 6, 7), whereas in non-OSAS patients this is strictly related to the straight line (Figure 8).
Figure 6.
OSAS patient (indicated in our study by the number 11) where we observe that the hyoid bone, indicated by the yellow harrow, is located lower than the C3e line, highlighted in red.
Figure 7.
OSAS patient (indicated in our study by the number 9) where we observe that the hyoid bone, indicated by the yellow harrow, is located lower than the C3e line, highlighted in red.
Figure 8.
Simple Snoring patient (indicated in our study by the number 5) where we observe that the hyoid bone, indicated by the yellow arrow, is included in the C3Me line highlighted in red.
Since the characteristics of the craniofacial variables of the soft tissues can differ in patients with and without obesity (18), we also described the morpho-functional alterations which characterize overweight patients with OSAS, always assessing the mean and standard deviations of the values.
The main fluctuations were: distance between Menton and third cervical vertebra (overweight OSAS: 79.4 +/− 7.47; obese OSAS: 89+/−12.13), distance between Menton and hyoid bone (overweight OSAS: 39.2+/− 3.54; obese OSAS: 50.66+/− 9.19) and the vertical position of soft palate which can be highlighted by the exam of the angle between the nasal line (NL o spinal plane) and the straight line given by the intersection between pm and P: (overweight OSAS: 113.4+/− 13.83; obese OSAS: 123.6+/−12.18).
We could also highlight that in obese OSAS patients there is a significant decrease of O2 saturation and about a doubling of the number of apneas recognized as low.
Conclusions
The identification of the caudal position of the hyoid bone in relation to the straight line can be considered an alarm bell in the diagnosis of severe OSAS, when immediately highlighted. It is also true that so far it has not been possible to understand if this position of the hyoid bone is the cause or the consequence of OSAS yet.
When MP-H is > 20, and so the hyoid bone is below the C34Me line and when we have IPAS < 11 mm and SAS < 13 mm, the chance or the risk for OSAS dramatically increases (35).
For what concerns the second aim of the study, to highlight the existence of a concordance between ORL diagnosis of the level of obstruction observed with ApneaGraph and the cephalometric values about airways (IPAS and SAS), our results, even though statistically non-relevant, deserve further study. In fact, of the 6 patients displaying higher percentage of upper apneas and hypopneas, 5 of them also showed a reduction in SAS; of the 5 patients with a higher percentage of lower apneas and hypopneas, 4 of them also showed reduced IPAS.
These values are in line with literature which demonstrates the relevance of the obtained data (36).
Our future aim will be to increase the number of patients in both groups as to confirm these preliminary data and follow our patients after the execution of the treatment plan, both surgical and medical, after the multidisciplinary identification of the obstruction site.
References
- 1.Burwell C, Robin E, Whaley R, Bickelmann A. Extreme obesity associated with alveolar Hypoventilation-a pickwickian syndrome. Am J Med. 1956;21:811–8. doi: 10.1016/0002-9343(56)90094-8. [DOI] [PubMed] [Google Scholar]
- 2.Lugaresi E, Coccagna G, Mantovani M, Cirignotta F, Ambrosetto G, Baturic B. Hypersomnia with periodic breathing: periodic apneas and alveolar hypoventilation during sleep. Bull Physio-Path Resp. 1972;8:1103–1113. [PubMed] [Google Scholar]
- 3.Gastaut H, Tassinari CA, Duron B. Etude polygraphique de manifestation episodique hypnique et respiratorie diures et nocturnes du syndrome de Pickwick. Rev Neurol. 1965;112:568–79. [PubMed] [Google Scholar]
- 4.Guilleminnault C, Tilkian A, Dement WC. The sleep apnea syndromes. Annu Rev Med. 1976;27:465–84. doi: 10.1146/annurev.me.27.020176.002341. [DOI] [PubMed] [Google Scholar]
- 5.Young T, Peppard PE, Gottlieb D. Epidemiology of obstructive sleep apnea: a population health perspective. Am J Respir Crit Care Med. 2002;165:1217–1239. doi: 10.1164/rccm.2109080. [DOI] [PubMed] [Google Scholar]
- 6.Partinem M, Hublin CH. Epidemiology of sleep disorders. In: Kryger MH, Roth TH, Dement W, editors. Principles and practice of sleep medicine. Third edition. Philadelphia: W.B. Saunders; 2000. pp. 588–579. [Google Scholar]
- 7.Di Venere D, Corsalini M, Stefanachi G, Tafuri S, De Tommaso M, Cervinara F, Re A, Pettini F. Quality of life in fibromyalgia patients with craniomandibular disorders. Open Dent J. 2015 Jan 30;9:9–14. doi: 10.2174/1874210601509010009. [DOI] [PMC free article] [PubMed] [Google Scholar]
- 8.Favia G, Corsalini M, Di Venere D, Pettini F, Favia G, Capodiferro S, Maiorano E. Immunohistochemical evaluation of neuroreceptors in healthy and pathological temporo-mandibular joint. Int J Med Sci. 2013 Sep 25;10(12):1698–701. doi: 10.7150/ijms.6315. [DOI] [PMC free article] [PubMed] [Google Scholar]
- 9.Scarano A, Nardi G, Murmura G, Rapani M, Mortellaro C. Evaluation of the Removal Bacteria on Failed Titanium Implants After Irradiation With Erbium-Doped Yttrium Aluminium Garnet Laser. J Craniofac Surg. 2016 Jul;27(5):1202–4. doi: 10.1097/SCS.0000000000002735. [DOI] [PubMed] [Google Scholar]
- 10.Di Venere D, Gaudio RM, Laforgia A, Stefanachi G, Tafuri S, Pettini F, Silvestre F, Petruzzi M, Corsalini M. Correlation between dento-skeletal characteristics and craniomandibular disorders in growing children and adolescent orthodontic patients: retrospective case-control study. Oral Implantol (Rome) 2016 Nov 16;9(4):175–184. doi: 10.11138/orl/2016.9.4.175. [DOI] [PMC free article] [PubMed] [Google Scholar]
- 11.Grassi FR, Pappalettere C, Di Comite M, Corsalini M, Mori G, Ballini A, Crincoli V, Pettini F, Rapone B, Boccaccio A. Effect of different irrigating solutions and endodontic sealers on bond strength of the dentin-post interface with and without defects. Int J Med Sci. 2012;9(8):642–54. doi: 10.7150/ijms.4998. [DOI] [PMC free article] [PubMed] [Google Scholar]
- 12.Di Comite M, Crincoli V, Fatone L, Ballini A, Mori G, Rapone B, Boccaccio A, Pappalettere C, Grassi FR, Favia A. Quantitative analysis of defects at the dentinpost space in endodontically treated teeth. Materials. 2015;8:3268–3283. [Google Scholar]
- 13.Corsalini M, Pettini F, Di Venere D, Ballini A, Chiatante G, Lamberti L, Pappalettere C, Fiorentino M, Uva AE, Monno G, Boccaccio A. An Optical System to Monitor the Displacement Field of Glass-fibre Posts Subjected to Thermal Loading. Open Dent J. 2016 Nov 16;10:610–618. doi: 10.2174/1874210601610010610. [DOI] [PMC free article] [PubMed] [Google Scholar]
- 14.Corsalini M, Di Venere D, Pettini F, Stefanachi G, Catapano S, Boccaccio A, Lamberti L, Pappalettere C, Carossa S. A comparison of shear bond strength of ceramic and resin denture teeth on different acrylic resin bases. Open Dent J. 2014 Dec 29;8:241–50. doi: 10.2174/1874210601408010241. [DOI] [PMC free article] [PubMed] [Google Scholar]
- 15.Pettini F, Savino M, Corsalini M, Cantore S, Ballini A. Cytogenetic genotoxic investigation in peripheral blood lymphocytes of subjects with dental composite restorative filling materials. J Biol Regul Homeost Agents. 2015 Jan-Mar;29(1):229. [PubMed] [Google Scholar]
- 16.Pettini F, Corsalini M, Savino MG, Stefanachi G, Venere DD, Pappalettere C, Monno G, Boccaccio A. Roughness Analysis on Composite Materials (Microfilled, Nanofilled and Silorane) After Different Finishing and Polishing Procedures. Open Dent J. 2015 Oct 26;9:357–67. doi: 10.2174/1874210601509010357. [DOI] [PMC free article] [PubMed] [Google Scholar]
- 17.Romeo U, Nardi GM, Libotte F, Sabatini S, Palaia G, Grassi FR. The Antimicrobial Photodynamic Therapy in the Treatment of Peri-Implantitis. Int J Dent. 2016;2016:7692387. doi: 10.1155/2016/7692387. [DOI] [PMC free article] [PubMed] [Google Scholar]
- 18.Lauritano D, Petruzzi M, Nardi GM, Carinci F, Minervini G, Di Stasio D, Lucchese A. Single application of a dessicating agent in the treatment of recurrent aphtous stomatitis. J Biol Regul Homeost Agents. 2015 Jul-Sep;29(3 Suppl 1):59–66. [PubMed] [Google Scholar]
- 19.Kalemaj Z, Scarano A, Valbonetti L, Rapone B, Grassi FR. Bone response to four dental implants with different surface topography: a histologic and histometric study in minipigs. Int J Periodontics Restorative Dent. 2016 Sep-Oct;36(5):745–54. doi: 10.11607/prd.2719. [DOI] [PubMed] [Google Scholar]
- 20.Laforgia A, Corsalini M, Stefanachi G, Pettini F, Di Venere D. Assessment of Psychopatologic Traits in a Group of Patients with Adult Chronic Periodontitis: Study on 108 Cases and Analysis of Compliance during and after Periodontal Treatment. Int J Med Sci. 2015 Oct 4;12(10):832–9. doi: 10.7150/ijms.12317. [DOI] [PMC free article] [PubMed] [Google Scholar]
- 21.Rapone B, Nardi GM, Di Venere D, Pettini F, Grassi FR, Corsalini M. Oral hygiene in patients with oral cancer undergoing chemotherapy and/or radiotherapy after prosthesis rehabilitation: protocol proposal. Oral Implantol (Rome) 2016 Dic;9(01 suppl):90–97. doi: 10.11138/orl/2016.9.1S.090. [DOI] [PMC free article] [PubMed] [Google Scholar]
- 22.Nardi GM, Sabatini S, Lauritano D, Silvestre F, Petruzzi M. Effectiveness of two different desensitizing varnishes in reducing tooth sensitivity: a randomized double-blind clinical trial. Oral Implantol (Rome) 2016 Nov 16;9(4):185–189. doi: 10.11138/orl/2016.9.4.185. [DOI] [PMC free article] [PubMed] [Google Scholar]
- 23.Corsalini M, Rapone B, Grassi FR, Di Venere D. A study on oral rehabilitation in stroke patients: analysis of a group of 33 patients. Gerodontology. 2010 Sep;27(3):178–82. doi: 10.1111/j.1741-2358.2009.00322.x. [DOI] [PubMed] [Google Scholar]
- 24.Di Venere D, Pettini F, Nardi GM, Laforgia A, Stefanachi G, Notaro V, Rapone B, Grassi FR, Corsalini M. Correlation between parodontal indexes and orthodontic retainers: prospective study in a group of 16 patients. Oral Implantology. 2017 Apr 10;10(1):78–86. doi: 10.11138/orl/2017.10.1.078. eCollection 2017 Jan–Mar. [DOI] [PMC free article] [PubMed] [Google Scholar]
- 25.Mori G, Ballini A, Carbone C, Oranger A, Brunetti G, Di Benedetto A, Rapone B, Cantore S, Di Comite M, Colucci S, Grano M, Grassi FR. Osteogenic differentiation of dental follicle stem cells. Int J Med Sci. 2012;9(6):480–7. doi: 10.7150/ijms.4583. Epub 2012 Aug 13. [DOI] [PMC free article] [PubMed] [Google Scholar]
- 26.Ballini A, Cantore S, Fatone L, Montenegro V, De Vito D, Pettini F, Crincoli V, Antelmi A, Romita P, Rapone B, Miniello G, Perillo L, Grassi FR, Foti C. Transmission of non-viral sexually transmitted infections and oral sex. Journal of Sexual Medicine. 2012 Feb;9(2):372–84. doi: 10.1111/j.1743-6109.2011.02515.x. Epub 2011 Oct 24. [DOI] [PubMed] [Google Scholar]
- 27.Corsalini M, Di Venere D, Rapone B, Stefanachi G, Laforgia A, Pettini F. Evidence of signs and symptoms of Craniomandibular Disorders in Fibromyalgia patients. The Open Dent Journal. 2017;11:91–98. doi: 10.2174/1874210601711010091. Published online 2017 Feb 14. [DOI] [PMC free article] [PubMed] [Google Scholar]
- 28.Epstein LJ, Kristo D, Strollo PJ, Jr, Friedman N, Malhotra A, Patil SP, Ramar K, Rogers R, Schwab RJ, Weaver EM, Weinstein MD. Adult Obstructive Sleep Apnea Task Force of the American Academy of Sleep Medicine. Clinical Guideline for the Evaluation, Management and Long-Term Care of Obstructive Sleep Apnea in Adults. J Clin Sleep Med. 2009;5(3):263. [PMC free article] [PubMed] [Google Scholar]
- 29.Morales Divo C, Selivanova O, Mewes T, Gosepath J, Lippold R, Mann WJ. Polysomnography and Apnea-Graph in patients with sleep-related breathing disorders. J Otorhinolaryngol Relat Spec. 2009;71(1):27–31. doi: 10.1159/000165683. [DOI] [PubMed] [Google Scholar]
- 30.Singh A, Al-Reefy H, Hewitt R, Kotecha B. Evaluation of ApneaGraph in the diagnosis of sleep-related breathing disorders. Eur Arch Otorhinolaryngol. 2008;265(12):1489–94. doi: 10.1007/s00405-008-0685-x. [DOI] [PubMed] [Google Scholar]
- 31.Linder-Aronson S. Adenoids: their effects on made of breathing and nasal airflow and their relationship to the facial skeleton and the dentition. Acta Otolaryngol. 1970;65:265–70. [PubMed] [Google Scholar]
- 32.Bibby RE, Preston CB. The hyoid triangle. Am J Orthod. 1981;80:92–7. doi: 10.1016/0002-9416(81)90199-8. [DOI] [PubMed] [Google Scholar]
- 33.Baik UB, Suzuki M, Ikeda K, Sugawara J, Mitani H. Relationship Between Cephalometric Characteristics and Obstructive Sites in Obstructive Sleep Apnea Syndrome. Angle Orthod. 2002;72(2):124–34. doi: 10.1043/0003-3219(2002)072<0124:RBCCAO>2.0.CO;2. [DOI] [PubMed] [Google Scholar]
- 34.Banhiran W, Wanichakorntrakul P, Metheetrairut C, Chiewvit P, Planuphap W. Lateral cephalometric analysis and risks of moderate to severe obstructive sleep-disordered breathing in Thai patients. Sleep Breath. 2013;17:1249–55. doi: 10.1007/s11325-013-0830-7. [DOI] [PubMed] [Google Scholar]
- 35.Hung-Huey, Ho Ching-Yin, Lee Pei-Lin, Tan Ching-Ting. Cephalometric Analysis of Nonobese Snorers Either with or without Obstructive Sleep Apnea Syndrome. Angle Orthod. 2007;77(6):1054–61. doi: 10.2319/112106-477.1. [DOI] [PubMed] [Google Scholar]
- 36.Zhou CY, Dai ZY, Li YF, Wen YL, Zong L, Zhang H. Correlation study obstructive level diagnosed by Apnea Graph and cephalometric posterior airway space in obstructive sleep apnea Hypopnea Syndrome. Zhonghua Er Bi Yan Hou Tou Jing Wai Ke Za Zhi. 2011;46(8):617–21. [PubMed] [Google Scholar]


