

Abstract
Cellular responses are mediated by heterogeneous intermediate signals that are secreted and sensed by the same cells. Cell-to-cell communication through these intermediate signals likely affects the collective response of cells within a population. We combined multiplexed, microwell-based measurements of cytokine secretion by single cells with data from the analysis of cell populations to determine the role of paracrine signaling in shaping the profile of inflammatory cytokines secreted by macrophages in response to the stimulation of Toll-like receptor 4 (TLR4) with lipopolysaccharide (LPS). Loss of paracrine signaling as a result of cell isolation substantially reduced the secretion of a subset of LPS-stimulated cytokines, including interleukin-6 (IL-6) and IL-10, by macrophage-like U937 cells and human monocyte-derived macrophages (MDMs). Graphical Gaussian modeling (GGM) of the single-cell data defined a regulatory network of paracrine signals, which was validated experimentally in the population through antibody-mediated neutralization of individual cytokines. Tumor necrosis factor-α (TNF-α) was identified as the most influential cytokine in the GGM network, and our data suggest that paracrine signaling from a small subpopulation of “high-secreting” cells, which generated most of the TNF-α produced, was necessary but not sufficient to achieve high secretion of IL-6 and IL-10 in the cell population. Decreased IL-10 secretion in isolated MDMs was linked to increased TNF-α secretion, suggesting that inhibition of the inflammatory response also depends on paracrine signaling. Our results reveal a previously uncharacterized role for cell-to-cell communication within a population in coordinating a rapid and reliable innate immune response in spite of underlying cell-to-cell heterogeneity.
Introduction
Cell populations produce reliable biological responses despite exhibiting considerable amounts of cell-to-cell heterogeneity (1–3). These biological responses often involve intermediate extracellular signaling, through which cells secrete and respond to the same factor (4–6). Intermediate extracellular signals may act in an autocrine manner, in which a cell responds to its own secreted signal, or in a paracrine manner, in which a neighboring cell responds to the secreted signal. However, because secretion is usually measured in populations of cells, the role of paracrine versus autocrine signaling in shaping the response of a cell population is difficult to quantify.
Several studies showed that the secretion of cytokines from T cells (7, 8) and the activation of cells by cytokines after stimulation of an innate immune pathway are highly heterogeneous (9, 10). For example, the production of interferon β (IFN-β) in response to viral infection appears to be stochastic, despite a high incidence of infection (9, 11). Microfluidic and nanowell devices that characterize cells in solitary confinement have enabled quantitative and multiplexed measurements of single-cell secretion of cytokines to be made (12, 13), but such assays may not accurately reflect phenotypes that result from the integration of both autocrine and paracrine signals in cell populations over time (14). However, the extent to which cell isolation (and the resulting loss of paracrine signaling) alters cytokine secretion by a population of cells has not been widely explored.
Here, we investigated how paracrine signaling contributed to the response of a population of human macrophages. Monocytes and macrophages function in relative isolation while circulating in the blood, whereas they operate in crowded populations (equivalent to cell culture densities of > 1 million cells per milliliter) when they infiltrate tissues in response to infection (15, 16). Therefore, differences in “single-cell” versus “cell-population” secretion response signatures are expected to have important biological implications. Toll-like receptors (TLRs) are pattern recognition receptors (PRRs) that provide a first line of defense against pathogens and shape the adaptive immune response (17). Lipopolysaccharide (LPS), a component of gram-negative bacteria and the canonical ligand for TLR4, activates the secretion of a large panel of chemokines, including chemokine (C-C) motif ligand 4 (CCL4) [also known as macrophage inflammatory protein 1β (MIP-1β)], interleukin-8 (IL-8), and CCL5 [also known as regulated on activation, normal T cell expressed and secreted (RANTES)]; pro-inflammatory cytokines, including tumor necrosis factor-α (TNF-α), IL-1β, and IL-6; and anti-inflammatory cytokines, including IL-10. There is evidence that both autocrine and paracrine modes of signaling are involved in shaping the response to TLR4 stimulation (18–23).
To study the role of paracrine signaling in the LPS-stimulated response, we used a single-cell barcode chip (SCBC) (fig. S1) (13) to measure cytokine secretion profiles in isolated single U937 cells and human monocyte-derived macrophages (MDMs), and compared them to measurements of cytokines secreted by cell populations. We found that paracrine signaling substantially amplified the secretion of a subset of LPS-stimulated cytokines at the population level, including IL-6 and IL-10. Using graphical Gaussian modeling (GGM) to reconstruct cytokine interactions based on partial correlations within the single-cell secretion data set, we identified TNF-α and other key signals contributing to the cell-population secretion of the paracrine-dependent cytokines by U937 cells and primary MDMs. Finally, we demonstrated that paracrine signaling, in addition to amplifying the overall secretion response, was also required for the inhibition of the secretion of TNF-α and other pro-inflammatory cytokines in MDMs. Overall, our study demonstrates that combining single-cell and cell-population measurements is an effective way to decouple primary and paracrine-dependent signaling cascades.
Results
Secretion of a subset of LPS-induced cytokines is substantially attenuated in isolated single cells because of a loss of paracrine signaling
To investigate how the cytokine secretion signatures of single cells (autocrine only) differed from those of cells within a population (Fig. 1A), we focused on stimulation of the monocytic U937 cell line with LPS. To eliminate paracrine signaling, we isolated single cells in polydimethylsiloxane (PDMS) microchambers and sealed the wells with glass slides patterned with capture antibodies specific for the secreted targets of interest (referred to as the SCBC; fig. S1) (13). The U937 cells were first induced to differentiate into a macrophage-like state in culture with phorbol myristate acetate (PMA) to render the cells post-mitotic and thus minimize contributions of the cell cycle to intercellular heterogeneity. After the cells had undergone differentiation, they were lifted from the plates, incubated with LPS or vehicle, and then either cultured as isolated cells in the SCBC or cultured as a population in a tissue culture plate. We used a standard cell density of 500,000 cells/ml, which is approximately equivalent to the per-cell volume in the SCBC (2 nl per cell). We measured the abundances in the cell culture medium of 8 cytokines whose secretion is stimulated by LPS: CCL4, CCL5, granulocyte macrophage colony-stimulating factor (GM-CSF), IL-1β, IL-6, IL-8, IL-10, and TNF-α. Note that all of these ligands can stimulate the secretion of one or more of the other cytokines by monocytes, macrophages, or other cell types (table S1).
Fig. 1. Loss of paracrine signaling in isolated single cells attenuates the LPS-stimulated secretion of some cytokines.

(A) LPS-induced inflammatory responses may be altered between cell populations (left) and isolated cells (right) because of the loss of paracrine signaling among isolated cells. (B) Intensities (arbitrary fluorescence units, AFU) of the indicated proteins secreted from single U937 cells treated with vehicle control (blue; n = 586 cells) or LPS for 20 hours (red; n = 601 cells) from one experiment that is representative of two or four independent experiments for control and LPS, respectively. The background threshold (BT) for each protein (black line) is calculated based on the zero-cell wells (see the Materials and Methods). The percentages of cells with secretion intensities above the BT are indicated. *P < 0.05 by Bonferroni-corrected Wilcoxon-Mann-Whitney test. (C) Comparison of the concentrations of the indicated secreted proteins in the culture medium of the cell population (plate) and the average concentration of all single cells cultured in the SCBC (Σ SC) for vehicle-treated (blue) and LPS-treated (red) cells. The protein concentrations in the culture medium of the cell population were measured by ELISA and are means ± standard error of the mean (SEM) of at least three biological replicates. Single-cell secretion intensities were converted to concentrations based on recombinant protein standard curves (fig. S3, and see the Materials and Methods), and concentrations for cells with intensities below the BT were set to zero. Values are means ± SEM of two (control) or four (LPS) biological replicates. **P < 0.05 by t test.
Single cells were stimulated with LPS (100 ng/ml) and then cultured in the SCBC for 20 hours. Secretion abundance in the SCBC was measured by the intensity of a fluorogenic reporter following a sandwich immunoassay, and the background threshold for secretion was calculated by evaluating the secretion intensity in the wells containing no cells (fig. S1 and see the Materials and Methods). LPS-stimulated cells secreted significantly more of the cytokines tested, except for IL-1β, than did vehicle-treated cells (Fig. 1B). LPS increased both the mean secretion intensity and the percentage of cells that secreted more than the background threshold in the SCBC. Greater than 60% of cells secreted more than the background threshold of IL-8, CCL4, or CCL5. Greater than 30% of the cells secreted TNF-α or IL-10, but less than 20% of cells secreted IL-1β, IL-6, or GM-CSF (Fig. 1B). Despite the relatively low percentages of cytokine-secreting cells, there were at least a few cells that secreted large amounts of all of the cytokines measured; that is, these cells produced cytokines with measured fluorescence intensities that were at least three orders of magnitude greater than the background amounts. To confirm the percentages of cells that secreted cytokines, we analyzed the single-cell preparations by flow cytometry. In this assay, cytokine secretion was blocked by Brefeldin A to permit quantification of the accumulated intracellular cytokines. The percentages of cells that produced cytokines were similar between the two assays (fig. S2), and therefore we conclude that the relatively small percentage of cells that secreted some cytokines was not a result of the sensitivity or format of the SCBC assay.
To quantify differences in cytokine secretion between the cell population and the cells isolated in the SCBC, we converted the intensity values measured in the SCBC to cytokine concentrations through recombinant protein curves (fig. S3 and see the Materials and Methods). The average concentration of each cytokine in the SCBC could be directly compared to the concentration in the cell culture plate because the volume per cell was approximately equal in both formats. The effect of cell isolation on total secretion varied for different cytokines. The amounts of IL-6 and IL-10 secreted in the SCBC were approximately 10-fold lower than those in the cell population (Fig. 1C), despite the presence of a sub-population of isolated single cells that secreted relatively large amounts of these cytokines (Fig. 1B). The amounts of secreted CCL4, GM-CSF, and IL-8 in the SCBC were 1.5- to 4-fold lower than those in the cell population, although only the reduction in the amounts of secreted IL-8 was statistically significantly different (Fig. 1C). In contrast, the amounts of LPS-stimulated CCL5, IL-1β, and TNF-α that were secreted by cells in the SCBC were comparable to those secreted by cells in the population. Note that in the vehicle-treated SCBC control, the amounts of secreted TNF-α, IL-1β, and CCL4 were greater than those in the vehicle-treated cell population, whereas the amount of secreted IL-10 was lower (Fig. 1C), which may have been caused by the loss of paracrine signals, a reaction to culture on the PDMS, or some other factor. The statistically significant differences between the amounts of cytokines secreted by the cultured cell population and the SCBC “population” of isolated cells did not change when we included secretion by cells below the background threshold, demonstrating that our results were not dependent on how we set the threshold for secreting cells (fig. S4). Overall, our results showed that the LPS-stimulated secretion of some cytokines, including CCL5, IL-1β, and TNF-α, was unaffected by the loss of paracrine signaling, whereas for IL-6 and IL-10, the isolation of cells in the SCBC substantially attenuated the amounts secreted compared to those secreted by cells in the population.
To test for a dependency on paracrine signals from neighboring cells within a different format, we reduced the cell density five-fold and used ELISA to measure the amounts of cytokines secreted by the cell population. We found that the LPS-stimulated secretion of CCL4, CCL5, IL-1β, and IL-8 was not markedly dependent on cell density, whereas the amounts of GM-CSF, IL-6, IL-10, and TNF-α secreted per cell were all substantially reduced when the cell density was decreased five-fold (fig. S5). This dependence on cell density was consistent with the largest fold-changes in cytokine secretion observed between the SCBC and plate-based assays, except in the case of TNF-α (Fig. 1C). Thus, we conclude that the cytokines that exhibited attenuated secretion when cells were isolated in the SCBC (that is, IL-6, IL-10, and, to a lesser extent, GM-CSF) were at least partly dependent on paracrine signaling for maximal secretion in the cell population.
Isolated single cells demonstrate altered secretion patterns over time as compared to cells in a cultured population
We next collected single-cell experimental data at 4 and 8 hours, in addition to 20 hours, after LPS stimulation to determine whether changes in cytokine secretion by isolated cells were apparent at earlier time points. For each cytokine, we compared the average secretion for all single cells in the SCBC with the average secretion in the cell population (Fig. 2A). We further examined the average concentration of each cytokine secreted by the subpopulation of secreting cells (that is, only cells with intensities above the background threshold for the indicated cytokine) over time (Fig. 2B). We observed additional changes in cytokine secretion over time that were not apparent at 20 hours. Specifically, we observed an increase in the secretion of IL-1β at 4 and 8 hours in the SCBC that was not detected in the cell population, possibly because of uptake of the cytokine by other cells (22). The secreted IL-1β was produced by a small percentage of cells within 4 hours of LPS stimulation (Fig. 2B). In contrast, the secretion of CCL5, IL-8, and TNF-α in the SCBC was similar to that in the cell population at 4, 8, and 20 hours, with a steady increase in the average amount of each cytokine produced by secreting cells.
Fig. 2. Isolated single cells show altered cytokine secretion patterns over time as compared to those of cells in a population.

(A) Comparison of the concentrations of the indicated proteins secreted by cells in a population (black) and the average concentration of secreted proteins of all single cells cultured in the SCBC (red) in response to treatment with LPS for the indicated times. Fluorescence intensities for the secreted proteins were converted to concentrations as described earlier and include all cells above the detection threshold (DT) even if they were below the BT (as in fig. S4). Time courses were compared by two-factor analysis of variance (ANOVA). *P < 0.05. **P < 0.01. (B) Average concentrations of the indicated proteins secreted by secreting cells (that is, cells with intensities above the BT; bars, left axis) and the percentages of secreting cells (circles, right axis). Data in (A) and (B) are means ± SEM of at least two independent SCBC or cell population experiments. (C) Concentrations of IL-6 (left) and IL-10 (right) secreted by single U937 cells at 4 (n = 587 cells), 8 (n = 812), and 20 hours (n = 601) after stimulation with LPS. Cells that secreted cytokines at concentrations above those detected in the cultured cell population are indicated in red. Data are from one experiment that is representative of at least two independent experiments.
We also observed that attenuation of the secretion of IL-6, IL-10, and, to a lesser extent, GM-CSF, occurred at different times. The secretion of IL-6 and GM-CSF by cells in the SCBC was similar to that by cells in the population through 8 hours, but then was reduced in the SCBC from 8 to 20 hours (Fig. 2A), with a corresponding flattening of the average amount produced by secreting cells (Fig 2B). In contrast, the secretion of IL-10 was reduced between 4 and 8 hours after stimulation, with no substantial increase observed in the SCBC or in the average secretion of secreting cells over time (Fig. 2, A and B). These results are consistent with a dependence of IL-6 and IL-10 on paracrine signals. For IL-6 and IL-10, a small percentage of cells secreted cytokines at the same or greater concentration than that measured in the cultured cell population at each time point (Fig. 2C; cells highlighted in red), suggesting that some isolated cells secreted all of the autocrine or paracrine factors necessary to stimulate maximal secretion.
Finally, we quantified the “secretion noise” for the LPS-stimulated cytokines at 4, 8, and 20 hours after stimulation. The coefficient of variation (CV), in which the standard deviation was normalized to the mean secretion by all cells (fig. S6), was used as a measure of noise (24). The CV for IL-6 and GM-CSF increased between 8 and 20 hours (from ~100% to between 300 and 400%), consistent with a dependence of IL-6 and GM-CSF on heterogeneous input signals, whereas the CV values for IL-1β and TNF-α were consistently high over time. These data suggest that differences in signal heterogeneity over time in the SCBC may reflect different patterns of regulation.
Gaussian graphical modeling of single-cell data reveals paracrine dependencies in the LPS-stimulated signaling network
Because the secretion profile of the population depended on the paracrine exchange of extracellular signals between neighboring cells, isolating cells in the SCBC increased the variability of the signaling inputs across cells. Therefore, each cell in the SCBC could be viewed as a perturbation experiment, and thus we hypothesized that we could infer critical paracrine signals in the LPS network from the single-cell data (25, 26).
To derive an extracellular regulatory network from our single-cell data sets, we first calculated pairwise correlations to assign connections (edges) between cytokines (nodes) based on the combined single-cell, time-course data. Of 28 possible pairwise correlations among the eight cytokines measured, we identified 24 out of 28 that had statistically significant correlations (fig. S7A), which formed a dense network graph that did not reveal useful information about network dependencies (fig. S7B). This dense network is consistent with LPS stimulating the production of all of the cytokines measured and the fact that pairwise correlations cannot distinguish between direct and indirect associations.
Therefore, we turned to graphical Gaussian modeling (GGM) (27), which assigns edges between nodes by calculating the partial correlation between nodes; that is, the correlation that remains between two nodes after accounting for their shared correlations with all other nodes in the dataset. We identified 11 significant partial correlations (Fig. 3A) out of a possible 28. To interpret our GGM network, we defined IL-6 and IL-10 as the paracrine-dependent signals (Fig. 3B, blue). We identified those signals with direct connections to IL-6 and IL-10 as paracrine regulators (TNF-α, IL-1β, and GM-CSF; Fig. 3B, red), whereas those proteins that did not have direct connections (CCL4, CCL5, and IL-8) were defined as non-paracrine signals (Fig. 3B, gray). Both TNF-α and IL-1β act as autocrine or paracrine signals in response to LPS. The LPS-stimulated production of TNF-α mediates a second phase of NF-κB activation in mouse embryonic fibroblasts (MEFs) (18, 19), and this TNF-α acts in a paracrine manner (20). In primary human MDMs, blocking signaling through the IL-1 receptor (IL-1R) substantially decreases the production of TNF-α, IL-8, IL-6, and IL-1β in response to a range of PRRs (including TLR4), which demonstrates the importance of autocrine signaling by IL-1β (22). We observed only one negative partial correlation in our study (between IL-1β and CCL4), but we were unable to find support for this connection in published studies.
Fig. 3. Gaussian graphical modeling of single-cell data reveals paracrine dependencies in the LPS-stimulated network.

(A) Significant partial correlation coefficients in the LPS-stimulated cytokine network based on the combined LPS-treated single-cell secretion data (4, 8, and 20 hours). The significance of a partial correlation between two cytokines was evaluated as described in the Materials and Methods and retained if P ≤ 0.06. (B) An undirected graph of the partial correlation coefficients in A is shown, where the solid and dashed lines indicate positive and negative partial correlations, respectively. Cytokines are categorized as being dependent on paracrine signaling for their secretion (blue), being mediators of paracrine signaling (red), or being non-paracrine signals (gray). (C) Changes in the LPS-stimulated secretion by the cell population of the indicated cytokines at 20 hours after stimulation that were caused by the indicated blocking agents (see table S2 for the blocking antibodies and targets). The amounts of secreted cytokines were measured by ELISA or Bio-plex. Data are means of three biological replicates, and only statistically significant results are shown (P < 0.05 by t test; see fig. S8 for bar graphs of the means ± SEM of the complete data set). The colors and sizes of the circles indicate the magnitude of inhibition or enhancement of secretion. (D) Fold-change in the LPS-stimulated secretion of IL-6 (top) and IL-10 (bottom) at 20 hours in the absence or presence of reagents that simultaneously blocked GM-CSF, IL-1β, IL-6, and TNF-α signaling (labeled as “Bl. 4”). The amounts of secreted cytokines were measured by ELISA, and data are means ± SEM of three biological replicates. *P < 0.05 by t test. Data from the SCBC are included for reference.
To confirm the autocrine and paracrine signaling roles revealed by the GGM-based analysis of the U937 single-cell data, we measured how individually blocking the signaling of each cytokine altered the LPS-stimulated secretion of all the other cytokines (Fig. 3C, fig. S8, and table S2). When TNF-α signaling in response to LPS was blocked with soluble TNF receptor (sTNFR), the amounts IL-6 and IL-10 that were secreted by the U937 cell population were reduced by 35 and 25%, respectively, compared to LPS alone whereas the amounts of CCL4, CCL5, and IL-8 that were secreted were reduced by 20 to 25%. With the exception of IL-6, there were edges between all of these cytokines and TNF-α in the GGM network, confirming that the LPS-stimulated secretion of these cytokines was partially dependent on intermediate TNF-α signaling and that isolation in the SCBC perturbs this connection (Fig. 3C).
Our data also confirmed a paracrine signaling role for GM-CSF. Neutralization of GM-CSF with an anti–GM-CSF antibody resulted in a more than 20% reduction in the secretion of every cytokine in the network, except for CCL5, with the greatest reduction observed for TNF-α (>40% reduction). This finding is consistent with the direct edge between TNF-α and GM-CSF and the indirect edges connecting other cytokines to GM-CSF through TNF-α. In addition, previous studies linked the activation of GM-CSF and TNF-α in macrophages (28, 29). When IL-1β signaling in response to LPS was blocked with a combination of an anti-IL-1β antibody and an IL-1R antagonist (IL-1RA), the amount of IL-6 secreted was reduced by 10% (Fig. 3C), suggesting that paracrine signaling by IL-1β plays a minor role. Furthermore, the amount of CCL4 secreted was also reduced by ~10% when IL-1β signaling was blocked, which is suggestive of a positive regulatory relationship, rather than the negative connection observed in the GGM network (Fig. 3C).
Blocking IL-6 signaling with an anti-IL-6 receptor (IL-6R) antibody reduced the amount of IL-10 that was secreted by 20%, consistent with the GGM network, which suggests that paracrine IL-6 signaling also plays a role. Furthermore, blocking IL-6R signaling also decreased the secretion of IL-6 itself (Fig. 3C). As predicted, neutralization of CCL4, CCL5, or IL-8 did not substantially reduce the secretion of other cytokines in the network; however, IL-8 and IL-10 appeared to negatively regulate the network. The neutralization of IL-10 increased the amounts of GM-CSF, IL-6, and IL-8 that were secreted by 20 to 40%, and neutralization of IL-8 increased the amounts of IL-1β and IL-6 that were secreted by 30 to 40% (Fig. 3C). We hypothesize that the low abundances of IL-1β, IL-6, and IL-10 in the SCBC prevented these negative regulatory edges from being uncovered by the GGM-based analysis. Overall, we conclude that TNF-α, GM-CSF, IL-6, and to a lesser extent IL-1β, act as paracrine signals that enhance the LPS-stimulated secretion of IL-6 and IL-10, as well as of other cytokines in the network, and that these dependencies can be inferred from the isolated single-cell data sets.
To test the extent to which these four signals accounted for the reduction in cytokine secretion that was observed in the SCBC, we examined whether simultaneously blocking signaling by TNF-α, IL-1β, GM-CSF, and IL-6 in the cell population would reduce the amounts of IL-6 and IL-10 secreted to those observed in the SCBC. Blocking all four of these signals reduced the amount of IL-6 that was secreted by 70%, which was relatively close to the 90% reduction in IL-6 secretion that was observed in the SCBC (Fig. 3D); however, blocking all four signals reduced the amount of IL-10 that was secreted by only 40%, suggesting that there were other paracrine signals that contributed to enhanced IL-10 secretion, or that that this enhancement was affected by the dynamic pattern of secretion of cytokines that mediate paracrine signaling, which was missed because of the simultaneous administration of all four inhibitors. Overall, our data suggest that multiple paracrine signals contribute to LPS-stimulated cytokine secretion, and therefore that preventing cell-to-cell communication effectively reduces the inflammatory response.
Paracrine signaling, but not the addition of TNF-α alone, enhances the LPS-stimulated response in the SCBC
We hypothesized that cell isolation would block paracrine signaling most effectively if a small subset of cells within a population secreted most of a given intermediate signal. A closer look at the distribution of TNF-α secretion revealed that the average amount of cytokine secreted by cells above the background threshold at 4 hours (24% of the population; Fig. 4A) was approximately 530 pg/ml. However, for the top 5% of cells, the average amount of TNF-α secreted was ~4400 pg/ml. This means that these 5% of the cells accounted for ~60% of the total amount of TNF-α produced, which suggests that a small subset of “high TNF-α–producing cells” may drive the inflammatory response to LPS.
Fig. 4. Paracrine signaling enhances cytokine secretion.

(A) Distribution of the single-cell secretion of TNF-α 4 hours after stimulation with LPS. Data are from 1329 cells combined from two independent experiments. The BT (black line) is 373 pg/ml. Cells that secreted TNF-α at a concentration above the BT are in black, whereas the top 5% of cells (in terms of amount of TNF-α that they secreted) are in red. Inset: Average secretion for all cells, cells above the BT (black), and the top 5% of cells (red). (B) Staining for intracellular TNF-α (red channel) in a cultured population of U937 cells that were incubated for 4 hours with LPS in the presence of brefeldin A. Cell nuclei were stained with DAPI. Images are representative of two experiments. (C) Schematic of the experimental set-up for testing how the addition of a “uniform TNF-α” signal (1 ng/ml) compared to culturing the cells together for 4 hours (“paracrine mixing”) before they were isolated in the SCBC. (D) Measurement of the average amounts of the indicated cytokines that were secreted by single U937 cells cultured in the SCBC for 20 hours after they had been stimulated with LPS alone, LPS and TNF-α (1 ng/ml), or with LPS followed by “paracrine mixing”. Data are means ± SEM of two independent SCBC experiments (n > 1280 cells for each condition). *P < 0.05 by t test. All cells above the DT were included in the analysis. The dotted line indicates the average amount of the indicated cytokines secreted in a cultured cell population (not shown for IL-6 and IL-10 because of differences in scale).
To confirm the presence of these cells in a cultured cell population, we treated the cells with brefeldin A and imaged the cells 4 hours after they were treated with LPS. As expected, we observed a small percentage of cells that exhibited intense staining for intracellular TNF-β (Fig. 4B), whereas the overall number of TNF-β–producing cells was similar between the SCBC and brefeldin A experiment (~20%; fig. S9). Isolation of these high-secreting cells in a single well would thus substantially reduce the availability of the paracrine signal provided by TNF-α in a cell population and could lower the amounts of other secreted cytokines, as was observed in the SCBC (Fig. 1C). An important consequence of paracrine signaling may therefore be to amplify the response of the population of cells by “sharing” noisy signals, such as TNF-α and IL-6 produced by high-secreting cells (fig. S6).
We next designed an experiment to quantify a role for paracrine signaling in amplifying the LPS-stimulated secretion of cytokines. In the first case, TNF-α (1 ng/ml) was added to the U937 cells together with LPS (100 ng/ml), and then the cells were directly isolated and cultured in the SCBC (Fig. 4C, left). In the second case, LPS (100 ng/ml) was added to the cells and then they were cultured as a population for 4 hours (a process that we refer to as “paracrine mixing”) before they were isolated in the SCBC (Fig. 4C, right). In both cases, secreted cytokines were measured at 20 hours after stimulation with LPS and were compared to those secreted in response to LPS alone.
Somewhat surprisingly, combining TNF-α with LPS did not increase the total amounts of any of the secreted cytokines (Fig. 4D); however, TNF-α increased the percentages of cells that secreted IL-6, GM-CSF, or IL-10 (fig. S10), suggesting that TNF-α played a role in initiating cytokine secretion, but that additional factors were required for amplification of the signal. Another possibility is that the timing of stimulation of the cells with TNF-α relative to that with LPS is important for achieving signal amplification, because a paracrine signal mediated by TNF-α would be received by cells after the initial LPS stimulus. To begin to address this, we stimulated a cultured cell population with LPS together with recombinant TNF-α (1 ng/ml), which was added either at the same time as the LPS or 4 hours later; however, in both cases we observed no TNF-α–dependent increase in the secretion of any of the cytokines analyzed (fig. S11). Although this result may suggest that the timing of exposure of the cells to TNF-α was not critical, it could also be true that that amount of TNF-α that is secreted by the cell population is sufficient for paracrine signaling, and therefore that exogenous TNF-α has no additional effect. Unfortunately, a direct test of the timing of stimulation with TNF-α is not possible with the current SCBC design.
When LPS-stimulated U937 cells were incubated en masse for 4 hours before being isolated in the SCBC, “paracrine mixing” increased the concentrations of secreted CCL4, IL-8, and GM-CSF to match those observed in the cultured population of cells (1.5- to 2.5-fold; Fig. 4D). Paracrine mixing also modestly increased the total amount of secreted IL-10, but the resulting concentration was still much lower than that secreted by cells in the population. There was no observed effect of paracrine mixing on the amount of IL-6 secreted, perhaps because the largest changes in IL-6 secretion occurred between 8 and 20 hours after stimulation (Fig. 2A). To measure how paracrine signaling affected the percentage of cells that secreted cytokines, we performed flow cytometry analysis to compare the amounts of intracellular cytokines in cells that were treated with brefeldin A at the same time that they were treated with LPS (to block both autocrine and paracrine signaling) with those in cells that were treated with brefeldin A 4 hours after they were treated with LPS (such that some autocrine and paracrine signaling could take place). When brefeldin A was added after the cells were exposed to LPS, there was a 1.5- to 2-fold increase in the percentages of cells that secreted IL-6, IL-10, or IL-1β, but not other cytokines (fig. S10). Overall, these data support a role for paracrine signaling in amplifying the secretion of cytokines from neighboring cells, but they also demonstrate that neither TNF-α alone nor paracrine signaling in the first 4 hours after LPS stimulation is sufficient to reproduce the cell-population response.
Positive autoregulation may create microenvironments of high IL-6 secretion and increase overall cell-to-cell heterogeneity
We observed that the variability in the amount of IL-6 secreted between individual cells increased over time in the SCBC, such that by 20 hours the intercellular heterogeneity was higher than for other cytokines (490%; fig. S6), and therefore we sought to study the characteristics of IL-6 secretion in more detail. Inspection of the distribution of IL-6–secreting cells revealed a highly skewed distribution at 20 hours, with a small number of cells secreting 50 to 100 times more than that secreted by the average cell (Fig. 5A). These “super secretors” were observed across different SCBC experiments and experimental conditions (Fig. 5A, compare the red and gray distributions); however, we were unable to observe high IL-6–secreting cells in cell culture by intracellular cytokine staining with brefeldin A at early times after stimulation with LPS as we had been able to do with TNF-α–secreting cells (Fig. 4B). Therefore, we conclude that autocrine signaling is required to produce this skewed IL-6 response.
Fig. 5. Positive autoregulation of IL-6 may increase cell-to-cell heterogeneity when single cells are isolated.

(A) Distribution of the amounts of IL-6 secreted above the BT by 202 cells after 20 hours of incubation with LPS alone (red) or in the presence of TNF (gray). (B) Normalized concentrations of IL-6 secreted by a cell population after 20 hours of treatment with LPS alone, IL-6 alone (100 pg/ml), LPS with an anti-IL-6R antibody, or LPS with recombinant IL-6. The amounts of IL-6 secreted were measured by ELISA, and the final IL-6 concentration was calculated as [concentration measured in sample – concentration measured for recombinant IL-6 without cells]. Data are normalized to treatment with LPS alone and are means ± SEM of two or three biological replicates. *P < 0.05 by t test.
IL-6 is involved in a strong positive feedback loop that amplifies IL-6 signaling (30). Positive autoregulatory networks generally increase cell-to-cell heterogeneity in biological responses (31), and therefore we hypothesized that isolated cells that secreted IL-6 could lead to the formation of microenvironments in which the concentration of IL-6 is high. In experiments in which IL-6 signaling was blocked with an anti-IL-6R antibody, we observed a substantial decrease in IL-6 secretion (Fig. 3C and Fig. 5B). Furthermore, the addition of IL-6 in combination with LPS statistically significantly enhanced the amount of IL-6 secreted by the cell population (Fig. 5B), after accounting for the added IL-6, in contrast to our observations from experiments with added TNF-α (fig. S11). Thus, we suggest that positive autoregulation of IL-6 could result in enhanced IL-6 secretion by isolated single cells whose secreted IL-6 is not taken up by neighboring cells, whereas the loss of IL-6 paracrine signaling may further contribute to the observed attenuation of IL-6 secretion by isolated cells. Overall, our data suggest that autocrine signaling by IL-6 contributes to the amplification of IL-6 secretion and results in the generation of “super secretor” cells.
Loss of paracrine signaling attenuates the secretion of IL-6 and IL-10 by primary human MDMs, but increases the secretion of TNF-α by disrupting negative feedback
Finally, we sought to verify the broader applicability of our findings by measuring single-cell secretion by primary human MDMs isolated from peripheral blood. After the monocytes were isolated, they underwent differentiation into macrophages, were isolated in the SCBC, treated with LPS (100 ng/ml) for 20 hours, and then analyzed for their secretion of IL-8, CCL4, CCL5, TNF-α, IL-1β, IL-6, IL-10, and GM-CSF. Most of the MDMs (70% or more) produced CCL4, CCL5, or TNF-α in response to LPS; however, less than 50% of the cells produced IL-6, IL-10, or IL-1β (fig. S12A). Approximately 50% of the LPS-treated MDMs secreted GM-CSF, which was substantially greater than the percentage of U937 cells that secreted GM-CSF (52% versus 17%; fig. S12A and Fig. 1B). Overall, the percentage of primary MDMs that secreted cytokines in response to LPS was greater than that of U937 cells; however, the “secretion noise” of both cell types in response to LPS was similar. IL-6 and IL-10 displayed CVs on the order of 200% at 20 hours (fig. S12B), and cell-to-cell heterogeneity in the secretion of TNF-α by MDMs at 6 hours after LPS stimulation was very similar to that of U937 cells at 4 hours, with 5% of cells accounting for more than 50% of the total amount of TNF-α that was secreted (fig. S12C).
Consistent with the results from our experiments with U937 cells, the secretion of IL-6 and IL-10 by MDMs was attenuated for cells isolated in the SCBC (Fig. 6A), even though individual cells showed substantial increases in cytokine secretion (fig. S12A). The amounts of IL-8 and IL-1β secreted by the MDMs were similar in both the cell population and the SCBC (Fig. 6A). The amounts of TNF-α, GM-CSF, and CCL5 that were secreted by MDMs in the SCBC were greater than those secreted by cells in the population, a finding that was not observed in experiments with U937 cells (Fig. 1C).
Fig. 6. Decreased secretion of IL-10 by isolated primary human MDMs is coupled to increased secretion of TNF-α and other inflammatory cytokines.

(A) Comparison of the concentrations of the indicated secreted proteins 20 hours after incubation with vehicle (blue) or LPS (red) for cells in a population (left) and in the SCBC (right). Single-cell secretion intensities were converted to concentrations based on recombinant protein standard curves as described earlier (fig. S3 and the Materials and Methods). Secreted cytokine concentrations for the cell population were measured by ELISA. Data are means ± SEM for two independent experiments for both the SCBC (n = 1331 cells) and population experiments. *P < 0.05 by t test. (B) GGM of the LPS-induced signaling network in MDMs inferred from data from single-cell experiments. Edges were included if P < 0.05. Cytokines are colored as described for Fig. 3B. (C) Comparison of the concentration of TNF-α secreted by the cell population (black) and the average concentration of TNF-α secreted by single cells cultured in the SCBC (red) at 0, 6, and 20 hours after stimulation with LPS. (D and E) Fold-changes in the LPS-stimulated secretion of the indicated cytokines after 20 hours of incubation in the context of blocking (D) TNF-α or (E) IL-10 signaling. The amounts of the cytokines secreted were measured by Bio-plex and are means ± SEM of three biological replicates. *P < 0.05 by t test compared to cells treated with LPS alone. (F) Network diagram of an I1-FFL formed by TNF-α and IL-10 (see Discussion).
We performed GGM to determine whether the autocrine and paracrine signaling network for MDM cells that was inferred from single-cell data was consistent with results from similar analyses of U937 cells. Based on the partial correlations calculated from the 20-hour binary secretion data, we identified 15 statistically significant partial correlations out of 28 possible pairwise edges (Fig. 6B), suggesting that the regulation of cytokine secretion by paracrine signaling was more extensive for MDMs than it was for U937 cells. TNF-α was the most highly connected node in the MDM network, with connections to CCL4, CCL5, GM-CSF, and IL-10 that were similar to those in the U937 cell network (compare Fig. 6B with Fig. 3B). In the GGM network for primary MDMs, TNF-α was also directly connected to IL-6, consistent with our experimental results from receptor perturbation assays with U937 cells (Fig. 3C). We also observed a negative partial correlation between IL-1β and CCL5 in the MDMs (Fig. 6B), an interaction that motivates follow-up experiments.
Finally, we explored the increased secretion of TNF-α by MDMs in the SCBC. We noted that in the cell population, the amount of TNF-α that was secreted at 20 hours was less than that secreted at 6 hours, whereas in the SCBC, the amount of TNF-α that was secreted increased over the same time period (Fig. 6C). IL-10 is implicated in inhibiting the secretion of TNF-α and GM-CSF (32), and therefore one possible explanation for the observed increased TNF-α secretion in the SCBC is that the attenuated secretion of IL-10 might indirectly lead to the increased secretion of TNF-α and GM-CSF by isolated cells. The GGM network for both U937 cells and MDMs indicated that there was a direct connection between TNF-α and IL-10. Blocking TNF-α signaling in MDMs with soluble TNFR resulted in a 70% reduction in the amount of IL-10 secreted, as well as substantial reductions in the amounts of CCL4, CCL5, and IL-6 that were secreted (Fig. 6D). Conversely, the neutralization of IL-10 signaling in MDMs resulted in four- and three-fold increases in the secretion of TNF-α and GM-CSF, respectively, as well as the increased secretion of CCL4, CCL5, IL-6, and IL-8 (Fig. 6E). Overall, we hypothesize that a small percentage of cells that secret large amounts of TNF-α are necessary (although perhaps not sufficient) to increase the amounts of IL-10 that are secreted, and that in turn, IL-10 inhibits the secretion of TNF-α, as well as of other proinflammatory cytokines (Fig. 6F). Overall, our study suggests that cell-to-cell heterogeneity in cytokine secretion together with paracrine signaling affect both the positive and negative regulation of the LPS-stimulated inflammatory response.
Discussion
Microwell-based isolation assays provide a means to explore the cell-to-cell variability of cytokine secretion. The SCBC design enables measurement of the secretion from the same single cells of multiple proteins (8 in this study), which together shape a cellular communication network. However, a single-cell–based assay cannot be considered a scaled-down version of an assay of cells in a population because of network-level dependencies on secreted signals that are implemented through paracrine-based cell-to-cell communication. Our results illustrate that when paracrine signaling is blocked, the amounts of some cytokines secreted on a per cell basis is substantially less than that secreted by cells that are part of a population, regardless of whether we analyzed U937 cells or primary human MDMs (Fig. 1C and Fig. 6A). However, because the isolation of cells perturbs the collective response, variations in the output of individual cells can be used to efficiently infer meaningful biological connections through graphical modeling methods, as has been demonstrated for single-cell data sets generated by flow cytometry (25) and microscopy (26). We identified TNF-α, IL-1β, GM-CSF, and IL-6 as mediators of the paracrine network through GGM modeling of our single-cell data (Fig. 3, A and B; and Fig. 6B), and we validated these findings experimentally (Fig. 3, C and D; and Fig. 6, C and E). Thus, the analysis of cytokine secretion by isolated cells provides information that is complementary to that obtained from analyses of cell populations, and it enables the decoupling of paracrine signaling from autocrine signaling.
Our results reveal a complex pattern of LPS-stimulated cytokine secretion that is mediated by paracrine signaling (Fig. 7). In response to stimulation with LPS, most cells initiate the secretion of IL-8, CCL4, and CCL5. A subset of these cells also initiates the secretion of TNF-α and IL-1β (and likely GM-CSF), but there is great heterogeneity among these cells in terms of their response. We hypothesize that a small percentage of cells that secrete large amounts of TNF-α, IL-1β, and GM-CSF, as well as of other paracrine factors not measured in our study, amplify the secretion of IL-6 and IL-10 (and also GM-CSF). Cells that secrete large amounts of IL-6 further enhance their secretion of IL-10 and of IL-6 itself.
Fig. 7. Schematic model illustrating how paracrine signaling drives LPS-stimulated cytokine secretion.
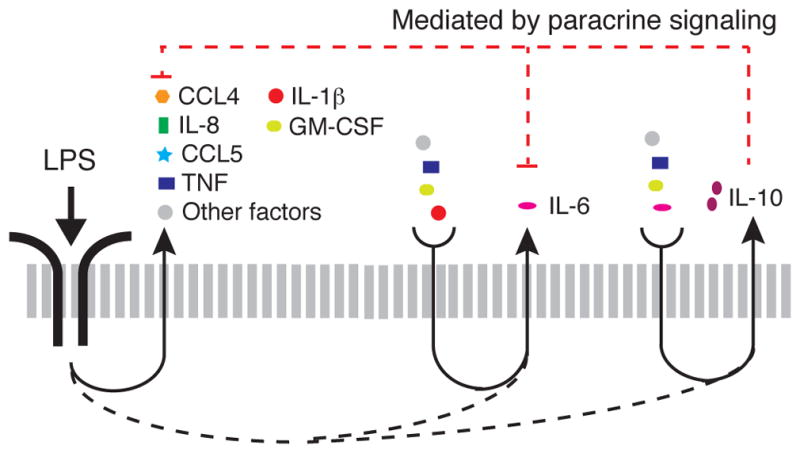
Most macrophages stimulated with LPS secrete CCL4, CCL5, and IL-8, whereas a smaller percentage of cells secrete IL-1β, TNF-α, GM-CSF, IL-6, and IL-10. The secretion of IL-6 and IL-10 are dependent on paracrine signals from the subset of cells that secrete IL-1β, TNF-α, GM-CSF, and other factors not measured in our study. The secretion of IL-10 further depends on paracrine signaling by IL-6. IL-10 is the cytokine whose secretion was most adversely affected by the isolation of MDM cells. Cells that secrete IL-10 inhibit the secretion of TNF-α, GM-CSF and IL-6, as well as of some chemokines (21, 32, 33), which may account for the increased concentrations of TNF-α and GM-CSF that were secreted by isolated MDMs.
For primary MDMs, we observed that isolated cells secreted increased amounts of TNF-α and GM-CSF compared to those secreted by cells in a population, which we attribute to the loss of inhibitory feedback by IL-10 (21, 32, 33) and potentially other secreted factors not measured in our study, such as prostaglandin E2 (34, 35). The regulation of inflammation exerted by TNF-α and IL-10 can be characterized as a type I, incoherent feed-forward loop (I1-FFL) (36), with additional negative feedback from IL-10 to TNF-α (Fig. 6D). I1-FFL and negative feedback motifs provide an accelerated response to the activating input, while minimizing steady-state variability (31, 36). Thus, our results suggest that heterogeneous innate immune signals combined with paracrine signaling generate a network motif that facilitates a rapid and strong inflammatory response, while limiting local inflammation (11). A single-cell transcriptomic study of the LPS-stimulated activation of mouse bone marrow–derived dendritic cells demonstrated that the loss of paracrine signaling through cell isolation resulted in sustained, rather than transient, Tnf transcription (37). The authors further demonstrated that a small population of cells with enhanced expression of Ifnb stimulated paracrine signaling, and, because IL-10 is stimulated by IFN-β (21, 38), the authors suggested that IL-10 might be implicated in the sustained transcription of Tnf, which provides additional evidence to support our findings.
Stochastic activation of cytokines has been observed in both innate and adaptive immunity, including the production of IL-6 and IFN-β in response to the activation of TLR4 by LPS (10, 37), of IFN-β in response to viral sensing by retinoic acid-inducible gene 1 (RIG-I) (9), and of IL-4 in response to the stimulation of T helper lymphocytes (39). Our results expand on these findings by showing that some inflammatory cytokines that are directly stimulated by LPS, such as TNF-α, display considerable cell-to-cell heterogeneity in their secretion within 4 hours of LPS stimulation (Fig. 4, A and B), but that heterogeneity in the secretion of other LPS-stimulated cytokines, such as IL-6, is strongly affected by paracrine signaling. Although our results do not provide direct insight into the sources of heterogeneity that led to the wide variation in cytokine secretion observed between macrophages at earlier time points, there are several potential non-mutually exclusive sources suggested by previous studies. One possibility is that variability in the timing of the monocyte-to-macrophage transition affects the cell-to-cell variability in cytokine production, as has been observed in other experimental systems (10, 40). Another possibility is that naturally occurring differences in the abundance or states of signaling proteins can account for the observed variability in the occurrence of downstream functions (1, 41). For example, heterogeneity in the activation of NF-κB in macrophages and epithelial cells correlates with variations in the production of TNF-α and the abundance of TNF-α–stimulated transcripts, respectively (42, 43). We speculate that one or both of these sources of heterogeneity may partially account for the secretion variability that we observed in the SCBC.
Although GGM-based analysis uncovered positive regulatory relationships among cytokines in LPS-stimulated cells, it did not identify negative regulatory connections, even in primary MDMs in which the secretion of pro-inflammatory cytokines was inhibited by IL-10 (Fig. 6, B and E). Because large concentrations of TNF-α contributed to the secretion of IL-10, as well as that of other cytokines (Fig. 6D), these positive correlations may confound the discovery of the negative regulation that follows. Another reason might be that the incidence of cells that secrete large amounts of IL-10 (for example, > 50 pg/ml) is low (approximately 6%). Assuming that some threshold concentration of IL-10 is required to inhibit inflammatory cytokine secretion, the number of data points may be too few to identify statistically significant partial correlations. Finally, it is possible that the cells that secrete large amounts of cytokines (including TNF-α and IL-10) are not the same cells in the population that are inhibited by IL-10. Although currently only speculative, this possibility suggests a higher level of organization in a cell population, in which distinct subpopulations of the same cell type communicate with each other through paracrine signaling.
Whether a microwell-based assay or a cell culture plate–based assay is more representative of the environment in vivo is likely context-dependent. The range over which a paracrine signal is effective in tissue culture plates, which have a relatively high ratio of culture medium to cells, can be on the order of hundreds of cell lengths (44). In contrast, in a mouse model, TNF protein has a half-life of 6 min (45), which suggests that paracrine signals in vivo may be very short-lived, and that signaling microenvironments might be established. Therefore, in some cases, the isolation of single cells or small populations of cells in microwells may be more representative of the types of interactions that occur in vivo than is the culturing of cell populations in a tissue culture plate. We observed highly skewed distributions of IL-6 secretion in both U937 cells and primary MDMs (Figs. 5 and 6), which we suggest might be specific to the microenvironments of IL-6 established in the microwell-based assay. An IL-6–dependent positive feedback loop has been implicated in autoimmune diseases (30) as well as in allogenic rejection (46), and our results suggest that microenvironments in vivo could contribute to this pathogenesis.
Some important aspects of paracrine signaling cannot be easily tested with our current device design, including the spatial and dynamic nature of the intermediate paracrine signals. For example, the delay between a secondary paracrine signal and the initial stimulus of LPS might be critical to generating the response. In addition, the spatial orientation of neighboring cells might also be important. Both temporal and spatial regulation provide additional ways for cells to tune phenotypic responses through paracrine signaling. More work is needed to explore if and how these regulatory mechanisms are important in vivo.
Materials and Methods
Fabrication of antibody barcodes and microchamber array chips
Antibody barcodes and microchamber array chips were fabricated as previously described (13). Briefly, chips were fabricated with PDMS (RTV615, Momentive, parts A and B in a 10:1 ratio) from silicon masters through soft lithography techniques. To fabricate antibody barcodes, a poly-L-lysine microarray glass slide (Erie Scientific) was bound to the PDMS chip designed for flow patterning, and 2 μl of each antibody was then flowed through individual microchannels until dry. Antibody pairs used in this study are listed in table S3. The SCBC used in this study contains 3080 rectangular chambers with the dimensions 35 × 35 × 1850 μm (width × depth × length).
Cell culture and reagents
Human monocytic U937 cells (ATCC) were cultured in RPMI 1640 medium supplemented with 10% heat-inactivated fetal bovine serum (FBS) and 1% penicillin and streptomycin. Cells were differentiated into macrophage-like cells by culturing them in medium containing phorbol myristate acetate (PMA, 50 ng/ml) for 48 hours and then in medium without PMA for an additional 48 hours. Differentiated cells were stained with allophycocyanin (APC)-conjugated anti-human CD11b antibody (BD Pharmingen 561015) and then analyzed by flow cytometry to confirm that >95% of the cells were CD11b+. After the cells had differentiated, they were lifted from the plate, treated with LPS-EK Ultrapure (100 ng/ml, Invivogen tlrl-epklps) alone or in combination with the reagents indicated in the legends, and then plated for cell culture. Blocking reagents were used at the concentrations specified in table S2. Other reagents included: human recombinant TNF-α (1 ng/ml, R&D Systems Inc., 210-TA-020), and human recombinant IL-6 (100 pg/ml, R&D Systems Inc., 206-IL-010). Primary human monocytes were isolated from buffy coats (Research Blood Component) with Ficoll-Paque (GE Healthcare) and the human Pan Monocyte Isolation Kit (Miltenyi Biotec). Isolated cells were incubated with phycoerythrin (PE)-conjugated anti-CD14 antibody (Millipore CB2453P) and analyzed by flow cytometry to confirm that >95% of the cells were CD14+. Cells were differentiated into macrophages by culturing them in RPMI medium containing 20% heat-inactivated FBS, 1% penicillin and streptomycin, 2 mM L-glutamine, and M-CSF (50 ng/ml, R&D Systems Inc., 216-MC-005) for 7 days. After they had undergone differentiation, the cells were replated at a density of 500,000 cells/ml, allowed to adhere overnight, and then were treated with LPS in the presence or absence of the reagents indicated in the figure legends. All biological replicates presented are from the same donor in order to distinguish cell-to-cell heterogeneity from donor-to-donor variability but the results are representative of observations from three donors.
SCBC experiments
SCBC experiments were performed as previously described with some modifications for primary MDMs (13). Briefly, PDMS nanowell arrays were treated in a plasma reactor (Harrick Plasma PDC-32G) to make the surfaces hydrophilic (for MDMs), and then both the nanowell array and the antibody barcode glass slide were blocked in phosphate-buffered saline (PBS) containing 3% bovine serum albumin (BSA). U937 cells were loaded into the PDMS nanowell array immediately after the addition of LPS. Differentiated MDMs were added to the PDMS nanowell array, covered with a glass slide, and incubated overnight to allow the cells to adhere. After adhesion, the glass slide was removed, the wells were washed three times with medium and then LPS or medium was added to the cells. The flow-patterned glass slide was then placed on top of the PDMS microchamber and the device was secured by screws. The device was imaged with a Nikon Eclipse Ti microscope with an automatic stage to record the cell number in each nanowell. After the cells were incubated for the times specified in the legends, the glass side was removed in order to perform the sandwich immunoassay. The glass slide was incubated with a mixture of detection antibodies for 1 hour, which was followed by incubation with streptavidin-APC (eBioscience, 5 μg/ml) for 30 min. The slide was blocked for an additional 30 min in PBS containing 3% BSA, rinsed with PBS and water, and finally scanned with a Genepix 4200A scanner (Molecular Devices).
Measurement of cytokine secretion by cell populations
Cells were plated at a density of 500,000 cells/ml (unless otherwise specified) in tissue culture plates and incubated with LPS for the times indicated in the legends. Cell culture medium was collected at the end of the incubation period and was assayed by enzyme-linked immunosorbent assay (ELISA) or by Bio-plex. The antibody pairs used in the ELISAs were the same as those used for the SCBC (table S3). ELISAs were performed according to the manufacturer’s instructions. Bio-plex analysis was performed according to the manufacturer’s recommendation. Briefly, beads specific for IL-6, IL-10, GM-CSF, IL-1β, or TNF-α were combined and incubated with the undiluted samples. Beads specific for CCL4, CCL5, and IL-8 were combined and incubated with samples that had been diluted 100-fold. The beads were then washed and incubated with detection antibody, followed by streptavidin-PE. Stained beads were analyzed with a Bio-Rad Bio-Plex system.
Intracellular cytokine staining
Cells were differentiated in a tissue culture plate as described earlier. Without being lifted from the plate, the differentiated cells were incubated in the presence or absence of LPS for 20 hours. For on-plate imaging, U937 cells were differentiated and cultured in a Nunc Lab-Tek II chamber slide. Brefeldin A (Biolegend) was added to cells either simultaneously with LPS or 4 hours after the LPS was added, as indicated in the legends. After incubation, the cells were treated with trypsin (for flow cytometry analysis only), fixed with cytofix/cytoperm (BD Biosciences), washed with cytoperm/cytowash (BD Biosciences), and incubated with primary antibodies (BD Bioscience) according to the manufacturer’s instructions. All of the primary antibodies used for intracellular staining were the corresponding capture antibodies used in the SCBC (table S3). The cells were then stained with Alexa Fluor 488–conjugated goat anti-rat antibodies specific for IL-6, IL-10, or GM-CSF (Invitrogen) or with Alexa Fluor 647–conjugated goat anti-mouse antibodies specific for IL-1β, TNF-α, MIP-1β, or IL-8 (Invitrogen). Stained cells were analyzed with a BD Accuri C6 flow cytometer. On-chip staining was imaged with an EVOS FL Auto (AMAFD1000) microscope.
SCBC data processing
Cell images were analyzed with IsoPlexis Detector software (developed by ISOPLEXIS Inc) to quantify the numbers of cells in each microwell of the SCBC. To determine the average fluorescence intensity of the individual antibodies in the SCBC, fluorescent barcode images were analyzed with Genepix Pro software (Molecular Devices). A background threshold (BT) was calculated from the zero-cell background data and was defined as mean + 2 × the standard deviation (SD) of the zero-cell data. A custom Python script was used to process the raw data. To convert the raw intensities measured in the SCBC to concentrations of cytokines, we used recombinant protein calibration curves (fig. S3). Recombinant protein standard curves were derived by measuring the intensity values of recombinant proteins at concentrations between 10 pg/ml and 100,000 pg/ml in the SCBC. The 4 Parameter Logistic nonlinear regression model was used to fit the standard curves, and the 95% confidence intervals were calculated with ProMat (47). Concentration values larger than the maximum recombinant protein concentration (100,000 pg/ml) were set to 100,000 pg/ml. In the initial analysis (Fig. 1C), concentration values corresponding to intensities lower than the background threshold (mean + 2 × SD of the zero-cell data) were set to zero. For all other figures, concentration values for intensities less than the detection limit of the calibration curve (detection threshold; DT) were set to zero.
GGM
Data were transformed to a binary matrix (0 = below BT; 1 = above BT) before GGM was performed. Data points in which two or fewer proteins were secreted were removed from the data matrix to improve the density of the sampling. The GeneNet package (1.2.8) (48) was implemented in R (64 bit, version 3.02), and its heuristic algorithm was used to obtain interactions between measured proteins. The implemented shrinkage estimator was used to calculate partial correlation networks. A dynamic estimator was used for time course data and a static estimator for single time points. Random subsets of the data were acquired through bootstrapping and were analyzed in GeneNet. The partial correlation matrices were validated through multiple testing of log ratios of the variances. Statistically significant connections seen in all subsets of partial correlation networks between proteins were chosen by a measured P ≤ 0.06.
Statistical analysis
To account for the non-normal distribution of the SCBC data, the non-parametric Wilcoxon-Mann-Whitney test was used for hypothesis testing to determine LPS-regulated cytokines. The α-value was set to 0.05 and improved through the Bonferroni correction. Although the single-cell data sets were not normally distributed, we assumed that the total concentration values calculated from each SCBC experiment were normally distributed based on the law of large numbers (49). Therefore we used t tests to compare differences in means of total secreted output and two-factor ANOVA to compare time courses of secretion between the SCBC and cultured cell populations. To compare across cell stimulations, the f test was first applied to determine whether data sets were heteroscedastic, and then the Student’s or Welch’s t test was applied as appropriate. All tests were performed with an α-value of 0.05.
Supplementary Material
Fig. S1. Schematic of the single-cell barcode chip (SCBC).
Fig. S2. Intracellular cytokine staining is consistent with results from the SCBC.
Fig. S3. Recombinant protein standard curves provide a means to convert intensities measured in the SCBC assay to concentrations.
Fig. S4. Including cells below the BT does not change the significant differences between total secretion in the cultured cell population and the SCBC population.
Fig. S5. Changing cell density affects the amount of cytokine secreted per cell for a subset of cytokines, including IL-6 and IL-10.
Fig. S6. The “secretion noise” of IL-6 and GM-CSF increases with time in the SCBC.
Fig. S7. Pairwise correlations do not reliably identify candidates for paracrine signals.
Fig. S8. Analysis of the changes in the LPS-stimulated secretion at 20 hours for the panel of eight cytokines that were caused by blocking each signal individually in a cultured cell population.
Fig. S9. Intracellular staining for TNF-α demonstrates that high secretors exist in a cell population.
Fig. S10. TNF-α and paracrine mixing increase the percentage of single cells positive for IL-6 and IL-10 in response to LPS in the absence of paracrine signaling.
Fig. S11. The timing of TNF-α addition does not increase LPS-induced cytokine secretion in a cultured cell population.
Fig. S12. The cell-to-cell heterogeneity in cytokine secretion of primary MDMs is similar to that of U937 cells.
Table S1. Scientific support for the potential autocrine or paracrine activation of the secretion of the panel of cytokines analyzed in this study.
Table S2. Neutralizing antibodies that were used to block extracellular signaling in the cell population studies.
Table S3. ELISA antibody pairs used in the single-cell barcode chip (SCBC).
Acknowledgments
We thank K. Janes and A. Levchenko for helpful comments on the manuscript. We thank K. Jensen for writing custom Python software to process the SCBC data.
Funding: This work was supported by NIH grants U01-CA164252 (to R.F. and K.M.J.) and U54-CA143798 (sub-award to R.F.).
Footnotes
Author contributions: Q.X. and K.M.J. designed the study; Q.X, Y.L, E.S.S., and N.K. performed all experiments; Q.X., M.R.E., and K.M.J. performed all analyses; and Q.X. and K.M.J. wrote the paper with input from all authors.
Competing interests: R.F. has substantial financial interests (including equity) in Isoplexis.
References
- 1.Spencer SL, Gaudet S, Albeck JG, Burke JM, Sorger PK. Non-genetic origins of cell-to-cell variability in TRAIL-induced apoptosis. Nature. 2009;459:428–432. doi: 10.1038/nature08012. [DOI] [PMC free article] [PubMed] [Google Scholar]
- 2.Paszek P, Ryan S, Ashall L, Sillitoe K, Harper CV, Spiller DG, Rand DA, White MR. Population robustness arising from cellular heterogeneity. Proc Natl Acad Sci U S A. 2010;107:11644–11649. doi: 10.1073/pnas.0913798107. [DOI] [PMC free article] [PubMed] [Google Scholar]
- 3.Chang HH, Hemberg M, Barahona M, Ingber DE, Huang S. Transcriptome-wide noise controls lineage choice in mammalian progenitor cells. Nature. 2008;453:544–547. doi: 10.1038/nature06965. [DOI] [PMC free article] [PubMed] [Google Scholar]
- 4.Youk H, Lim WA. Secreting and sensing the same molecule allows cells to achieve versatile social behaviors. Science. 2014;343:1242782. doi: 10.1126/science.1242782. [DOI] [PMC free article] [PubMed] [Google Scholar]
- 5.Janes KA, Gaudet S, Albeck JG, Nielsen UB, Lauffenburger DA, Sorger PK. The response of human epithelial cells to TNF involves an inducible autocrine cascade. Cell. 2006;124:1225–1239. doi: 10.1016/j.cell.2006.01.041. [DOI] [PubMed] [Google Scholar]
- 6.Moledina F, Clarke G, Oskooei A, Onishi K, Gunther A, Zandstra PW. Predictive microfluidic control of regulatory ligand trajectories in individual pluripotent cells. Proc Natl Acad Sci U S A. 2012;109:3264–3269. doi: 10.1073/pnas.1111478109. [DOI] [PMC free article] [PubMed] [Google Scholar]
- 7.Ma C, Fan R, Ahmad H, Shi Q, Comin-Anduix B, Chodon T, Koya RC, Liu CC, Kwong GA, Radu CG, Ribas A, Heath JR. A clinical microchip for evaluation of single immune cells reveals high functional heterogeneity in phenotypically similar T cells. Nat Med. 2011;17:738–743. doi: 10.1038/nm.2375. [DOI] [PMC free article] [PubMed] [Google Scholar]
- 8.Han Q, Bagheri N, Bradshaw EM, Hafler DA, Lauffenburger DA, Love JC. Polyfunctional responses by human T cells result from sequential release of cytokines. Proc Natl Acad Sci U S A. 2012;109:1607–1612. doi: 10.1073/pnas.1117194109. [DOI] [PMC free article] [PubMed] [Google Scholar]
- 9.Zhao M, Zhang J, Phatnani H, Scheu S, Maniatis T. Stochastic expression of the interferon-beta gene. PLoS Biol. 2012;10:e1001249. doi: 10.1371/journal.pbio.1001249. [DOI] [PMC free article] [PubMed] [Google Scholar]
- 10.Shalek AK, Satija R, Adiconis X, Gertner RS, Gaublomme JT, Raychowdhury R, Schwartz S, Yosef N, Malboeuf C, Lu D, Trombetta JJ, Gennert D, Gnirke A, Goren A, Hacohen N, Levin JZ, Park H, Regev A. Single-cell transcriptomics reveals bimodality in expression and splicing in immune cells. Nature. 2013;498:236–240. doi: 10.1038/nature12172. [DOI] [PMC free article] [PubMed] [Google Scholar]
- 11.Rand U, Rinas M, Schwerk J, Nohren G, Linnes M, Kroger A, Flossdorf M, Kaly-Kullai K, Hauser H, Hofer T, Koster M. Multi-layered stochasticity and paracrine signal propagation shape the type-I interferon response. Molecular systems biology. 2012;8:584. doi: 10.1038/msb.2012.17. [DOI] [PMC free article] [PubMed] [Google Scholar]
- 12.Song Q, Han Q, Bradshaw EM, Kent SC, Raddassi K, Nilsson B, Nepom GT, Hafler DA, Love JC. On-chip activation and subsequent detection of individual antigen-specific T cells. Analytical chemistry. 2010;82:473–477. doi: 10.1021/ac9024363. [DOI] [PMC free article] [PubMed] [Google Scholar]
- 13.Lu Y, Chen JJ, Mu L, Xue Q, Wu Y, Wu PH, Li J, Vortmeyer AO, Miller-Jensen K, Wirtz D, Fan R. High-throughput secretomic analysis of single cells to assess functional cellular heterogeneity. Analytical chemistry. 2013;85:2548–2556. doi: 10.1021/ac400082e. [DOI] [PMC free article] [PubMed] [Google Scholar]
- 14.Chattopadhyay PK, Gierahn TM, Roederer M, Love JC. Single-cell technologies for monitoring immune systems. Nat Immunol. 2014;15:128–135. doi: 10.1038/ni.2796. [DOI] [PMC free article] [PubMed] [Google Scholar]
- 15.Auffray C, Fogg D, Garfa M, Elain G, Join-Lambert O, Kayal S, Sarnacki S, Cumano A, Lauvau G, Geissmann F. Monitoring of blood vessels and tissues by a population of monocytes with patrolling behavior. Science. 2007;317:666–670. doi: 10.1126/science.1142883. [DOI] [PubMed] [Google Scholar]
- 16.Hickman HD, Reynoso GV, Ngudiankama BF, Rubin EJ, Magadan JG, Cush SS, Gibbs J, Molon B, Bronte V, Bennink JR, Yewdell JW. Anatomically restricted synergistic antiviral activities of innate and adaptive immune cells in the skin. Cell Host Microbe. 2013;13:155–168. doi: 10.1016/j.chom.2013.01.004. [DOI] [PMC free article] [PubMed] [Google Scholar]
- 17.Iwasaki A, Medzhitov R. Regulation of adaptive immunity by the innate immune system. Science. 2010;327:291–295. doi: 10.1126/science.1183021. [DOI] [PMC free article] [PubMed] [Google Scholar]
- 18.Covert MW, Leung TH, Gaston JE, Baltimore D. Achieving stability of lipopolysaccharide-induced NF-kappaB activation. Science. 2005;309:1854–1857. doi: 10.1126/science.1112304. [DOI] [PubMed] [Google Scholar]
- 19.Werner SL, Barken D, Hoffmann A. Stimulus specificity of gene expression programs determined by temporal control of IKK activity. Science. 2005;309:1857–1861. doi: 10.1126/science.1113319. [DOI] [PubMed] [Google Scholar]
- 20.Lee TK, Denny EM, Sanghvi JC, Gaston JE, Maynard ND, Hughey JJ, Covert MW. A noisy paracrine signal determines the cellular NF-kappaB response to lipopolysaccharide. Science signaling. 2009;2:ra65. doi: 10.1126/scisignal.2000599. [DOI] [PMC free article] [PubMed] [Google Scholar]
- 21.Pattison MJ, Mackenzie KF, Arthur JS. Inhibition of JAKs in macrophages increases lipopolysaccharide-induced cytokine production by blocking IL-10-mediated feedback. J Immunol. 2012;189:2784–2792. doi: 10.4049/jimmunol.1200310. [DOI] [PMC free article] [PubMed] [Google Scholar]
- 22.Hedl M, Abraham C. Distinct roles for Nod2 protein and autocrine interleukin-1beta in muramyl dipeptide-induced mitogen-activated protein kinase activation and cytokine secretion in human macrophages. J Biol Chem. 2011;286:26440–26449. doi: 10.1074/jbc.M111.237495. [DOI] [PMC free article] [PubMed] [Google Scholar]
- 23.Hedl M, Abraham C. Nod2-induced autocrine interleukin-1 alters signaling by ERK and p38 to differentially regulate secretion of inflammatory cytokines. Gastroenterology. 2012;143:1530–1543. doi: 10.1053/j.gastro.2012.08.048. [DOI] [PMC free article] [PubMed] [Google Scholar]
- 24.Arriaga EA. Determining biological noise via single cell analysis. Analytical and bioanalytical chemistry. 2009;393:73–80. doi: 10.1007/s00216-008-2431-z. [DOI] [PMC free article] [PubMed] [Google Scholar]
- 25.Sachs K, Perez O, Pe’er D, Lauffenburger DA, Nolan GP. Causal protein-signaling networks derived from multiparameter single-cell data. Science. 2005;308:523–529. doi: 10.1126/science.1105809. [DOI] [PubMed] [Google Scholar]
- 26.Snijder B, Sacher R, Ramo P, Damm EM, Liberali P, Pelkmans L. Population context determines cell-to-cell variability in endocytosis and virus infection. Nature. 2009;461:520–523. doi: 10.1038/nature08282. [DOI] [PubMed] [Google Scholar]
- 27.Garmaroudi FS, Marchant D, Si X, Khalili A, Bashashati A, Wong BW, Tabet A, Ng RT, Murphy K, Luo H, Janes KA, McManus BM. Pairwise network mechanisms in the host signaling response to coxsackievirus B3 infection. Proc Natl Acad Sci USA. 2010;107:17053–17058. doi: 10.1073/pnas.1006478107. [DOI] [PMC free article] [PubMed] [Google Scholar]
- 28.Baqui AA, Meiller TF, Chon JJ, Turng BF, Falkler WA., Jr Granulocyte-macrophage colony-stimulating factor amplification of interleukin-1beta and tumor necrosis factor alpha production in THP-1 human monocytic cells stimulated with lipopolysaccharide of oral microorganisms. Clinical and diagnostic laboratory immunology. 1998;5:341–347. doi: 10.1128/cdli.5.3.341-347.1998. [DOI] [PMC free article] [PubMed] [Google Scholar]
- 29.Hamilton JA. Colony-stimulating factors in inflammation and autoimmunity. Nature reviews Immunology. 2008;8:533–544. doi: 10.1038/nri2356. [DOI] [PubMed] [Google Scholar]
- 30.Ogura H, Murakami M, Okuyama Y, Tsuruoka M, Kitabayashi C, Kanamoto M, Nishihara M, Iwakura Y, Hirano T. Interleukin-17 promotes autoimmunity by triggering a positive-feedback loop via interleukin-6 induction. Immunity. 2008;29:628–636. doi: 10.1016/j.immuni.2008.07.018. [DOI] [PubMed] [Google Scholar]
- 31.Alon U. Network motifs: theory and experimental approaches. Nat Rev Genet. 2007;8:450–461. doi: 10.1038/nrg2102. [DOI] [PubMed] [Google Scholar]
- 32.de Waal Malefyt R, Abrams J, Bennett B, Figdor CG, de Vries JE. Interleukin 10(IL-10) inhibits cytokine synthesis by human monocytes: an autoregulatory role of IL-10 produced by monocytes. J Exp Med. 1991;174:1209–1220. doi: 10.1084/jem.174.5.1209. [DOI] [PMC free article] [PubMed] [Google Scholar]
- 33.Rossato M, Curtale G, Tamassia N, Castellucci M, Mori L, Gasperini S, Mariotti B, De Luca M, Mirolo M, Cassatella MA, Locati M, Bazzoni F. IL-10-induced microRNA-187 negatively regulates TNF-alpha, IL-6, and IL-12p40 production in TLR4-stimulated monocytes. Proc Natl Acad Sci U S A. 2012;109:E3101–3110. doi: 10.1073/pnas.1209100109. [DOI] [PMC free article] [PubMed] [Google Scholar]
- 34.Wall EA, Zavzavadjian JR, Chang MS, Randhawa B, Zhu X, Hsueh RC, Liu J, Driver A, Bao XR, Sternweis PC, Simon MI, Fraser ID. Suppression of LPS-induced TNF-alpha production in macrophages by cAMP is mediated by PKA-AKAP95–p105. Science signaling. 2009;2:ra28. doi: 10.1126/scisignal.2000202. [DOI] [PMC free article] [PubMed] [Google Scholar]
- 35.Kalinski P. Regulation of immune responses by prostaglandin E2. J Immunol. 2012;188:21–28. doi: 10.4049/jimmunol.1101029. [DOI] [PMC free article] [PubMed] [Google Scholar]
- 36.Mangan S, Alon U. Structure and function of the feed-forward loop network motif. Proc Natl Acad Sci U S A. 2003;100:11980–11985. doi: 10.1073/pnas.2133841100. [DOI] [PMC free article] [PubMed] [Google Scholar]
- 37.Shalek AK, Satija R, Shuga J, Trombetta JJ, Gennert D, Lu D, Chen P, Gertner RS, Gaublomme JT, Yosef N, Schwartz S, Fowler B, Weaver S, Wang J, Wang X, Ding R, Raychowdhury R, Friedman N, Hacohen N, Park H, May AP, Regev A. Single-cell RNA-seq reveals dynamic paracrine control of cellular variation. Nature. 2014;509:363–369. doi: 10.1038/nature13437. [DOI] [PMC free article] [PubMed] [Google Scholar]
- 38.Chang EY, Guo B, Doyle SE, Cheng G. Cutting edge: involvement of the type I IFN production and signaling pathway in lipopolysaccharide-induced IL-10 production. J Immunol. 2007;178:6705–6709. doi: 10.4049/jimmunol.178.11.6705. [DOI] [PubMed] [Google Scholar]
- 39.Mariani L, Schulz EG, Lexberg MH, Helmstetter C, Radbruch A, Lohning M, Hofer T. Short-term memory in gene induction reveals the regulatory principle behind stochastic IL-4 expression. Molecular systems biology. 2010;6:359. doi: 10.1038/msb.2010.13. [DOI] [PMC free article] [PubMed] [Google Scholar]
- 40.Trapnell C, Cacchiarelli D, Grimsby J, Pokharel P, Li S, Morse M, Lennon NJ, Livak KJ, Mikkelsen TS, Rinn JL. The dynamics and regulators of cell fate decisions are revealed by pseudotemporal ordering of single cells. Nat Biotechnol. 2014;32:381–386. doi: 10.1038/nbt.2859. [DOI] [PMC free article] [PubMed] [Google Scholar]
- 41.Singh DK, Ku CJ, Wichaidit C, Steininger RJ, 3rd, Wu LF, Altschuler SJ. Patterns of basal signaling heterogeneity can distinguish cellular populations with different drug sensitivities. Molecular systems biology. 2010;6:369. doi: 10.1038/msb.2010.22. [DOI] [PMC free article] [PubMed] [Google Scholar]
- 42.Sung MH, Li N, Lao Q, Gottschalk RA, Hager GL, Fraser ID. Switching of the relative dominance between feedback mechanisms in lipopolysaccharide-induced NF-kappaB signaling. Science signaling. 2014;7:ra6. doi: 10.1126/scisignal.2004764. [DOI] [PMC free article] [PubMed] [Google Scholar]
- 43.Lee RE, Walker SR, Savery K, Frank DA, Gaudet S. Fold change of nuclear NF-kappaB determines TNF-induced transcription in single cells. Mol Cell. 2014;53:867–879. doi: 10.1016/j.molcel.2014.01.026. [DOI] [PMC free article] [PubMed] [Google Scholar]
- 44.Batsilas L, Berezhkovskii AM, Shvartsman SY. Stochastic model of autocrine and paracrine signals in cell culture assays. Biophys J. 2003;85:3659–3665. doi: 10.1016/S0006-3495(03)74783-3. [DOI] [PMC free article] [PubMed] [Google Scholar]
- 45.Beutler BA, Milsark IW, Cerami A. Cachectin/tumor necrosis factor: production, distribution, and metabolic fate in vivo. J Immunol. 1985;135:3972–3977. [PubMed] [Google Scholar]
- 46.Lee J, Nakagiri T, Oto T, Harada M, Morii E, Shintani Y, Inoue M, Iwakura Y, Miyoshi S, Okumura M, Hirano T, Murakami M. IL-6 amplifier, NF-kappaB-triggered positive feedback for IL-6 signaling, in grafts is involved in allogeneic rejection responses. J Immunol. 2012;189:1928–1936. doi: 10.4049/jimmunol.1103613. [DOI] [PubMed] [Google Scholar]
- 47.White AM, Daly DS, Varnum SM, Anderson KK, Bollinger N, Zangar RC. ProMAT: protein microarray analysis tool. Bioinformatics. 2006;22:1278–1279. doi: 10.1093/bioinformatics/btl093. [DOI] [PubMed] [Google Scholar]
- 48.Opgen-Rhein R, Strimmer K. From correlation to causation networks: a simple approximate learning algorithm and its application to high-dimensional plant gene expression data. BMC Syst Biol. 2007;1:37. doi: 10.1186/1752-0509-1-37. [DOI] [PMC free article] [PubMed] [Google Scholar]
- 49.Devore JL. Probability and Statistics for Engineering and the Sciences. 4. Duxbury Press; 1995. [Google Scholar]
- 50.Jayaraman P, Sada-Ovalle I, Nishimura T, Anderson AC, Kuchroo VK, Remold HG, Behar SM. IL-1beta promotes antimicrobial immunity in macrophages by regulating TNFR signaling and caspase-3 activation. J Immunol. 2013;190:4196–4204. doi: 10.4049/jimmunol.1202688. [DOI] [PMC free article] [PubMed] [Google Scholar]
- 51.Hedl M, Abraham C. Secretory mediators regulate Nod2-induced tolerance in human macrophages. Gastroenterology. 2011;140:231–241. doi: 10.1053/j.gastro.2010.09.009. [DOI] [PMC free article] [PubMed] [Google Scholar]
- 52.DeForge LE, Kenney JS, Jones ML, Warren JS, Remick DG. Biphasic production of IL-8 in lipopolysaccharide (LPS)-stimulated human whole blood. Separation of LPS- and cytokine-stimulated components using anti-tumor necrosis factor and anti-IL-1 antibodies. J Immunol. 1992;148:2133–2141. [PubMed] [Google Scholar]
- 53.Takahashi GW, Andrews DF, 3rd, Lilly MB, Singer JW, Alderson MR. Effect of granulocyte-macrophage colony-stimulating factor and interleukin-3 on interleukin-8 production by human neutrophils and monocytes. Blood. 1993;81:357–364. [PubMed] [Google Scholar]
- 54.Tilg H, Trehu E, Atkins MB, Dinarello CA, Mier JW. Interleukin-6 (IL-6) as an anti-inflammatory cytokine: induction of circulating IL-1 receptor antagonist and soluble tumor necrosis factor receptor p55. Blood. 1994;83:113–118. [PubMed] [Google Scholar]
- 55.Steensberg A, Fischer CP, Keller C, Moller K, Pedersen BK. IL-6 enhances plasma IL-1ra, IL-10, and cortisol in humans. American journal of physiology Endocrinology and metabolism. 2003;285:E433–437. doi: 10.1152/ajpendo.00074.2003. [DOI] [PubMed] [Google Scholar]
- 56.Nath A, Chattopadhya S, Chattopadhyay U, Sharma NK. Macrophage inflammatory protein (MIP)1alpha and MIP1beta differentially regulate release of inflammatory cytokines and generation of tumoricidal monocytes in malignancy. Cancer immunology, immunotherapy: CII. 2006;55:1534–1541. doi: 10.1007/s00262-006-0149-3. [DOI] [PMC free article] [PubMed] [Google Scholar]
- 57.Shahrara S, Park CC, Temkin V, Jarvis JW, Volin MV, Pope RM. RANTES modulates TLR4-induced cytokine secretion in human peripheral blood monocytes. J Immunol. 2006;177:5077–5087. doi: 10.4049/jimmunol.177.8.5077. [DOI] [PubMed] [Google Scholar]
- 58.Sanceau J, Wijdenes J, Revel M, Wietzerbin J. IL-6 and IL-6 receptor modulation by IFN-gamma and tumor necrosis factor-alpha in human monocytic cell line (THP-1). Priming effect of IFN-gamma. J Immunol. 1991;147:2630–2637. [PubMed] [Google Scholar]
- 59.Platzer C, Meisel C, Vogt K, Platzer M, Volk HD. Up-regulation of monocytic IL-10 by tumor necrosis factor-alpha and cAMP elevating drugs. International immunology. 1995;7:517–523. doi: 10.1093/intimm/7.4.517. [DOI] [PubMed] [Google Scholar]
- 60.Knobloch J, Peters H, Jungck D, Muller K, Strauch J, Koch A. TNFalpha-induced GM-CSF release from human airway smooth muscle cells depends on activation of an ET-1 autoregulatory positive feedback mechanism. Thorax. 2009;64:1044–1052. doi: 10.1136/thx.2008.111047. [DOI] [PubMed] [Google Scholar]
- 61.Martinez FO, Sironi M, Vecchi A, Colotta F, Mantovani A, Locati M. IL-8 induces a specific transcriptional profile in human neutrophils: synergism with LPS for IL-1 production. European journal of immunology. 2004;34:2286–2292. doi: 10.1002/eji.200324481. [DOI] [PubMed] [Google Scholar]
Associated Data
This section collects any data citations, data availability statements, or supplementary materials included in this article.
Supplementary Materials
Fig. S1. Schematic of the single-cell barcode chip (SCBC).
Fig. S2. Intracellular cytokine staining is consistent with results from the SCBC.
Fig. S3. Recombinant protein standard curves provide a means to convert intensities measured in the SCBC assay to concentrations.
Fig. S4. Including cells below the BT does not change the significant differences between total secretion in the cultured cell population and the SCBC population.
Fig. S5. Changing cell density affects the amount of cytokine secreted per cell for a subset of cytokines, including IL-6 and IL-10.
Fig. S6. The “secretion noise” of IL-6 and GM-CSF increases with time in the SCBC.
Fig. S7. Pairwise correlations do not reliably identify candidates for paracrine signals.
Fig. S8. Analysis of the changes in the LPS-stimulated secretion at 20 hours for the panel of eight cytokines that were caused by blocking each signal individually in a cultured cell population.
Fig. S9. Intracellular staining for TNF-α demonstrates that high secretors exist in a cell population.
Fig. S10. TNF-α and paracrine mixing increase the percentage of single cells positive for IL-6 and IL-10 in response to LPS in the absence of paracrine signaling.
Fig. S11. The timing of TNF-α addition does not increase LPS-induced cytokine secretion in a cultured cell population.
Fig. S12. The cell-to-cell heterogeneity in cytokine secretion of primary MDMs is similar to that of U937 cells.
Table S1. Scientific support for the potential autocrine or paracrine activation of the secretion of the panel of cytokines analyzed in this study.
Table S2. Neutralizing antibodies that were used to block extracellular signaling in the cell population studies.
Table S3. ELISA antibody pairs used in the single-cell barcode chip (SCBC).