

Abstract
Neural networks that control reproduction must integrate social and hormonal signals, tune motivation, and invigorate social interactions. However, the neurocircuit mechanisms for these processes remain unresolved. The medial preoptic area (mPOA), an essential node for social behaviors and is comprised of molecularly-diverse neurons with widespread projections. Here, we identify a steroid-responsive subset of neurotensin (Nts) expressing mPOA neurons that interface with the ventral tegmental area (VTA) to form a socially-engaged reward circuit. Using in vivo 2-photon imaging in female mice, we show that mPOANts neurons preferentially encode attractive male cues compared to non-social appetitive stimuli. Ovarian hormone signals regulate both the physiological and cue encoding properties of these cells. Furthermore, optogenetic stimulation of mPOANts-VTA circuitry promotes rewarding phenotypes, social approach, and striatal dopamine release. Collectively, these data demonstrate that steroid-sensitive mPOA neurons encode ethologically-relevant stimuli and co-opt midbrain reward circuits to promote prosocial behavior critical for species survival.
Prosocial behaviors, such as mating and parenting, are innately rewarding across mammals and require complex neural computations to decipher social signals and promote actions that facilitate offspring and species survival1–3. Social communication strategies are often species-specific and social cues (e.g., from a potential mate or the infant) are transmitted through multiple sensory modalities to facilitate social interactions3,4. Further, internal circulating gonadal steroids, including estradiol in females, change as a function of reproductive status and alter the processing of social cues to bias animals towards social incentives and facilitate reproductive behaviors4–7. However, the neural mechanisms by which social and hormonal signals recruit neurocircuits to adjust motivational states for reproductive behaviors over competing needs remain poorly understood.
The medial preoptic area (mPOA) is a functionally and chemically conserved node of the social behavior network8 that is essential for reproductive behavior in all vertebrate species studied3,4,9. Further, the mPOA contains many steroid receptor containing neurons, receives social information from multiple sensory modalities, and has widespread projections throughout the brain, including the ventral tegmental area (VTA)3,4,6,7. While mPOA-VTA projections are necessary for the expression of reproductive behaviors, it is unknown whether mPOA circuits that encode social and hormonal signals convey positive valence and orchestrate the appetitive and reinforcing aspects of these behaviors. Since VTA dopamine neurons provide incentive salience signals to direct motivation for a variety of needs essential for survival10,11, we predict that neurons in these two brain regions interface to form a socially-engaged reward circuit.
Here, we targeted a molecularly-defined VTA-projecting population of mPOA neurons that express the gene neurotensin (Nts) and examined their endogenous cue-encoding dynamics and behavioral circuit properties under social and hormonal contexts. Previous studies have been unable to chronically record in vivo neural activity from molecularly-defined mPOA neurons. To circumvent these challenges, we implemented in vivo deep-brain calcium (Ca2+) imaging using 2-photon microscopy in head-fixed, awake female mice and reliably detect Ca2+ signals from the same neurons over many days with single-neuron, cell-type precision. Using this approach, we compare the activity dynamics of individual mPOANts neurons in response to different types of attractive odor cues and track social odor responses across hormonal states. We also perform ex vivo slice electrophysiology and Ca2+ imaging to identify physiological relationships between reproductive steroids and mPOANts cell excitability. Lastly, we utilize in vivo behavioral optogenetics to characterize mPOA-VTANts circuitry under social, hormonal, and reward-seeking contexts and in conjunction with fast-scan cyclic voltammetry (FSCV) to detect mPOA-VTANts-evoked dopamine release in the ventral striatum.
Results
Identification of a molecularly-defined population of steroid-responsive mPOA-VTA neurons
Since diverse cell types have been reported in VTA-projecting mPOA neurons12,13 and molecular subsets of mPOA populations putatively regulate different types or aspects of social behaviors14, we first sought to identify a molecularly-defined population of steroid-responsive mPOA-VTA projecting neurons. The gene encoding for the peptide Nts is prominently expressed in the mPOA4 and in other hypothalamic regions has been shown to promote reward-seeking through VTA projections15. Here, injections of retrogradely transported beads into the VTA of female mice resulted in substantial labeling of mPOA neurons, with 96% of Nts-labeled cells co-expressed with VTA beads (Fig.1a,b). This subpopulation comprised 35% of al mPOA-VTA projecting neurons (Fig.1a,b). Further, 21% of Nts mPOA neurons co-expressed mRNA for the estrogen receptor α/1 (ESR1) and galanin (Gal) (Fig.1c–g), which the latter cell population was recently shown to govern parental behaviors in mice14. Another 63% contained mRNA for ESR1 but not Gal, and only 3% expressed Gal but not ESR1 (Fig.1c–g). While the majority of Nts cells expressed ESR1 (84%) (Fig.1c–g and S1c,d), this appeared to be a subpopulation of all mPOA ESR1 cells.
Figure 1.
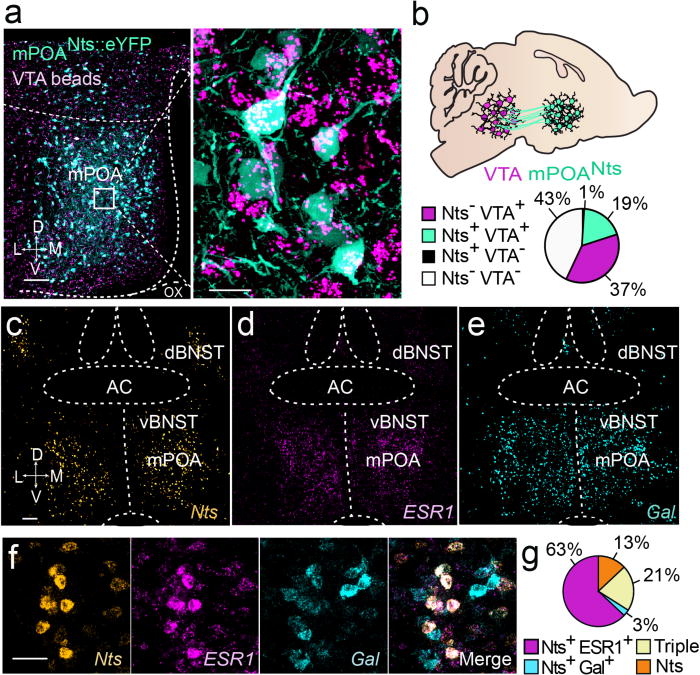
Identification of a molecularly-defined population of steroid-responsive mPOA-VTA neurons. (a) Confocal images represent mPOANts::eYFP (teal) and Retrobead aggregates from the VTA (magenta). mPOA: medial preoptic area, VTA: ventral tegmental area; Nts: neurotensin, eYFP: enhanced yellow fluorescent protein, D: dorsal, V: ventral, M: medial, L: lateral. Left scale bar, 100 μm, right scale bar 20 μm. (b) Schematic illustrates mPOANts projections to the VTA and pie chart shows the percentage of mPOA neurons that contain VTA Retrobeads and/or Nts-eYFP. (c) Confocal image of Nts mRNA. BNST: bed nucleus of the stria terminalis; AC: anterior commissure, Scale bar: 100 μm. (d) Confocal image of ESR1 mRNA. ESR1: estrogen receptor 1/α gene. (e) Confocal image of Gal mRNA. Gal: galanin gene. (f) Overlay of Nts, ESR1, and Gal mRNA in the mPOA. Scale bar 60 μm. (g) Pie chart illustrates the percentage of ESR1 and Gal overlap within Nts positive cells.
Previous studies in female rodents indicate that Nts mPOA expression peaks in proestrus and is enhanced by estradiol16–18. We extended these findings to show that 95% of Nts mPOA cells co-expressed the gene for vesicular GABA transporter (Vgat), and 18% of these also had low to moderate levels of vesicular glutamate transporter (Vglut2), and only 5% expressed Vglut2 alone (Fig.S2a–h). These proportions did not vary as a function of the hormonal state, however administration of estradiol in ovariectomized females increased both mPOA Nts and Vgat mRNA expression intensity compared with vehicle-treated controls (Fig. S2d–h). Collectively, these data indicate that Nts-containing mPOA neurons comprise a subpopulation of putative GABAergic neurons that project to the VTA, largely express ESR1 steroid receptors, and are responsive to gonadal steroid changes.
mPOA-VTANts neurons dynamically encode social odor cues
Next, we monitored the endogenous activity dynamics of mPOANts neurons in response to innately attractive social odor cues using in vivo 2-photon Ca2+ imaging with single-neuron and cell-type precision, in awake female mice. Here, a Cre-inducible virus coding for the fluorescent Ca2+ indicator, GCaMP6s19, was injected into the mPOA (mPOANts::GCaMP6s) of Nts-IRES-Cre mice20, which co-expressed Cre in Nts-containing mPOA neurons (Fig. S3a–e). Dual Ca2+ imaging and whole-cell patch clamp recordings first established that increasing current injections produced increasing amounts of Ca2+ mediated fluorescence changes in mPOANts::GCaMP6s neurons (Fig. S4a–c), indicating that GCaMP6s fluorescence correlated with evoked action potentials and can thus serve as a proxy for neural activity. To visualize Ca2+ activity in vivo, we gained optical access to this deep brain region through a Gradient Refractive Index (GRIN) lens implanted directly above mPOANts::GCaMP6s neurons and applied a head-ring for subsequent 2-photon imaging (Fig.S4d–f and Fig.2a). Following recovery and time to permit for GCaMP6 expression, mPOANts::GCaMP6s neurons from female mice in proestrus were imaged during multiple time-locked, automated trials where vaporized social odors were presented (Fig.2a). Intact male urine served as an attractive social cue with reproductive relevance and ovariectomized female urine served as a conspecific urine control; both odor types were innately attractive to female mice (Fig.S5a–g). Ca2+ dynamics were reliably detected in individual mPOANts::GCaMP6s cells with single-neuron precision (Fig.2b,c, Fig.S4d–f, and Video 1) and we identified a subset of individual mPOANts neurons that were preferentially excited by male odor (Fig.2b–d and Video 2). Across all animals tested, a greater proportion of mPOANts::GCaMP6s cells were excited by male odor (37%) compared with female odor (8%) (Fig.2d). Moreover, a direct odor-type comparison of cells that were significantly excited by male odor revealed that male-excited cells were relatively less responsive to female odor (Fig.2e). These data illustrate that a large portion of mPOANts neurons dynamically encode social odor cues, with subsets preferentially responding to reproductively-relevant male signals.
Figure 2.
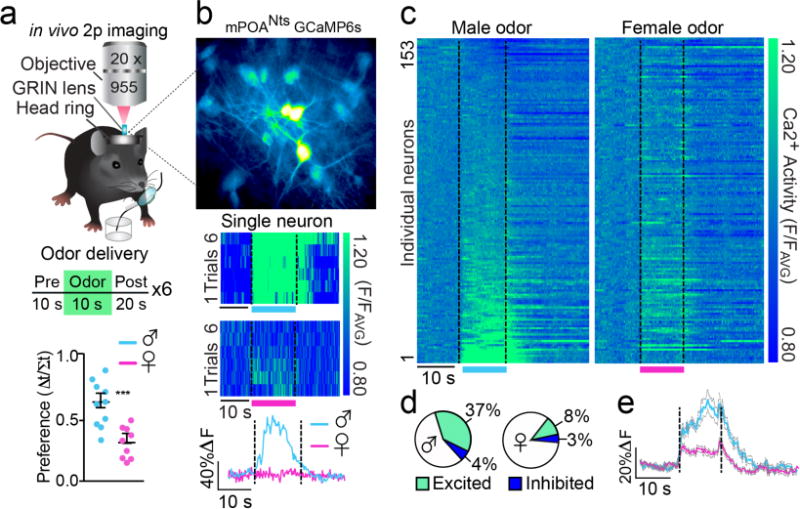
mPOANts neurons dynamically encode social odor cues. (a) Top: schematic of in vivo Ca2+ imaging in mPOANts::GCaMP6 cells in head-fixed mice in conjunction with delivery of vaporized mouse urine. GRIN, gradient refractive index lens. Bottom: females had a higher behavioral preference index for male urine over female urine (error bars, ± s.e.m., paired t-test, t17 = 4.215, P = 0.0006, n = 9–10 mice). (b) Top: representative mPOANts::GCaMP6 cells acquired from two-photon imaging (scale bars cannot be accurately provided, as two-photon recording through a GRIN lens distorts the imaging plane). Middle: each row of the heat plot represents the Ca2+ response of an individual mPOANts::GCaMP6 neuron during each male (top) or female (bottom) trial of odor delivery. Vertical axis: normalized Ca2+ fluorescence (F/FAVG). Bottom: Ca2+ trace from the same neuron averaged across the 6 male or female odor trials. (c) Each row of the heat plot depicts the Ca2+ response of an individual mPOANts::GCaMP6 neuron averaged across the 6 male (left plot) or female (right plot) odor trials. Heat plots are indexed in the same order for odor type comparison and cells were sorted by male odor response (n = 153 cells combined across 4 mice). (d) Pie charts show the percentage of mPOANts::GCaMP6 cells significantly excited or inhibited by male or female odors (Wilcoxon t-test, all P < 0.05, n = 153 cells combined across 4 mice). (e) Ca2+ traces averaged across male or female trials from mPOANts::GCaMP6 cells significantly excited by male odor (error bands, ± s.e.m.; paired t-test, t56 = 4.89, P < 0.0001, n = 57 cells combined across 4 mice).
mPOANts neurons encode reproductive male cues in a steroid-gated manner
Gonadal steroids, including estradiol, can enhance the processing of reproductive social signals, promote mate attraction5,21, and differentially regulate mPOA neuronal activity in vivo22,23 (which could reflect differences in cell types or steroid receptor expression). We next evaluated whether ovarian steroids influence social cue-encoding dynamics, by tracking odor-evoked Ca2+ activity from the same mPOANts::GCaMP6s neurons before and after steroid-priming in ovariectomized females, over days (Fig.3a). In a separate cohort of ovariectomized females, steroid priming of estradiol approximately 5 hours before testing enhanced behavioral attraction to male urine and this behavioral response was sustained following a second injection of progesterone (a steroid regimen known to induce sexual receptivity), compared with vehicle treatment (Fig.S6a–e and Fig. 3a,b). Using this priming schedule for imaging, we detected Ca2+ dynamics from the same neurons across repeated imaging sessions separated by days and identified individual cells that encoded male odor only after steroid replacement (Fig.3a). The amplitude and proportion of cells excited by male odor increased following estradiol replacement and was sustained following progesterone administration, compared with vehicle treatment (Fig.3e–f and S6f,g). In contrast, female odor presentation excited a smaller proportion of cells following either treatment (Fig.3f and S6h). Together, this indicates that mPOANts neurons adjust their male odor encoding properties in response to changes in ovarian steroids and that these cells integrate changes in external and internal context that shift activity patterns.
Figure 3.
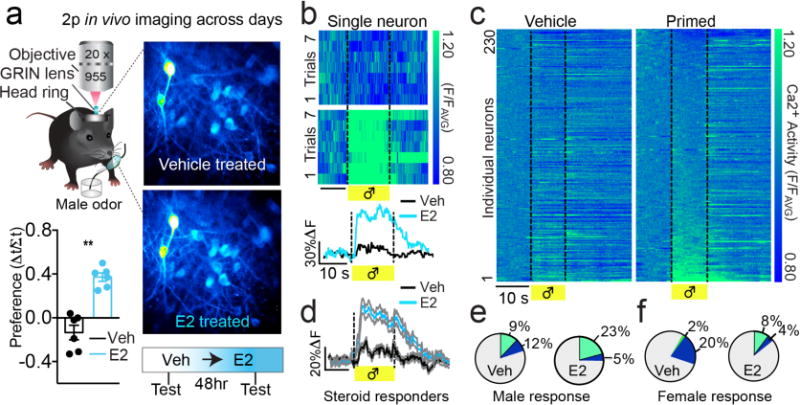
mPOANts neurons encode reproductive male cues in a steroid-gated manner. (a) Top: schematic illustrating chronic Ca2+ imaging in mPOANts::GCaMP6 cells on separate hormone-treated days. Bottom: ovariectomized females had a higher behavioral preference for male urine following estradiol (blue) compared to vehicle (black) (error bars, ± s.e.m., paired t-test, t5 = 5.85, P = 0.0021, n = 6 mice). (b) Top: each row of the heat plot represents the Ca2+ response during each male odor trial from an individual mPOANts::GCaMP6 cell imaged across treatment days. Vertical axis: normalized Ca2+ fluorescence (F/FAVG). Scale bar, 10 s. Bottom: Ca2+ traces from the same neuron averaged across the 7 male odor trials. Scale bar: x, 10 s; y, 30% ÆF/F. Veh, vehicle oil; E2, estradiol. (c) Each row of the heat plot depicts the Ca2+ response of an individual mPOANts::GCaMP6 cell averaged across male odor trials and imaged after vehicle (left plot) or estradiol (right plot). Heat plots are indexed in the same order for comparison and cells were sorted by male odor response following estradiol replacement. Scale bar, 10 s (n = 230 cells combined across 4 mice). (d) Averaged Ca2+ traces from mPOANts::GCaMP6 cells significantly excited by male odor after estradiol compared to their response after vehicle. Scale bar: x, 10 s; y, 20% ÆF/F (gray shading represents ± s.e.m., paired t-test, t49 = 8.98, P < 0.0001, n = 51 cells combined across 4 mice). (e) Pie charts represent the percent of cells significantly excited (green) or inhibited (blue) by male odor by treatment (Wilcoxon t-test, all P < 0.05, n = 230 cells combined across 4 mice). (f) Pie charts represent the percent of cells significantly excited (green) or inhibited (blue) by female odor by treatment (Wilcoxon t-test, all P < 0.05, n = 230 cells combined across 4 mice).
mPOANts encoding comparison of social and nonsocial attractive odor cues
While mPOANts neurons encoded attractive social cues, it remained unclear whether this was restricted to social signals or generalized to nonsocial forms of appetitive odors. Peanut oil is a robustly attractive, nonsocial, food-related odor24 and we confirmed that female mice are behaviorally attracted to this stimulus following prior exposure in the home cage (Fig.S5a–g). Then, we imaged odor-evoked mPOANts::GCaMP6s Ca2+ responses in primed females during multiple distinct odor trials of social and nonsocial attractive odors. Specifically, we compared neuronal responses to urine odor from intact males, urine odor from intact females, and peanut oil odor (after home cage exposure) (Fig.4a,b). Individual neurons were excited by male urine and/or female urine, but these cells were largely unresponsive to or inhibited by peanut oil odor presentation (Fig.4a–c). Further, a greater proportion of neurons were excited by male urine odor (28%) compared to intact female urine odor (8%) or peanut oil odor (10%) (Fig.4d). These single-neuron comparisons demonstrate that distinct forms of attractive stimuli can recruit largely non-overlapping mPOANts neuron ensembles, and that social versus nonsocial appetitive cue encoding is dissociable at the individual neuron level.
Figure 4.
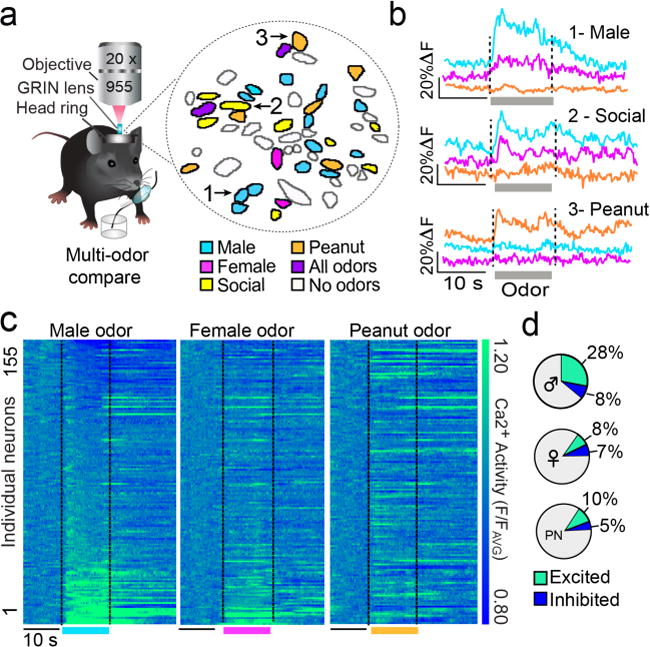
mPOANts encoding comparison of social and nonsocial odor cues. (a) Spatial map of cell outlines in response to distinct odor cues. Mask displays binary odor response of cells excited by male odor (blue), female odor (pink), both male and female odor (yellow), non-social peanut oil odor (orange), all odors (purple), or none of the odors (white). (b) Example Ca2+ trace from 3 neurons indicated by arrows in the spatial map. Traces were averaged across 7 odor trials for male urine, female urine, or peanut oil. (c) Each row of the heat plot depicts the Ca2+ response of an individual mPOANts::GCaMP6 neuron averaged across male (left plot), female (middle plot), or peanut (right) odor trials. Heat plots are indexed in the same order for comparison and cells were sorted by male odor response. Scale bar; 10 s (n = 155 cells combined across 3 mice). PN: peanut oil. (d) Pie charts show the percentage of mPOANts::GCaMP6 cells significantly excited or inhibited by male, female, or peanut odors (Wilcoxon t-test, all p values < 0.05, n = 155 cells combined across 3 mice).
Steroids enhance neuronal excitability in mPOANts neurons
Ovarian steroids not only altered the odor-encoding dynamics (Fig. 3), but also the basal and physiological properties of mPOANts neurons. Imaging spontaneous Ca2+ activity dynamics in intact cycling females across two days of the estrous cycle revealed that individual mPOANts neurons adjusted their spontaneous activity dynamics across hormonal states, specifically, showing enhanced Ca2+ activity on the afternoon of proestrus (when estradiol levels peak25) compared to the afternoon of estrus (Fig.S6i–l) and following estradiol-priming in ovariectomized females compared with vehicle (Fig.5a–d). To explore potential underlying physiological mechanisms, we performed ex vivo patch-clamp and fluorescent recordings from mPOANts neurons. We found that estradiol-priming increased the number of evoked action potentials (Fig.5e–f) and resulted in larger Ca2+ signals (Fig.S4a–c), compared with controls. mPOANts neurons also showed reduced action potential half-width and an increase in A-type K+ channel conductance following estradiol replacement (Fig.5g–h). This suggests that estradiol controls mPOANts excitability, at least in part by increasing the function of delayed rectifier K+ channels, which rapidly repolarize the neurons to allow high frequency action potential generation. Collectively, these data illustrate how estradiol enhances the intrinsic excitability of mPOANts neurons that might permit for enhanced sensitivity to appetitive cues.
Figure 5.
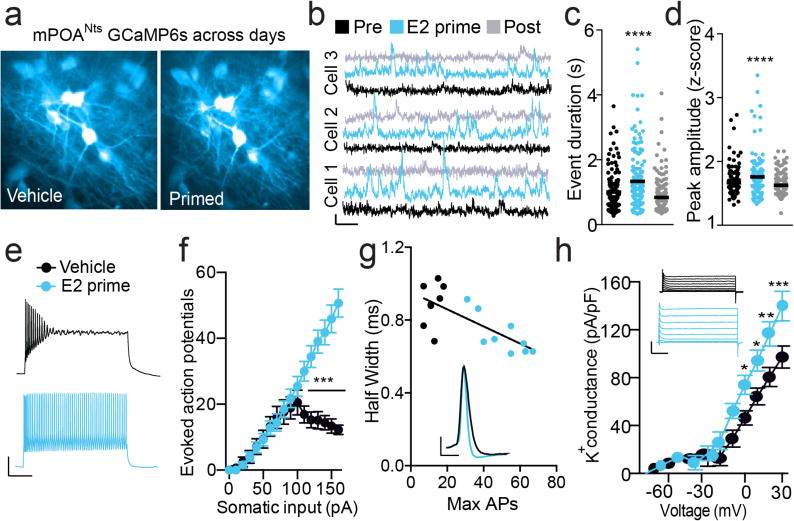
Estradiol enhances neuronal excitability in mPOANts neurons. (a) Two-photon image of the same mPOANts::GCaMP6 cells imaged after vehicle or estradiol priming. (b) Example Ca2+ traces showing normalized fluorescence F/F0 of GCaMP6s Ca2+ dynamics from the same mPOANts::GCaMP6 on different treatment days. Pre, vehicle 1 week before estradiol replacement; E2 prime, 5 h after estradiol; post, vehicle 1 week after estradiol (b–d). Scale bar: x, 20 s; y, 20% ÆF/F. (c) mPOANts::GCaMP6 cells displayed Ca2+ events longer in duration after estradiol treatment (bars are means; data points, individual cells; repeated-measures (RM) ANOVA, F2,252 = 35.46, P < 0.0001, n = 143 cells combined across 4 mice). (d) mPOANts::GCaMP6 cells displayed Ca2+ events higher in amplitude after estradiol treatment (error bars, ± s.e.m., RM one-way ANOVA, F2,252 = 17.32, P < 0.0001, n = 143 cells combined across 4 mice). (e) Example traces of current-clamp recordings in mPOANts::eYFP cells from ovariectomized mice by treatment. Scale bars: x, 200 ms; y, 25 mV. In e–g, black represents vehicle; blue, estradiol. (f) mPOANts::eYFP cells from estradiol-treated mice have more evoked action potentials with increasing current (error bars, ± s.e.m.; two-way ANOVA, interaction F16,240 = 32.40, P < 0.0001, vehicle: n = 8 cells, E2: n = 9 cells; 3 mice per group). (g) Inset: representative action potential from recordings in a mPOANts::eYFP cell by treatment. Scale bars: x, 2 ms, y, 25 mV. Correlation plot: mPOANts::eYFP cells from estradiol-treated mice were correlated with a decrease in spike half-width (error bars, ± s.e.m., Pearson R2 = 0.53, P = 0.0010, vehicle: n = 8 cells, E2: n = 9 cells, 3 mice per group). (h) Inset: Example traces of A-type isolated potassium channel recordings in mPOANts::eYFP cells by treatment. Scale bars: x, 25 ms; y, 2.5 nA. Graph: A-type potassium current conductance is greater in mPOANts::eYFP cells treated with estradiol (error bars, ± s.e.m.; two-way ANOVA, interaction F11,308 = 5.88, P < 0.0001, vehicle: n = 13 cells, E2: n = 17 cells, vehicle: 2 mice; E2: 3 mice).
Stimulation of mPOANts-VTA neurons promotes reward and ventral striatal dopamine release in a steroid-responsive manner
Appetitive cues excited mPOANts neurons and we next tested whether optogenetic activation of these neurons would convey positive valance signals and reinforce behavioral actions. We targeted mPOANts neurons with the light-gated cation channel, channelrhodopsin-2 (ChR2-eYFP), and implanted optical fibers above the mPOA to permit for optogenetic stimulation (Fig. 6a–c). Intact female mice were tested for reward-related phenotypes across all four stages of the estrous cycle, as assessed by vaginal lavage26 (Fig. S7a). We observed that females readily nose poked to receive photostimulation of mPOANts::ChR2 neurons at multiple stimulation frequencies, and the number of nose pokes varied across the estrous cycle with the greatest number displayed in proestrus (Fig. 6d,e, Fig. S7b,c and Video 3). Photostimulation also produced a real-time place preference in mPOANts::ChR2 females across all four stages of the estrous cycle, but with cyclical changes in the magnitude of preference that were also higher in proestrus (Fig. 6f–h and Video 4). To test for potential sex differences in the rewarding effects of mPOANts stimulation, a cohort of males were tested under the same parameters. In contrast to females, photostimulation produced a more consistent real-time place preference across four consecutive days in mPOANts::ChR2 males, compared with mPOANts::eYFP controls (Fig. 6i,j). In addition, photostimulation enhanced movement velocity in both male and females (Fig.S7d,e). We confirmed that this approach resulted in the activation of mPOANts neurons, as photostimulation induced Fos expression in mPOANts::ChR2 mice but not mPOANts::eYFP controls (Fig.S8a–c). Collectively, these data demonstrate that stimulation of mPOANts neurons produces reinforcement in both sexes.
Figure 6.
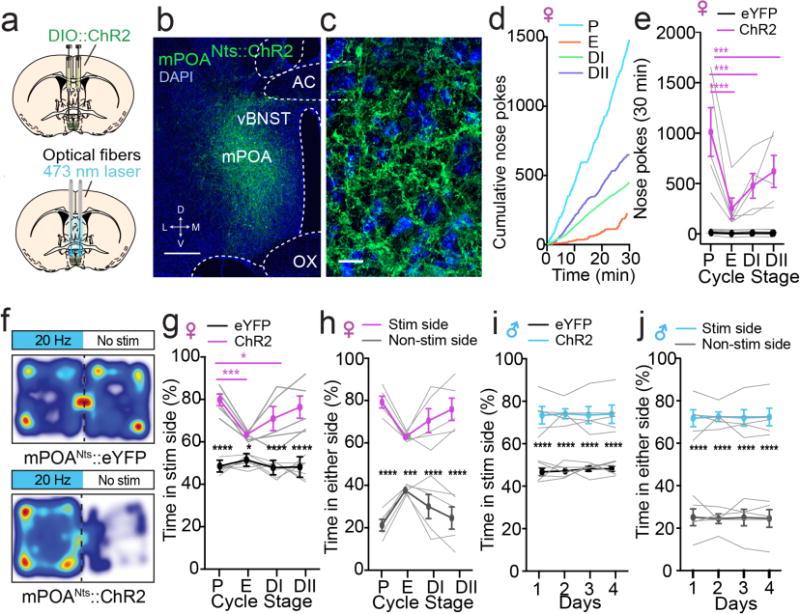
Stimulation of mPOANts neurons is reinforcing in both sexes. (a) Schematic depicting viral and optogenetic approach for stimulation of mPOANts neurons. (b) Confocal image of mPOANts ChR2-eYFP expression (green) and DAPI (blue). vBNST: ventral bed nucleus of the stria terminalis, AC: anterior commissure, OX: optic chiasm, D: dorsal, V: ventral, M: medial, L: lateral; scale bar, 200 ìm. (c) Confocal image of mPOANts ChR2-eYFP (green) and DAPI (blue). Scale bar, 20 ìm. (d) Cumulative nose poke performed for self-stimulation in each stage of the estrous cycle from a representative mPOANts::ChR2 female mouse. P: proestrus, E: estrus, DI: metestrus, DII: diestrus. (e) mPOANts::ChR2 female mice readily nosepoke in the active port to obtain photostimulation and mPOANts::eYFP controls do not. mPOANts::ChR2 females poke more in proestrus compared to all other stages (error bars, ± s.e.m., two-way ANOVA, interaction F3,27 = 12.70, P < 0.0001, ChR2 n = 5, eYFP = 6 mice). Individual data points are shown as gray lines. (f) Color heat maps illustrating the spatial location in the real-time place preference for a representative mPOANts::ChR2 female and mPOANts::eYFP control mouse in proestrus. (g) mPOANts::ChR2 female mice spent significantly more time in the photostimulation side of the chamber in all stages compared to mPOANts::eYFP females and had a higher preference in proestrus compared to estrus and metestrus (error bars, ± s.e.m., two-way ANOVA, interaction F3,30 = 9.44, P = 0.0002, ChR2 n = 5, eYFP = 7 mice). (h) mPOANts::ChR2 female mice spent significantly more time in the photostimulation side of the chamber compared to the non-photostimulation side in all stages of the cycle (error bars, ± s.e.m., two-way ANOVA, interaction F3,24 = 15.2, P < 0.0001, ChR2 n = 5, eYFP = 5 mice). (i) mPOANts::ChR2 males spent significantly more time in the stimulation side of the chamber compared to mPOANts::eYFP controls, with no effect of day (error bars, ± s.e.m., two-way ANOVA, group effect, F1,9 = 63.1, P < 0.0001, n = 5–6 mice per group). (j) mPOANts::ChR2 male mice spent significantly more time in the photostimulation side of the chamber compare to the non-photostimulation on all 4 d (error bars, ± s.e.m., two-way ANOVA, group effect F1,8 = 92.75, P < 0.0001, n = 5 mice per group).
Although mPOANts neurons promoted reward-related phenotypes that varied in magnitude across the estrous cycle, it remained unclear whether steroids directly modulated these effects, and how these cells orchestrate the output of motivated behavior through recruitment of downstream circuit targets. mPOANts::ChR2 assisted anterograde neuroanatomical tracing revealed dense fiber expression in the VTA from these cells (Fig. 7a), consistent with the identification of mPOANts cells as VTA-projecting neurons (Fig.1a,b). We then targeted optogenetic stimulation to either the mPOANts cell bodies or mPOANts-VTA fibers before and after steroid-priming (estradiol and estradiol-progesterone) in ovariectomized female mice (Fig. 7a). Photostimulation of mPOANts cell bodies or mPOANts-VTA fibers induced a modest real-time place preference in mice that was substantially amplified following estradiol replacement, but not after repeated stimulation under vehicle conditions (Fig.7c and S9a). Interestingly, this steroid-priming regimen of estradiol followed by progesterone, known to induce sexual receptivity27, resulted in a sustained increase in the reward effects of mPOANts::ChR2 stimulation for many consecutive weeks (Fig.S9a).
Figure 7.
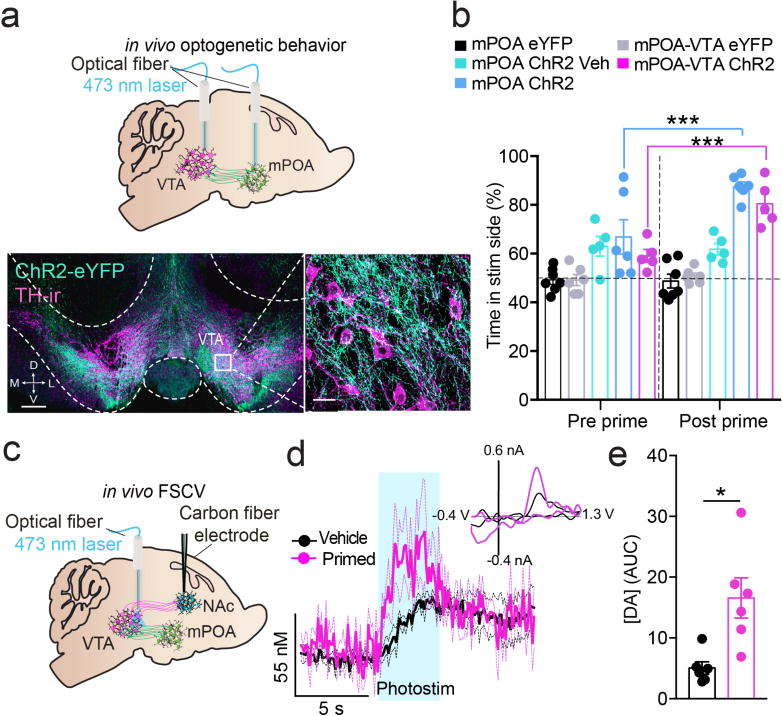
Stimulation of mPOA–VTANts neurons is reinforcing and evokes striatal dopamine release. (a) Top: optogenetic stimulation targeted at mPOANts::ChR2 neurons or mPOA–VTANts::ChR2 projecting fibers. Bottom: confocal image of mPOA–VTANts::ChR2 projecting fibers (green) and TH expression (magenta) in the VTA. TH: tyrosine hydroxylase, D: dorsal, V: ventral, M: medial, L: lateral. Left scale bar, 200 ìm. Right scale bar, 20 ìm. (b) mPOA::ChR2 and mPOA–VTANts::ChR2 mice spent more time on the photostimulation side of the chamber, and this was amplified following estradiol priming compared with that in vehicle controls (error bars, ± s.e.m.; two-way ANOVA, interaction F4,24 = 7.04, P = 0.0007, n = 5 or 6 mice per group). (c) Schematic depicting optogenetic targeting of mPOA–VTANts::ChR2 projecting fibers in conjunction with fast-scan cyclic voltammetry (FSCV) to detect dopamine release in the nucleus accumbens (NAc) of the ventral striatum. (d) Photostimulation mPOA–VTANts::ChR2 projecting fibers increased dopamine concentrations in the ventral striatum, and concentrations were higher in estradiol-treated mice (error limits, ± s.e.m., two-way ANOVA, interaction F149,1490 = 1.42 P = 0.0012, n = 6 mice per group). Blue bar indicates optical stimulation (3 s, 20 Hz). Inset: average background-subtracted cyclic voltammograms demonstrating characteristic oxidation and reduction peak potentials that identify dopamine. (e) Estradiol treatment resulted in a higher area under the curve (increased dopamine concentrations) during photostimulation of mPOA–VTANTS:ChR2-eYFP fibers. (error bars, ± s.e.m.; unpaired t-test, t5.971 = 3.328, P = 0.016, n = 6 mice per group).
To determine whether activation of the mPOANts-VTA pathway evoked mesolimbic dopamine release, we employed in vivo fast-scan cyclic voltammetry in anesthetized females and recorded dopamine release in the NAc (Fig. 7c). Photostimulation of mPOANts-VTA fibers evoked dopamine release in the NAc that was greater in estradiol-primed females compared with controls (Fig. 7c–e). Together, these data indicate that mPOANts neurons promote rewarding phenotypes through interactions with mesolimbic dopaminergic circuits in the VTA. Further, these behavioral outputs as well as their physiological dopamine correlates were magnified in steroid-primed females; functionally identifying a molecularly-defined steroid-responsive reward pathway.
Optogenetic modulation of mPOANts neurons regulates social attraction
We next examined whether mPOANts neurons and their projections to the VTA are involved in social approach behavior toward a reproductive social stimulus. We measured attraction and preference for an intact male versus ovariectomized female stimulus in a social investigation assay, during alternating time epochs of photostimulation (see methods and Fig.8a). Time epochs were selected over proximity or zone related photostimulation parameters, since activation of this circuit reinforces behavior and could condition responses that might not be socially driven. Testing was conducted in the same females and males used as above (Fig.S9a–d). Photostimulation of mPOANts::ChR2 neurons or the mPOA-VTANts::ChR2 pathway enhanced male preference and increased the amount of time spent in the male social interaction zone, only in ChR2-expressing females previously treated with steroids (Fig.8b–e and Video 5). In males, photostimulation of mPOANts::ChR2 enhanced female preference and increased the amount of time spent in the female social interaction zone (Fig.S9b–d). Together, these data suggest that mPOANts neurons direct behavior toward opposite-sex conspecifics in both sexes to drive social attraction toward a potential mate.
Figure 8.
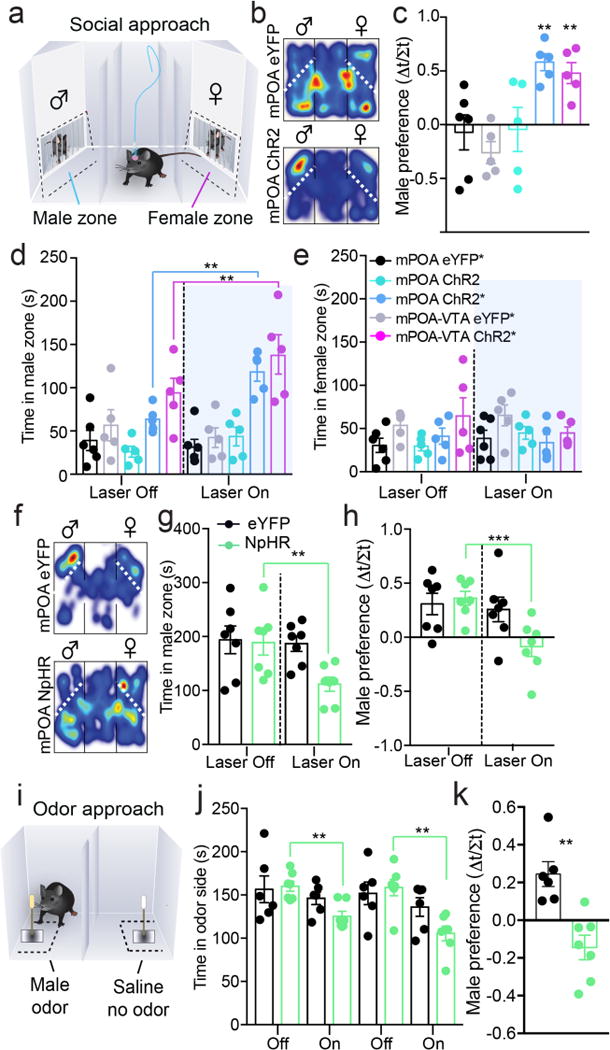
Optogenetic modulation of mPOANts neurons regulates social attraction. (a) Schematic illustrating the social preference test for an adult male or female conspecific, tested during alternating periods of light delivery. (b) Representative color heat maps displaying the spatial location of a steroid-primed mPOANts::ChR2 female and steroid-primed mPOANts::eYFP control mouse in the social preference test. (c) Photoactivation enhanced male preference in mPOA::ChR2 and mPOA–VTANts::ChR2 mice previously primed with steroids (error bars, ± s.e.m.; one-way ANOVA, F4,21 = 6.82, P = 0.0011, n = 5 or 6 mice per group). Colors and key legends are shown in e for c–e. Asterisk denotes mice that received prior but not recent estradiol and progesterone priming. (d) Photoactivation increased the amount of time spent in the male zone in mPOA::ChR2 and mPOA–VTANts::ChR2 mice previously primed with steroids (error bars, ± s.e.m.; two-way ANOVA, interaction F4,21 = 6.35, P = 0.0016, n = 5 or 6 mice per group). (e) Photoactivation did not increase the amount of time spent in the female zone (error bars, ± s.e.m., two-way ANOVA, interaction F4,21 = 1.33, P = 0.29, eYFP n = 6, ChR2 n = 5). (f) Representative color heat maps displaying the spatial location of a steroid-primed mPOANts::NpHR female and steroid-primed mPOANts::eYFP control mouse in the social preference test. (g) Steroid-primed mPOANts::NpHR females had a lower male preference during light delivery, compared to steroid-primed mPOANts::eYFP controls (error bars, ± s.e.m.; two-way ANOVA, interaction F1,12 = 7.15, P = 0.02, n = 7 mice per group). (h) Steroid-primed mPOANts::NpHR females spent less time in the male interaction zone during light delivery, compared to steroid-primed mPOANts::eYFP controls (error bars, ± s.e.m., two-way ANOVA, interaction F1,12 = 9.8, P = 0.009, n = 7 per mice group). (i) Illustration of a behavioral odor preference assay comparing the animal’s time in the zone containing male urine or saline. (j) Steroid-primed mPOANts::NpHR females spent less time in the male odor zone during light delivery, compared to steroid-primed mPOANts::eYFP controls (error bars, ± s.e.m., two-way ANOVA, laser effect F3,33 = 6.05, P = 0.0021, n = 7 mice per group). (k) Photoinhibition decreased the preference index for male odor in mPOANts::NpHR females (error bars, ± s.e.m., unpaired t-test, t11 = 8.30, P < 0.0001, n = 6–7 mice per group). *P < 0.05; **P < 0.01; ***P < 0.001.
Since steroids act to promote mate attraction in females21,28, we next tested whether endogenous activity of mPOANts neurons is required for sex-specific approach behavior in the presence of steroid-priming. Here, mPOANts neurons were targeted to express the inhibitory light gated chloride pump, halorhodopsin (NpHR), or control (eYFP) in ovariectomized female mice. Steroid-priming plus mating was necessary to first naturally elicit a male preference phenotype (Fig.S9e) as others have found21,29. Photoinhibition in steroid-primed (estradiol-progesterone) mPOANts::NpHR females impaired male preference and reduced male but not female investigation (Fig.8f–h and Fig.S9f). Since mate approach is facilitated by hormones and chemosensory cues21, we also tested male odor preference in steroid-primed females (Fig.8i) and found that photoinhibition of mPOANts::NpHR neurons impaired behavioral preference for male urine (Fig.8j,k). It is unlikely that optogenetic modulation of these cells produced aversive effects that impaired social investigation, since photoinhibition did not produce a real-time place aversion in the presence or absence of steroid-priming (Fig.S9g). Finally, optogenetic modulation of mPOANts neurons did not affect palatable food consumption, although mPOANts::ChR2 stimulation increased food zone approach bouts (Fig. S10a–o). This is in line with our in vivo imaging data, indicating that some mPOANts neurons are excited by food-related odors, versus male or female social odors (Fig. 4). Together, these experiments indicate that steroids enhance mPOANts neuronal function to facilitate approach behavior towards attractive social and nonsocial stimuli.
Discussion
Historically the mPOA has been considered an evolutionarily conserved region for social behaviors and homeostatic functions3,8. However, it has remained unclear whether mPOA circuitry orchestrates the appetitive and reinforcing aspects of social and non-social motivated behavior. Here, we provide evidence that mPOA-VTANts neurons covey positive valence signals, reinforce behavioral actions, and regulates ventral striatal dopamine release. It seems likely that mPOA-VTANts fibers may directly inhibit VTA GABAergic neurons to promote motivation, given that the majority of mPOANts neurons project to the VTA, that these neurons are almost exclusively Vgat positive, and that VTA GABAergic neurons inhibit VTA dopamine neurons30–33. Thus, we speculate that activation of mPOA-VTANts fibers produces ventral striatal dopamine release via disinhibition of VTA dopamine neurons. Consistent with this, GABAergic VTA inputs, such as those from the lateral hypothalamus and bed nucleus of the stria terminalis (BNST), largely act to inhibit VTA GABA neurons to evoke dopamine release and promote reward-related behaviors34,35.
While we found that most mPOANts neurons project to the VTA, this comprised roughly a third of all mPOA-VTA projecting neurons (though viral targeting and retrograde tracing does not label every Nts or VTA projecting neuron). This suggests that other molecularly-defined mPOA subsets may have different encoding and behavioral properties compared to those described here. In the neighboring vBNST, GABAergic and glutamatergic VTA-projecting neurons differentially control rewarding and aversive motivational states, respectively34. Here, mPOA-VTANts stimulation promoted not only rewarding phenotypes, but also approach behavior toward an opposite-sex conspecific. Molecularly defined VTA-projection neurons might control distinct types of motivated behaviors (e.g., social, feeding, aversion), as well as different aspects of those behaviors (e.g., appetitive vs. consummatory). Using in vivo Ca2+ imaging, we found that some mPOANts neurons were engaged by multiple types of social stimuli but were unresponsive to appetitive non-social odor, and vice versa. This suggests that social versus nonsocial appetitive stimuli might recruit different neural ensembles within this mPOA reward circuit, and it is largely unclear whether different types of rewards are processed through distinct pathways within reward systems. In addition to distinctions between which neurons were excited, we observed variance in the magnitude of excitation in response to different odors within the same neurons. Different types of appetitive stimuli produced varying degrees of mPOA-VTANts circuit activation, with opposite-sex stimuli being the most potent activator, which might serve to promote and reinforce reproductive behaviors essential for species survival.
While male odor was the most robust modulator of mPOANts neural activity, is it is unknown whether this circuit is biased towards reproductive stimuli restricted to mating or if this extends to other forms of social stimuli relevant to offspring and species survival, such as infant cues. Here, a subset of mPOANts neurons co-expressed Gal, which has previously served as a marker for mPOA neurons essential for parental behaviors in both male and female mice14. Maternal functions also require mPOA-VTA circuits4,6, but it is unknown whether the motivational aspects of mating and parenting share a common mPOA-VTA pathway that is appropriately tuned by hormonal profiles and social/reproductive experience or if there are distinct pathways for different social behaviors. Steroids including estrogen influence peptide hormones4, which influence mating and infant care through actions in the mPOA, putatively on VTA-projecting neurons4,6. Thus, a number of hormone/peptide and experience-induced changes could modify and tune this pathway in a context-specific manner. Mating and parenting induce distinct mPOA Fos activation patterns in male mice14, which could reflect the diversity of sensory and motoric aspects associated with different types of social interactions. Here, we restricted our imaging to different types of social and nonsocial odors, in order to rigorously differentiate between distinct salient stimuli processed through the same sensory modality. While less naturalistic, we used automated time-locked odor delivery in head-fixed mice to avoid movement interference, control the proximity and timing of the odor stimulus (rather than the mouse controlling it), and to allow for multiple trials to ensure consistency. Since females were more innately attracted to male odor stimuli over female stimuli, and male odor presentation produced the greatest activation of mPOANts neurons, this could reflect a bias towards the most motivating stimulus and/or relate to a male-specific sensory detection. In the present optogenetic tests, an opposite-sex behavioral preference was also detected, though it is possible that stimulation of this pathway might drive social approach towards other forms of social or same-sex stimuli in the absence of a competing potential mate. It also remains unknown which sensory or chemical components associated with detecting male odor were driving activation of this pathway. Compared with female urine, intact male urine contains a different profile of gonadal steroids21 and male-specific pheromone proteins including major urinary proteins, such as Darcin36, that promote mate attraction in female rodents. Future studies should utilize in vivo chronic imaging approaches from molecular and projection specific mPOA populations under a range of social and hormonal sex-specific contexts and following social experience.
The incentive value of particular stimulus is dependent on a number of internal physiological factors (e.g., hormonal levels and the homeostatic state of the animal) that are in constant flux. Here, mPOANts neurons adjusted their basal and evoked-odor activity dynamics across hormonal states. Multiple chemosensory inputs converge in the mPOA7,37, and our studies indicate that steroids prime social odor-sensing neurons to be more responsive to male signals. Estrogens can increase sensitivity to both chemosensory and auditory male cues21 and estrogen replacement in ovariectomized females decreases detection thresholds for male urinary odor38. A recent study used ex vivo Ca2+ imaging in female mice to reveal that vomeronasal sensory neurons detect attractive male pheromones in a steroid-sensitive manner39. Thus, steroids could be altering the processing of male stimuli at the multiple sites within the social brain network, through a number of mechanisms, which can be clearly delineated in future studies.
Our in situ data and other studies40 show that mPOANts neurons contain estradiol receptors (ESR1). Steroids including estradiol can induce slower genomic actions through binding of nuclear steroid receptors that act as transcription factors to promote or repress gene expression in the hypothalamus41. Here, estradiol enhanced Nts and VGat mRNA in mPOA neurons, though since the Nts promoter lacks palindromic estrogen response elements, estradiol likely increased Nts mPOA expression through a PKA-dependent signaling pathway, as others have found18. Estradiol can also exert rapid non-genomic actions through acting at membrane-bound receptors or ion-channels, that stimulate intracellular signaling pathways and can increase or decrease cell excitability42,43. Indeed, we showed that estradiol enhanced the intrinsic excitability of mPOANts neurons in part by increasing delayed rectifier K+ channel conductance, thus preventing action potential amplitude attenuation and failure. In agreement with our slice data, estradiol-priming prior to imaging enhanced Ca2+ dynamics, which were characterized by elevated event amplitude and duration. Since, steroids were administered hours and days prior to preparing tissue for slice electrophysiological recordings or examining behavioral and neuronal encoding, this time frame permits for slower genomic actions that alter the expression of genes, receptors, or ion channels. It is also possible that prior in vivo estradiol altered the expression of K+ channels as seen in the arcuate nucleus44, and/or that ex vivo estradiol in the bath, for electrophysiological recordings, directly affected K+ channel activity42.
Apart from estradiol, a number of other steroid and peptide hormones could also orchestrate the activity of this circuit in male and females. Here, estradiol was sufficient to enhance responsiveness to male odor cues and amplify the rewarding effects of mPOA-VTANts photoactivation and dopamine release in the ventral striatum. In line with our findings, other studies identified that mPOA-VTA projections from the mPOA contain estrogen receptors (membrane-bound and nuclear) and estradiol administration restricted to the mPOA enhanced drug-induced ventral striatal dopamine release12,13. Estradiol can also increase expression of progesterone receptors and these steroids act in combination to induce sexual receptivity in rodents45. However, we did not disentangle between contributing effects of estradiol and progesterone or identify which types of receptors were mediating the observed outcomes. Future studies should identify how different hormones and their underlying mechanisms influence the processing of social and nonsocial salient signals by mPOA neurons.
Conclusions
Here, we implement a multifaceted approach in order to disentangle in vivo neural encoding properties and circuit functions modulated by different hormonal contexts. Further, these studies suggest that neural networks excited by social signals are embedded within valence-processing circuits and can directly orchestrate motivational states. While many studies have used in vivo circuit strategies to study social or motivated behaviors, our understanding of how positive and negative valence circuits are intertwined with social networks is in its infancy. Our future studies will continue to use circuit strategies in conjunction with in vivo imaging to resolve whether precise neurons encode with reward-type specificity and whether the same networks integrate not only different types of rewarding stimuli, but also aversive signals that could underlie complex interactions between stress, social functioning, and reward-related deficits.
Collectively, these studies demonstrate how hormonal signals fine-tune neural circuit dynamics at key reproductive network nodes to translate sensory input into socially-directed motivated behavior essential for species survival. Uncovering neural circuits that function to bridge social and reward processing will provide important insights for social and affective disorders. Moreover, while steroid-mediated shifts in neural processing are generally adaptive for reproductive strategies, such actions can destabilize mood in some women46,47 and contribute to hormonal and sex-related influences in drug addiction48,49. Further elucidation of steroid-sensitive circuits that control motivational states may provide novel therapeutic targets for sex-biased psychiatric and reproductive mood disorders.
Online methods
Animals and Surgeries
Subjects
Nts-IRES-Cre mice1 were maintained and Nts-Cre or wild type littermate mice were group housed according to sex (20–30g; 6–9 weeks old) until surgery or behavioral testing. Mice were maintained on a reverse 12-hr light cycle (lights off at 07:00) with ad libitum access to food and water. All procedures were conducted in accordance with the Guide for the Care and Use of Laboratory Animals, as adopted by the NIH, and with approval of the Institutional Animal Care and Use Committee at the University of North Carolina at Chapel Hill (UNC).
Subject history
All wild-type animals were randomly assigned to groups. In cases of experiments with transgenic mice, groups requiring the presence or absence of Cre were determined by the genotype of the mouse and then randomly distributed. Animals were naïve to experimental testing before being assigned to a study. Optogenetic behavioral modulation experiments were conducted with the following cohorts of animals and tested under specified assays. Intact females for optogenetic activation were tested across the estrous cycle for the real-time place preference and optical self-stimulation. Intact males for optogenetic activation were tested for real-time place preference and social approach behavior. Ovariectomzied females for optogenetic activation were tested for real-time place preference, social approach assay, and high-fat diet assay. Ovariectomzied females for optogenetic inhibition were tested for real-time place preference, social approach assay, high-fat diet assay, and odor preference.
General procedures
For all surgeries descried below, mice were anesthetized with 0.8–1.5% isoflurane mixed with pure oxygen (1 L/min) and placed within a stereotactic frame (David Kopf Instruments) and all surgical instruments and materials were sterilized. Ophthalmic ointment (Akorn) and a topical anesthetic (2% Lidocaine; Akorn) were applied during surgeries, and subcutaneous injections of sterile saline (0.9% NaCl in water) were administered to prevent dehydration. Following surgeries, mice received acetaminophen in their drinking water for two days and were monitored for 7 days or until full recovery.
Viral Constructs
Cre-inducible AAV5-EF1α-DIO-hChR2(H134R)-eYFP; 4.3×10¹² infectious units/mL, AAV5-EF1α-DIO-eYFP; 6.0×10¹² infectious units/mL, and AAV5-EF1α-DIO-eNpHR3.0-eYFP; 6.0×10¹², AAVdj-EF1α-DIO-GCaMP6s; 3.1×10¹² infectious units/mL; were packaged by the UNC vector core and delivered stereotaxically in the mPOA of anesthetized mice.
Viral and Optogenetic Surgery
For all virus surgeries for optogenetics, slice physiology, or anatomical tracing, animals were anesthetized and treated as described above. Bilateral injections of Cre-inducible virus (500 nl/side) was administered at a 10° angle into the mPOA (relative to bregma: AP, +0.15 mm; ML, ± 1.30 mm; DV, −5.10 mm). For retrograde anatomical tracing, Red Retrobeads (Lumafluor) were bilaterally injected (300 nl/side) at a 10° angle into the VTA (relative to bregma: AP, −3.12 mm; ML, ± 1.30 mm; DV, −5.0 mm). For optogenetic surgeries, custom-made chronic optical fibers2 were also implanted bilateral at a 10° angle ~0.50 mm above the mPOA or VTA target site relative to the coordinates listed above. For behavioral experiments targeting optogenetic stimulation to the mPOA or VTA the same mice were used and fibers were implanted in both regions. Following surgery, we allowed sufficient time for viral infection and transgene expression. The time course between viral injections and the start of experiments was 4 – 6 weeks for optogenetic cell body manipulations and ex vivo slice physiology and 7 – 8 weeks for optogenetic terminal manipulations.
GRIN Lens Surgery
For deep-brain in vivo two-photon calcium (Ca2+) imaging experiments, animals were anesthetized as described above and the cre-inducible genetically encoded Ca2+ indicator GCaMP6s3, was unilaterally injected into the mPOA (500 nl at 2 D-V axes; relative to bregma: AP, +0.05 mm; ML, ± 0.25 mm; DV, −4.95 and −5.15 mm). Prior to injections, the craniotomy site was carefully prepared and tissue aspirated within minimal bleeding4. Then a gradient-refractive index (GRIN) lens (7.3 mm length, 0.6 mm diameter, Inscopix GLP-0673) was slowly stereotaxically lowered to a location directly above the mPOA at different coordinates than the viral injection site (relative to bregma AP, +0.10 mm; ML, ± 0.35 mm; DV, −4.75 mm) to avoid placing the lens in the immediate area of the injection track that typically exhibits autofluorescence that could interfere with imaging. Lastly, a custom-made ring (stainless steel; 5 mm ID, 11 mm OD) was attached to the skull during surgery to allow for subsequent head fixation (see Figure 5a). Animals were monitored for GCaMP6 expression 4 weeks after surgery using 2-photon microscopy as described below and only those with dynamic GCaMP6 expression in at least 50 cells and absent of autofluorescence were used for imaging experiments.
Ovariectomy and hormone replacement
Females were anesthetized as described above and ovariectomized through bilateral flank incisions. The ovary was located in a fat pad just beneath the muscles and using forceps, the periovarian fat was gently grasped to lift and exteriorize the ovary. The uterine horn was then returned into the abdomen and the process repeated on the other side. The muscle of the posterior abdominal wall was then sutured and the exterior skin incision closed with sterile surgical staples. Mice were monitored daily following surgery and staples were removed a week later. Females recovered for at least 10 days prior to testing. Estradiol was administered at 10 μg and progesterone at 500 μg in 0.05 ml of sesame oil delivery s.c. and 48 hours apart since this regimen referred to as steroid priming has been shown to induce sexual receptivity and these levels of estradiol are comparable to physiological proestrus peak levels5–7. Vehicle injections consisted of 0.05 ml of sesame oil. Behavioral testing or physiological recordings were all conducted approximately 4–5 hours after the injection.
Estrous cycle monitoring
Female mice are spontaneous ovulators and typically have a 4–6 day estrous cycle that consists of four stages – proestrus, estrus, diestrus I/metestrus, and diestrus/II. Mice were habituated to handling and vaginal smears prior to the behavioral experiments. Before 09:00 hours, mice were swabbed daily regardless of behavioral testing to check for consistent cycling8,9 and underwent behavioral testing in the afternoon between 1300 – 1700 hours. Using a disposable pipette, a small volume of physiological sterile saline was placed near the opening of the vagina and 100 ul of saline was flushed in four repetitions without insertion to avoid pseudopregnancy. The smear was displaced onto a glass slide and immediately examined under a brightfield microscope at 20×. The identification of estrous stages was based on characteristic cell type appearance observed and the density of each cell type in the vaginal secretion. Estrous stage was identified by changes in cell type across the cycle that reflects circulating gonadal steroids. Note that “estrus” does not refer to “behavioral estrus” or the state of being sexually receptive. Females were only tested for behavior on days when a clear smear was visible and the cycle stage could easily be identified. In cases where a smear was unclear or an animal did not resume the anticipated estrous stage following optogenetic or behavioral stimulation, the animal was not tested until resuming consistent estrous cycling.
Behavioral Optogenetics
General Procedures for Light Delivery
Prior to behavioral testing, animals were habituated to handling and patch cable tethering in their home cage for at least four habituation sessions lasting ~10 minutes. For optogenetic manipulations, light ~10 mW from diode pumped solid-state lasers (473 nm or 532 nm) was delivered through custom-made patch cables attached to the implanted chronic fibers on animals’ head as described previously10,11. For photoactivation, 473 nm light was pulsed at 20 Hz with a pulse width of 5 ms. For photoinhibition experiments, 532 nm light was constantly delivered. Animals were able to freely move within the testing chambers with little hindrance and all behavioral testing was conducted under red incandescent lighting between 13:00 and 18:00 hours. For each behavioral assay, Ethovision or MedPC software and Arduino microcontrollers were used to control light delivery parameters through a TTL pulse.
Behavioral testing: schedule relative to hormone contexts
For intact cycling experiments, females were not run more than twice a week, to avoid disruption of the natural cycle. Females were smeared in the morning and behavior was tested in the afternoon as described above (Estrous cycle monitoring). For all hormone manipulation experiments in ovariectomzied females, animals were tested ~4–5 hours after injections as described above (Surgery - Ovariectomy and hormone replacement.).
Behavioral Testing: reward and feeding assays
For real-time place preference testing, subjects controlled the amount of light stimulation as determined by their center point location within the testing area in 20 min sessions. For optical self-stimulation, animals were given access to an active and inactive port and could nose poke to receive optical stimulation over a 30 min test period. For additional details on these behavioral assays see10. For optogenetic manipulation during a free-feeding assay, animals were given access to a high-fat food and consumption measured as previously described12,13.
Behavioral Testing: social and odor preference assays
For optogenetic manipulations during a social preference assay, subjects were placed in a standard 3-chamber social choice arena14 but instead two social stimuli were used in our paradigm (see Figure 8a). Stimulus mice were previously habituated to the holding chambers for at least 3 days prior to experimental testing. For female test subjects a wild type intact adult male or ovariectomized female stimulus mouse was placed into each of the social interaction holding chambers. For male test subjects, a hormone-primed ovariectomized female or adult male was used. Subjects were first habituated to the area in the absence of light delivery or social stimuli and screened for any innate side preference to the area. Light delivery occurred in alternating 5 min epochs for a total of 20 min. For NpHR cohorts, hormone-primed females were first mated in their home-cage to induce a male preference prior to behavioral testing. Since we observed reinforcing properties in response mPOANts stimulation, we used optogenetic modulation parameters that were not time-locked to occur with social proximity, since pairing could artificially condition and reinforce approach behavior.
For odor preference testing, subjects were placed into a rectangular arena and testing lasted for 20 min with light delivery alternated in 5 min epochs. Subjects were first habituated to the area for 10 min and screened for any innate side preference. Then, two square blocks placed on opposite walls of the arena tightly held either a cotton swab containing urine or physiological saline (60 ul per swab). See Figure 8i for graphical depiction. Wild type stimulus mice were habituated to a chamber containing a wire mesh floor without bedding and a drip pan for the collection of fresh mouse urine. Urine was pooled from 4 group housed male mice and 1 single housed adult male, since male urine contains female-attracting proteins (e.g. Darcin15) which are variable in expression across mice and can be influenced by social environment16. Female urine was pooled from 5 ovariectomized group-housed females. Peanut oil was used at full strength and (60 ul per swab) during testing. Peanut oil was first applied to a piece of food in the homecage the day prior to behavioral testing or imaging odor-evoked responses.
Behavioral Analysis
All behavioral experiments were recorded live with a video camera and PC equipped with live tracking software (Noldus, Ethovision XT). Automated measures of movement (velocity and distance) and the frequency and duration of time spent in each designated zone of the area was generated based on live tracking Ethovision software and calculated with respect to light condition. Preference indices for social or food stimuli were computed based on these metrics as previously described17. Food consumption was manually scored with assisted software (Noldus, Observer).
Two-photon in vivo Calcium Imaging
Head-fixed Imaging
To visualize Ca2+ dynamics in vivo, GCaMP6s was expressed in mPOANts neurons and a GRIN lens implanted to gain optical access to this deep brain region as described above (see Lens Surgery). Mice were habituated to head-fixation for at least 4 non-consecutive days with increasing time intervals (5 – 30 min) and then two-photon microscopy was used to visualize activity dynamics of mPOANts neurons in vivo. The last habituation session occurred in conjunction with two-photon imaging to select a particular field of view (FOV) by adjusting the imaging plane (z-axis) to select a different group of cells across multiple FOVs within each subject. Multiple FOVs were collected for baseline / spontaneous imaging sessions and a single FOV with the most cells was chosen for stimulus odor-evoked imaging sessions (to avoid time confounds).
Imaging: schedule relative to hormone contexts
Females were not imaged more than twice a week, to avoid disruption of the natural cycle. Females were smeared in the morning (see Estrous cycle monitoring) and imaging was conducted in the afternoon as described above. For all hormone manipulation experiments in ovariectomzied females, mice were imaged ~4–5 hours after injections as described above (for more hormone details see Surgery - Ovariectomy and hormone replacement.).
Spontaneous Ca2+ Activity
To examine spontaneous Ca2+ events across hormonal states, females were smeared (intact females) or injected (ovariectomized females) before 09:00 hours and mPOANts::GCaMP6 cells imaged in vivo ~4 hrs later. Baseline scans from each FOV were acquired for 10 min at 5 Hz as described below.
Odor-evoked Ca2+ Activity
For odorant delivery, fresh urine was collected using the same 5 male or female animals that were group-housed and urine was pooled together (see Behavioral Optogenetic Methods), since there are individual differences in the amount of proteins in male urine that attract the female mice. Urine was collected from the same stimulus mice were used across all imaging studies to ensure consistency within and between mice. Mouse urine from each sex or peanut oil was added to a chamber and vaporized through an airflow tank similar to room air and flowed out through a mask placed in front of but not touching the animal’s snout and a vacuum line on the adjacent side to remove any residual odor. Specifically, 160 ul of Urine diluted in dipropylene glycol was placed into a small chamber and odorants were delivered using a custom-made olfactometer. Medical air (2L/min) served as positive pressure that led to a mask situated in front of the subject’s snout with a vacuum line to help remove any residual odor (See Fig. 2a). To time odorant delivery during imaging, a microcontroller was programmed to initiate imaging and trigger a solenoid that switched from air to the odor tank. During each imaging session, two-photon scanning was triggered for each trial 10 s before odorant delivery, and a 40 s video was collected for each trial. Each odorant trial was delivered in 6–7 repetitions with a 2–3-min inter-trial interval to avoid odor habituation.
Two-photon Imaging acquisition
A two-photon Olympus microscope (FVMPE-RS) was equipped with the following: a hybrid scanning core set with galvanometers and fast resonant scanners (allows up to 30Hz frame-rate acquisition; set to 5 Hz), GaAsP-PMT photo detectors with adjustable voltage, gain, and offset, a long working distance 20× air objective designed for optical transmission at infrared and visible wavelengths (Olympus, LCPLN20XIR, 0.45NA, 8.3mm WD), a software-controlled modular XY stage loaded on a manual z-deck, and a tunable Mai-Tai Deep See laser with dispersion compensation (Spectra Physics, laser set to 955nm, ~100fs pulse width) with automated four-axis alignment. Data were both acquired and processed using a computer equipped with FluoView (Olympus, FV1200) software. For all sessions, time series images of mPOANts::GCaMP6 cells were collected using the resonant scanner at 30Hz with 6 frame on the fly frame averaging, which permits for final image acquisition at 5Hz. Software acquisition settings were optimized for each subject and set within the following range; Laser intensity: less than ~50 mW, PMT voltage: 650–675, Gain: 1.5, Offset: 2, Scan Size: 512 × 512, Zoom 1–1.5, Aspect Ratio: 1:1. For chronic imaging experiments the same FOV was acquired under the same imaging parameters and software acquisition settings across all days for comparison.
Data extraction and analysis
Following acquisition, data were exported as a tiff series and motion corrected using a planar hidden Markov model (SIMA v1.3;18) and regions of interest (ROIs) were hand drawn around each cell or dendrite on the standard deviation projection tiff image of the motion-corrected video using ImageJ. For chronic imaging experiments, the same ROI series file was loaded onto the tiff image and individual ROIs were adjusted to ensure proper alignment with each cell and only cells that could be reliably identified at the same FOV were included in subsequent analysis. Next, normalized calcium signals were then extracted from the ROIs using the SIMA objects and motion corrected imaging video and all subsequent analyses were conducted using freely-available Python packages (SIMA, numpy, scipy, pandas, seaborn). All analysis code can be found at www.gitub.com/stuberlab.
Event detection
For each ROI, extracted fluorescence intensity time series data were independently z-scored and then smoothed with a 3-frame rolling mean. Using the normalized and smoothed time series data, calcium transients were defined as events if the transient magnitude exceeded 1 standard deviation for at least 5 frames (1 s). The start and end of each event were defined as the points at which the normalized signal crossed the 1 standard deviation threshold, and the duration of each event was calculated using these boundaries. The peak amplitude was the maximum normalized intensity value within each event. For the rare instances in which acquisition started or ended during an ongoing calcium event, that event was removed from all subsequent analyses.
Detecting Odor-evoked Responses
Analyses were performed on SIMA-corrected fluorescence intensity time series data. For each ROI and each trial, normalized intensity values were calculated by dividing each value by the mean intensity of the baseline epoch (10 s immediately preceding odor presentation). Cell responsivity was assessed for each cell using the Wilcoxon signed-rank test across 6–7 trials per session. Mean baseline fluorescence was compared to the mean fluorescence during the odor epoch. Excited ROIs were those in which the odor response was significantly (p < 0.05) greater than baseline, and inhibited ROIs were those in which the odor response was significantly (p < 0.05) lower than baseline. The number of trials was consistent for each experiment (Fig. 2: 6 trials, Fig. 3 and 4: 7 trials) and all odor trials were included in the analysis for all subjects and all ROIs.
in vivo Fast-scan Cyclic Voltammetry
Fast-scan cyclic voltammetry (FSCV) experiments were conducted using method described in previous studies19,20. Briefly, mice were anesthetized and placed in a stereotaxic frame. A craniotomy was done above the nucleus accumbens (AP, +1.0 mm; ML, 1.0 mm) and the VTA (AP, −3.1 mm; ML, 0.3 mm). An Ag/AgCl reference electrode was implanted in the contralateral forebrain. An optical fiber (200 μm) was placed for the activation of ChR2-expressing VTA neurons (DV, from −4.0 to −4.6 mm). A carbon fiber electrode (~100 μm in length, 6 μm diameter) for voltammetric recordings was then lowered into the nucleus accumbens (DV, from −4.0 to −4.6 mm) in 0.2 mm intervals. Voltammetric measurements were made every 100 ms by application of a triangle waveform (−0.4 V to +1.3 V to −0.4 V vs. Ag/AgCl, at 400 V/s) to the carbon fiber electrode. Dopamine release was evoked by optical activation mPOA to VTA fibers using a 60 pulse-stimulation (5 ms single pulse duration) at 20 Hz. Therefore, optical stimulation of ChR2-expressing VTA fibers was applied for 3 s starting 5 s after the onset of the voltammetric recording. Recorded voltammetric signals showed an oxidation peak at +0.65 V and a reduction peak at −0.2 V (vs. Ag/AgCl reference), as well as characteristic cyclic voltammograms, ensuring that the released chemical was dopamine. Carbon fiber electrodes were calibrated in vitro with known concentrations of dopamine (1.0 and 5.0 μM). Calibrations were done in duplicate and the average value for the current at the peak oxidation potential was used to normalize in vivo signals to dopamine concentration. All voltammetry data were collected and analyzed using TarHeel CV software.
Patch-clamp electrophysiology
Mice were anesthetized with pentobarbital (50 mg/kg) before transcardial perfusion with ice-cold sucrose cutting solution containing the following (in mM): 225 sucrose, 119 NaCl, 1.0 NaH2P04, 4.9 MgCl2, 0.1 CaCl2, 26.2 NaHCO3, 1.25 glucose, 305 mOsm. Brains were then rapidly removed, and coronal sections 300 μm thick were taken using a vibratome (Leica, VT 1200). Sections were then incubated in aCSF (32°C) containing the following (in mM): 119 NaCl, 2.5 KCl, 1.0 NaH2P04, 1.3 MgCl, 2.5 CaCl2, 26.2 NaHCO3, 15 glucose, 305 mOsm. After an hour of recovery, slices were constantly perfused with aCSF (32°C) and visualized using differential interference contrast through a 40× water-immersion objective mounted on an upright microscope (Olympus BX51WI). Whole-cell recordings were obtained using borosilicate pipettes (3–5 MΩ) back-filled with internal solution containing the following (in mM): 130 K gluconate, 10 KCl, 10 HEPES, 10 EGTA, 2 MgCl2, 2 ATP, 0.2 GTP (pH 7.35, 270–285 mOsm).
We performed whole-cell current-clamp recordings of fluorescently-labeled mPOANTS:eYFP neurons or mPOANTS:GCaMP6s neurons to characterize the intrinsic excitability of mPOANTS neurons ex vivo21. During recordings, cells were held through slow polarization at −70mV to control for differences in resting membrane potential between neurons. Next, we measured rheobase (the minimum amount of current required for an action potential to fire) by applying a series of short depolarizing sweeps (50ms) at +5pA steps (starting at 0pA) until the recorded neuron fired an action potential. Next, action potential firing was examined by applying a series of 800ms depolarizing sweeps from 0 to 160pA (+10pA steps for excitability recordings, +20pA steps GCaMP6s recordings). For GCaMP6s experiments, during patch-clamp recordings we simultaneously recorded GCaMP6s fluorescence through a microscope-mounted camera (OptiMos, QImaging) using imaging software (MicroManager, ImageJ). Videos were subsequently motion-corrected if necessary, and data were extracted using ImageJ.
We also performed whole-cell voltage clamp recordings of fluorescently-labeled mPOANTS:eYFP neurons to measure K+ channel conductance ex vivo. Recordings were performed in the presence of the voltage-gated sodium channel antagonist tetrodotoxin (500nM), the nonselective voltage-gated potassium channel antagonist 4-aminopyradine (20 uM), and the GABAA receptor antagonist picrotoxin (100 uM). During recordings, cells were held at −80mV before 100ms depolarization (0 to 110mV, +10mV steps). A-type potassium current was then quantified by dividing the slower current deflections by the fast capacitive transient (pA/pF). For all patch-clamp experiments, data acquisition occurred at 1 kHz sampling rate through a MultiClamp 700B amplifier connected to a Digidata 1440A digitizer (Molecular Devices). Data were quantified using event analysis in Clampfit 10.3 (Molecular Devices).
FSCV and patch clamp recordings and in situ: schedule relative to hormone contexts
For all experiments, ovariectomzied females were given an initial dose of estradiol or vehicle 48 prior to a second dose and were euthanized ~4–5 hours after the last injections as described above (Surgery - Ovariectomy and hormone replacement.). This schedule was used to allow ample time for both genomic and non-genomic steroid actions22,23 and was used in prior physiology studies24,25. For patch clamp experiments, 1 uM of estradiol was also applied to the bath solution for brain slices from mice previously treated with estradiol in vivo.
Fluorescent in situ Hybridization
Tissue was processed using in situ hybridization to detect mRNA for Nts, Vgat (Slc32a1), and Vglut2 (Slc17a6). Mice were briefly anesthetized with 3.5 – 4.0% isoflurane mixed with pure oxygen (1L/min), rapidly decapitated and brains rapidly extracted and flash frozen on dry ice. 18-μm thick cryostat coronal sections were collected under RNAse-free conditions, fixed in 4% PFA for 15 min at 4°C, dehydrated in serial concentrations of ethanol (50%–100%), and processed according to the protocol provided in the RNAscope kit (Advanced Cell Diagnostics. INC, Cat. 320 293). Sections were hybridized with the following mixed probes; Nts (Mm-Nts, Cat. 420441), Vgat (Mm-Slc32a1, Cat. 319191), and Vglut2 (Mm-Slc17a6-C2, 319171), for 2 h at 40°C and following amplification, sections were counterstained with DAPI. For Nts and Cre, were performed in situ using the Affymetrix View RNA 2-Plex Tissue Assay Kit with custom probes for Nts (Mouse NM024435, Cat. VB1-16908) and Cre (Vector, HQ335171 Cat.designed by Affymetrix (Santa Clara, CA).
Immunohistochemistry and Histology
To evaluate optically evoked Fos, mice received 10 min of photostimulation in the home cage (473 nm, 20 Hz at 3 s) and were euthanized an hour later. Mice were euthanized with pentobarbital (50 mg/kg, i.p.) and transcardially perfused with 0.01M phosphate buffered saline (PBS) followed by 4% paraformaldehyde (PFA). Tissue was post-fixed overnight at 4°C in PFA and cyroprotected in 30% sucrose in PBS and 40-μm thick cryostat coronal sections were collected. To examine Fos induction, immunohistochemistry was carried out using the following antibodies: c-Fos primary raised in goat (Santa Cruz, cat# SC-52g, 1:500 over night at 4°C) and secondary (Jackson Immuno, donkey anti-goat 647 2 hours at room temperature) and processed as previously described. For TH staining TH primary raised in sheep was used (Pel-Freeze, cat#PG0101-150, 1:500 over night at 4°C). Tissue slices were slide mounted, DAPI counterstained, and coverslipped for subsequent confocal microscopy. For all other optogenetic behavioral cohorts and anatomical tracing experiments, mice were euthanized and tissue prepared as described (with the exception of IHC) for verification of viral expression and fiber placement. For in situ cohorts examining the effects of estrogen-induced Nts mRNA the tissue was processed in duplicate and the same pattern was observed upon replication. For verification of viral expression, all subjects were included in analyses unless post-hoc examination of tissue did not confirm the expected viral expression (e.g., ChR2, eYFP). This was the case for 2 mice and these subjects were removed from the analyses because the procedure is not valid without the proper viral expression. This exclusion criteria was established prior to conducting any of the present studies.
Confocal Microscopy
Images were captured with a confocal microscope (Zeiss LSM 780, Germany) and Zen software with a 20× air and 40× or 63× oil objective. Software settings were optimized for each experiment, but generally z-stacks were collected in less than 1 μm increments throughout the z-axis and the maximum intensity projection tiled image was used for representative or quantification purposes.
Protein and mRNA Quantification
For quantification of mPOA cells expressing Fos protein or Nts mRNA, an experimenter blind to the treatment group manually tagged cells using Image J and the Image J Cell Counter Plug-in. For quantification of mRNA intensity, an experimenter blind to the treatment condition drew ROIs of the same size around each cell within a single focal plane on the DAPI layer. Then intensity of mRNA expression within each ROI was automatically generated in Image J. These values were then used to determine if intensity crossed a threshold that designated the cell as positive for the gene of interest (e.g. Nts) and whether Nts positive cells co-expressed Vgat or Vglut2.
Experimental blinding
In all experiments, data were analyzed in an automated unbiased manner by a computer. For in vivo imaging and physiology data, Software or custom written Python codes were used to automate data analysis. The investigator was not blind to within group drug treatment, as it was necessary to administer the appropriate drug (e.g., hormone or vehicle) with respect to day or subject. The experimenter was also not blind to the odor treatment, as it was necessary to delivery the appropriate odor.
Statistics
The number of biological replicates in each experiment was at least 3 mice per group for anatomy, 4 – 8 mice per group for in vivo imaging or physiology, and between 5 – 7 mice per group for behavior. These numbers were chosen based on that used in previous experiments10,13. In addition, for behavioral experiments optogenetic stimulation or inhibition was alternated in repeated time epochs to ensure consistency in behavioral responses. For in vivo imaging experiments, odor was delivered in multiple trials for the same reason and in addition at least 50 neurons were recorded from each mouse, thus for these experiments 4 biological replicates yielded a large sample of data with consistent responses across mice and cells.
For experiments with hormone or light conditions Two-Way ANOVA’s were conducted with Bonferroni Post-hoc analyses. For anatomy experiments and AUC for FSCV Unpaired Student’s t-tests were conducted. For cumulative frequency distributions Kolmogorov-Smirov tests were conducted. For in vivo imaging a Wilcoxon paired t-test compared cell responses between odors or treatments. In all statistical measures a p value < 0.05 was considered statistically significant. To calculate behavioral preference indices, calculations were used based on prior studies17 where the amount of time spent investigating the stimulant of interest (e.g. opposite-sex odor or social stimulus) and the control side (e.g. control odor, saline or same-sex social stimulus) were scored using Noldus and the Preference Index (Δt/Σt) for the stimulus was calculated as follows:
Data availability
All custom codes have been made publically available at a GitHub repository affiliated with Stuber Lab group and this manuscript title (www.github.com/stuberlab). The data that support the findings of this study are available from the corresponding author upon reasonable request.
Supplementary Material
Supplementary Figure 1. Validation of VTA placement and nuclear ESR1 protein expression.
a. Schematic illustrates Retrobead tracer injection into the VTA and DIO-eYFP injection into the mPOA. VTA: ventral tegmental area, mPOA: medial preoptic area.
b. Confocal image of Retrobead injections into the VTA from a representative animal. PAG: periaqueductal gray, D: dorsal, V: ventral, M: medial, L: lateral, scale bar: 100 μm.
c. Confocal image of Nts Ai9 reporter expression (blue) and ESR1-ir (pink). ESR1: estrogen receptor 1.
d. Confocal image of Nts labeled and nuclear ESR1-ir in the mPOA scale bar: 40 μm.
Supplementary Figure 2. Expression of Vgat, Vglut2, and Nts in mPOA neurons.
a. Confocal image of Nts (green) and Vgat (blue) mRNA in the mPOA (left). Scale bar: 200 μm. Color dot plot from a representative brain slice illustrates the X-Y coordinates of each Vgat expressing cell that is also positive (green) or negative (blue) for Nts (right hemisphere). Scale bar: 500 μm, Nts: neurotensin, Vgat: vesicular GABA transporter, mPOA: medial preoptic area, vBNST: ventral bed nucleus of the stria terminalis, D: dorsal, V: ventral, M: medial, L: lateral, AC: anterior commissure, OX: optic chiasm.
b. Confocal image of Nts (green) and Vglut2 (pink) mRNA in the mPOA (left). Scale bar, 200 μm. Color dot plot from a representative subject illustrates the X-Y coordinates of each Vglut2 expressing cell that is positive (green) or negative (pink) for Nts. Scale bar, 500 μm, Vglut2: vesicular glutamate transporter, for remaining abbreviations refer above (A).
c. Confocal image Nts (green), Vgat mRNA (blue), and Vglut2 mRNA (pink) mRNA in the mPOA. Scale bar: 20 μm.
d. Cumulative distribution plot showing that the mean intensity of Nts expression within each cell that is positive for Nts is higher in estradiol treated mice compared to vehicle treated controls (Kolmogorov-Smirnov D = 0.53, p < 0.0001, 1,900 cells, n = 3 mice per group).
e. Cumulative distribution plot showing that the mean intensity of Vgat expression within each cell that is positive for Nts is higher in estradiol treated mice compared to vehicle treated controls (Kolmogorov-Smirnov D = 0.35, p < 0.0001, 1,900 cells, n = 3 mice per group).
f. Cumulative distribution plot showing that the mean intensity of Vgat expression within each cell that is negative for Nts is higher in estradiol treated mice compared to vehicle treated controls (Kolmogorov-Smirnov D = 0.11, p < 0.0001, 1,900 cells, n = 3 mice per group).
g. Cumulative distribution plot showing that the mean intensity of Vglut2 expression within each cell that is negative for Nts is higher in estradiol treated mice compared to vehicle treated controls (Kolmogorov-Smirnov D = 0.23, p < 0.0001, n = 3 mice per group).
h. Pie chart illustrates the percentage of Nts neurons co-expressing Vgat and/or Vglut2.
Supplementary Figure 3. Validation of Cre and Nts in mPOA-Nts-IRES mice.
a. Representative confocal image of Nts mRNA (green) in the mPOA. mPOA: medial preoptic area, vBNST: ventral bed nucleus of the stria terminalis, OX: optic chiasm, scale bar: 200 μm.
b. Representative confocal image of Cre mRNA (magenta) in the mPOA.
c. Merged confocal image of Nts mRNA (green) and Cre mRNA (magenta).
d. Representative confocal image of Nts mRNA (green) and Cre mRNA (magenta) in the mPOA. Scale bar: 40 μm.
e. Quantification of Nts mRNA (green) and Cre mRNA (magenta) overlap in the mPOA. Pie chart represents overlap.
Supplementary Figure 4. Validation and implementation of mPOANts in vivo calcium imaging.
a. Schematic represents whole cell patch clamp recordings in a mPOANts::GCaMP6 neuron while simultaneously imaging Ca2+ activity. Representative cell shows that increasing current injection increased the intensity of Ca2+ fluorescence.
b. Example calcium traces, F/F0 during patch clamp recordings in mPOANts::GCaMP6 cells from ovariectomized mice treated with vehicle (vehicle) or estradiol (E2) primed 48 hours and 4 hours prior to collecting slices.
c. Estradiol enhanced the Z-score of normalized peak response from baseline in mPOANts::GCaMP6 cells, compared to controls and increasing current injection increased z-score. (Two-Way ANOVA, interaction F8,104 = 4.47, p < 0.0001, Veh n= 6 cells, E2 n= 9 cells; 2 mice per group).
d. Schematic depicts surgery for expression the Cre-inducible GCaMP6s in mPOANts neurons and implanting a Gradient Refractive Index (GRIN) lens for two-photon optical access in awake head-fixed mice.
e. Image represents a standard deviation z-projection acquired from a motion corrected two-photon baseline recording from mPOANts::GCaMP6. Images were used for hand drawing regions of interests (ROIs) over cells.
f. Illustration is an overlay representing hand drawn regions of interest (ROIs) onto a standard deviation projection (c) for subsequent somatic Ca2+ signal extraction in individual neurons.
Supplementary Figure 5. Behavioral preference for attractive odors.
a. Schematic illustrates test for behavioral odor preference for an odor following a habituation to an empty arena.
b. Female mice had no side preference during habituation periods that occurred prior to odor testing (paired t-test, t1,9 = 1.09 p = 0.3061, n = 10 mice).
c. Nose-point time was highest during odor trials consisting of intact male urine, compared to all other odorants. (One-way Anova, F4,37= 10.60 p < 0.0001, n = 7–10 mice).
d. There was no difference in the amount of nose-point time in the saline control zone during each odor test. (One-way Anova, F4,37 = 1.05 p = 0.3950, n = 7–10 mice).
e. All odors induced a behavioral preference for the odor zone over the saline control zone and the preference index for male urine was highest than that of gonadectomzied male or female urine. (One-way Anova, F4,37 = 5.38, p = 0.0016, n = 7–10 mice).
f. Females had the highest odor zone approach bouts to male urine. (One-way Anova, F4,37 = 3.34, p = 0.0196, n = 7–10 mice).
g. Females did not display differences in saline approach bouts. (One-way Anova, F4,37 = 2.01, p = 0.1131, n = 7–10 mice).
Supplementary Figure 6. Behavioral and neuronal responses across hormonal states
a. Schematic illustrates steroid-priming of estradiol (E2) and subsequently progesterone (P4) 4–6 hours prior to behavioral odor testing and compared with an oil injection (vehicle).
b. Heat maps of total time spent in an odor zone from a representative female before and after estradiol priming.
c. Ovariectomzied females had a higher preference for male odor following estradiol priming that was sustained following progesterone administration, with no differences between steroid treatments (One-way Anova, F2,15 = 35.61, p = 0.0003, n = 6 mice).
d. Ovariectomzied females spent more time in the odor zone following estradiol priming and this was sustained following progesterone administration, with no differences between steroid treatments (One-way Anova, F2,15 = 27.86, p = 0.0008, n = 6 mice).
e. No treatment differences were detected in the amount of time spent investigating the control block. (One-way Anova, F2,15 = 1.76, p = 0.238, n = 6 mice).
f. Ca2+ signal normalized to baseline and averaged across male trials. Heat map illustrates response from the same 230 mPOANts::GCaMP6 cells across three separate imaging days. Cells are sorted by male odor response on the day of E2 administration (middle heat plot) and indexed in the same order for comparison on the day of Veh administration (left heat plot) and after P4 administration (right heat plot).
g. Top: Pie charts illustrate the percentage of cells excited (green) or inhibited (blue) in response to male odor by treatment. Bottom: Averaged Ca2+ traces from mPOANts::GCaMP6 cells significantly excited by male odor after estradiol, compared to their response after vehicle or progesterone. (Wilcoxon t-test, all p values < 0.05, n = 230 cells combined across 4 mice).
h. Ca2+ signal normalized to baseline and averaged across female trials. Heat map illustrates response from the same 230 mPOANts::GCaMP6 cells across two separate imaging days. Cells are sorted by female odor response on the day of estradiol administration (right heat plot) and indexed in the same order for comparison on the day of Veh administration (left heat plot).
i. mPOANts::GCaMP6 cells imaged across 2 days of the estrous cycle. Arrows refer to examples of the same cells.
j. Example Ca2+ traces, F/F0, of GCaMP6s Ca2+ dynamics from mPOANts::GCaMP6 cells across two days of the estrous cycle. Arrows point out examples of the same cells across days.
k. mPOANts::GCaMP6 cells had Ca2+ events longer in duration on proestrus, compared to estrus (paired t-test, t154= 2.26, p = 0.0255, n = 155 cells combined across 3 mice).
l. mPOANts::GCaMP6 cells had calcium events higher in peak amplitude on proestrus, compared to estrus (paired t-test, t154= 2.56, p = 0.0113, n = 155 cells combined across 3 mice.
Supplementary Figure 7. Photostimulation of mPOANts in male and female mice.
a. Estrous cycle cytology representing the four days of the mouse estrous cycle. P: proestrus, E: estrus, DI: metestrus, DII: diestrus, scale bar, 62 μm.
b. Individual number of nose pokes into the active port from mPOANts::ChR2 females during proestrous and estrous. Regardless of cycle, differences were observed in the number of pokes as a function of frequency with differences detected between all frequencies except for between 5 and 10 Hz (Two-Way ANOVA, frequency, F3,18 = 199, p < 0.0001, ChR2 n = 4 mice).
c. mPOANts::ChR2 females poked more during 20 and 40 Hz (but not 5 or 10 Hz) of photostimulation on proestrous compared to estrous. (Two-Way ANOVA, interaction, F3,18 = 14.10, p < 0.0001, ChR2 n = 4 mice).
d. mPOANts::ChR2 females displayed a significantly higher mean velocity in the stimulation side of the chamber in all phases of the estrous cycle compared to mPOANts::eYFP controls (Two-Way ANOVA, interaction F3,30 = 5.75, p = 0.0031, eYFP n = 7 mice, ChR2 n = 5 mice).
e. mPOANts::ChR2 males displayed a significantly higher mean velocity on the stimulation side of the chamber, compared to mPOANts::eYFP controls with no effect of day (Two-Way ANOVA, group effect, F1,8 = 31.10, p = 0.0008, eYFP n = 6 mice, Chr2 n = 4 mice). c.
f. Location of optical fiber placements in the mPOA from mPOANts male and female optogenetic cohorts.
Supplementary Figure 8. Photostimulation of mPOANts neurons induces Fos in the mPOA.
a. Confocal image from a mPOANts::ChR2 mouse (top) and mPOANts::eYFP control (bottom). vBNST= ventral bed nucleus of the stria terminalis. D: dorsal, V: ventral, M: medial, L: lateral, AC: anterior commissure, OX: optic chiasm, scale bar: 200 um.
b. Confocal image of mPOANts::ChR2 (green) and optically-evoked Fos immunoreactivity (red), scale bar: 50 um (left column).
c. 20 Hz photostimulation increased the number of cells expressing Fos immunoreactivity in mPOANts::ChR2 mice compared to mPOANts::eYFP controls (unpaired t-test t4 = 15.87, p < 0.0001, n = 3 mice per group).
Supplementary Figure 9. Optogenetic modulation of mPOANts neurons during hormonal and social contexts.
a. Top: Schematic illustrates testing paradigm. Females were tested for real-time place preference after a vehicle control injection once a week preceding and following steroid priming. Steroid-priming consisted of an injection of estradiol and progesterone separated by 48 hours apart, with testing 4 hours after each injection of steroid or vehicle.
Bottom: Stimulation of mPOANts::ChR2 neurons increased the amount of time spent in the photostimulation side of the chamber and steroid priming resulted in an amplified increase in real-time preference for weeks following hormone treatment, compared to those treated with vehicle and mPOANts::eYFP controls (Two-Way ANOVA, interaction F10,75 = 8.91 p < 0.0001, n = 5 – 7 mice per group). E2: estradiol, Veh : vehicle.
b. Photostimulation increased the amount of time mPOANts::ChR2-eYFP males spent in the female zone (Two-Way ANOVA, Interaction F1,8 = 15.20, p = 0.0046, eYFP n= 6, ChR2 n = 5).
c. Photostimulation did not affect the amount of time mPOANts::ChR2-eYFP males spent in the male zone (Two-Way ANOVA, Interaction F1,8 = 5.21, p = 0.0564, eYFP n= 6, ChR2 n = 5).
d. Photostimulation enhanced female preference in mPOANts::ChR2-eYFP males (Two-Way ANOVA, Interaction F1,8 = 15.80, p = 0.0033, eYFP n= 6, ChR2 n = 5).
e. Mating experience in conjunction with steroid priming enhanced male preference. (Two-Way ANOVA, Group F5,35 = 3.68, p = 0.0088, n = 7 mice per group).
f. Photoinhibition did not affect amount of time spent in the female zone. (Two-Way ANOVA, Group F1,12 = 0.045, p = 0.8353, n = 7 mice per group).
g. Photoinhibition did not affect real-time place aversion in mPOANts::NpHR females or mPOANts::eYFP controls across vehicle or steroid-primed conditions (2-Way ANOVA, interaction, F2,16 = 2.52, p = 0.1118, n = 7 mice per group).
h. Schematic illustrates chronic fiber placements in the mPOA from ChR2 and NpHR optogenetic behavioral cohorts and placements in the VTA from ChR2 mice.
Supplementary Figure 10. Optogenetic modulation of mPOANts neurons during a food assay.
a. Schematic illustrates two-chamber assay with a control zone (empty cup) and a food zone (high-fat diet cup). Light stimulation was delivered in alternating 10 min time epochs.
Color heat maps illustrating the spatial location in the food preference assay for a representative previously-primed mPOANts::eYFPcontrol mouse.
Color heat maps illustrate the spatial location in the food preference assay for a representative previously-primed mPOANts::ChR2mouse.
b. No group by time interaction was detected in the amount of time spent in the food zone mice (Two-Way ANOVA, interaction F4,26 = 1.04 p = 0.40, n = 6 mice per group).
c. No group by time interaction was detected in the amount of time spent in the food zone mice (Two-Way ANOVA, interaction F4,26 = 0.21 p =.09322 n = 6 mice per group).
d. Optogenetic stimulation increased the number of food-zone approach bouts in previously-primed mPOANts::ChR2 females compared to vehicle-treated mPOANts::ChR2 and previously-primed eYFP control mice. (Two-Way ANOVA, interaction F4,26 = 6.51 p = 0.0009, n = 5–6 mice per group).
e. Optogenetic stimulation did not affect the number of control cup approach bouts and this did not differ by group. (Two-Way ANOVA, interaction F4,26 = 0.24 p = 0.9122, n = 5–6 mice per group).
f. No group differences of light stimulation were detected in time preference spent in the food zone over the control zone (One-Way ANOVA, interaction F2,13 = 0.44 p = 0.6531, n = 5–6 mice per group).
g. Optogenetic stimulation increased the rate per minute that previously-primed mPOANts::ChR2 females made direct contact with the food compared to vehicle-treated mPOANts::ChR2 and previously-primed eYFP control mice (Two-Way ANOVA, interaction F2,15 = 7.51 p = 0.0055, n = 6 mice per group).
h. Optogenetic stimulation did not affect the amount of time spent eating. (Two-Way ANOVA, interaction F4,26 = 2.14 p = 0.1050, n = 5–6 mice per group).
i. Optogenetic stimulation did not affect food consumption. (One-Way ANOVA, interaction F2,17 = 0.15 p = 0.8640, n = 6 mice per group).
j. Optogenetic inhibition did not affect the amount of time spent in the food zone. (One-Way ANOVA, interaction F2,22 = 0.47 p = 0.9543, n = 6–7 mice per group).
k. Optogenetic inhibition did not affect the amount of time spent in the control zone. (One-Way ANOVA, interaction F2,22 = 0.74 p = 0.4868, n = 6–7 mice per group).
l. Optogenetic inhibition did not affect preference for the food zone (One-Way ANOVA, interaction F1,11 = 3.82, p = 0.0766, n = 6–7 mice per group).
m. Optogenetic inhibition did not affect the number of visits into food zone. (One-Way ANOVA, interaction F2,22 = 0.69 p = 0.5142, n = 6–7 mice per group).
n. Optogenetic inhibition did not affect the number of visits into the control zone. (One-Way ANOVA, interaction F2,22 = 0.405 p = 0.6719, n = 6–7 mice per group). o. Optogenetic inhibition did not affect the amount of high fat diet consumption. (un-paired t-test, t1,10 = 0.70 p = 0.4983, n = 6 mice).
Refers to Figure 1. Basal in vivo Ca2+ dynamics in mPOANts neurons.
Representative video of spontaneous baseline Ca2+ dynamics in mPOANts::GCaMP6s neurons during in vivo 2-photon imaging (2p) an awake head-fixed female in proestrus. Imaging was acquired at 5 Hz but sped up × 4.
Representative video of Ca2+dynamics in mPOANts::GCaMP6s neurons during in vivo 2-photon imaging in an awake head-fixed female in proestrus. Imaging was acquired at 5 Hz but sped up x4. Two concatenated odor trials are shown. Male odor was delivered between ~3 – 5 s and ~13–15 s.
Representative video of a mPOANts::ChR2 female in proestrus during optical self-stimulation test. In this video the female nose pokes through an active port on the left to receive 20 Hz photostimulation with a 5 ms pulse width and for a duration of 3 seconds.
Representative video of a mPOANts::ChR2 female in proestrus during a real-time place preference optogenetic behavioral assay. In this video then female received 20 Hz photostimulation only in the right side of the arena.
Representative video of a mPOANts::ChR2 ovariectomized female that was previously steroid-primed. In this video the female is being photostimulated at 20 Hz during a social preference assay with 2 stimulus mice in the holding chambers; an adult male in the left chamber and an ovariectomized adult female on the right chamber.
Acknowledgments
We thank the Stuber lab for their helpful discussion and support. We thank Spencer Smith for advice on two-photon imaging, the UNC vector core for viral packaging, and the UNC Neuroscience Center Microscopy Core especially V. Ghukasyan for his helpful training and assistance (P30 NS045892). We thank K. Deisseroth for viral constructs (Stanford University). We thank L. Tarantino and S. Schoenrock for their input and assistance with hormone manipulation procedures. We thank K. Schilling-Scrivo, L. Eckman, J. Rodriguez, and G. Tipton for technical assistance and R. Ung for assistance with coding. JAM was supported by the National Institute of Mental Health (T32-MH093315), JMO was supported by the National Institute on Drug Abuse (F32-DA041184), ZAM was supported by ABMRF and NIAAA (K01 AA020911) and JER was supported by NIAAA (F30AA021312). This study was supported by funds from the Foundation of Hope, the Brain and Behavior Research Foundation, the Simons Foundation, the National Institute on Drug Abuse (R01 DA032750 and R01 DA038168) (GDS), the Department of Psychiatry at UNC-CH, and the National Institute on Alcohol Abuse and Alcoholism (AA022449) (EAB).
Footnotes
Author Contributions
JAM and GDS designed the experiments and wrote the manuscript with input from all authors. JMO and JER performed physiology recordings. EAB performed FSCV recordings. MAR wrote codes for in vivo imaging data analysis. OK and ZAM performed in situ hybridization. NWM assisted with tissue processing. JAM performed all surgeries, behavioral assays, 2-photon and confocal imaging experiments. DRR and GDS supervised the project.
The authors declare no competing financial interests.
References
- 1.Anderson DJ, Adolphs R. A framework for studying emotions across species. Cell. 2014;157:187–200. doi: 10.1016/j.cell.2014.03.003. [DOI] [PMC free article] [PubMed] [Google Scholar]
- 2.Yang T, Shah NM. Molecular and neural control of sexually dimorphic social behaviors. Curr Opin Neurobiol. 2016;38:89–95. doi: 10.1016/j.conb.2016.04.015. [DOI] [PMC free article] [PubMed] [Google Scholar]
- 3.Dulac C, O’Connell LA, Wu Z. Neural control of maternal and paternal behaviors. Science. 2014;345:765–770. doi: 10.1126/science.1253291. [DOI] [PMC free article] [PubMed] [Google Scholar]
- 4.McHenry JA, Rubinow DR, Stuber GD. Maternally responsive neurons in the bed nucleus of the stria terminalis and medial preoptic area: Putative circuits for regulating anxiety and reward. Front Neuroendocrinol. 2015;38:65–72. doi: 10.1016/j.yfrne.2015.04.001. [DOI] [PMC free article] [PubMed] [Google Scholar]
- 5.Yoest KE, Cummings JA, Becker JB. Estradiol, dopamine and motivation. Cent Nerv Syst Agents Med Chem. 2014;14:83–89. doi: 10.2174/1871524914666141226103135. [DOI] [PMC free article] [PubMed] [Google Scholar]
- 6.Rilling JK, Young LJ. The biology of mammalian parenting and its effect on offspring social development. Science. 2014;345:771–776. doi: 10.1126/science.1252723. [DOI] [PMC free article] [PubMed] [Google Scholar]
- 7.Petrulis A. Chemosignals and hormones in the neural control of mammalian sexual behavior. Front Neuroendocrinol. 2013;34:255–267. doi: 10.1016/j.yfrne.2013.07.007. [DOI] [PubMed] [Google Scholar]
- 8.O’Connell LA, Hofmann HA. Evolution of a vertebrate social decision-making network. Science. 2012;336:1154–1157. doi: 10.1126/science.1218889. [DOI] [PubMed] [Google Scholar]
- 9.Hull EM, Dominguez JM. Sexual behavior in male rodents. Horm Behav. 2007;52:45–55. doi: 10.1016/j.yhbeh.2007.03.030. [DOI] [PMC free article] [PubMed] [Google Scholar]
- 10.Bromberg-Martin ES, Matsumoto M, Hikosaka O. Dopamine in motivational control: rewarding, aversive, and alerting. Neuron. 2010;68:815–834. doi: 10.1016/j.neuron.2010.11.022. [DOI] [PMC free article] [PubMed] [Google Scholar]
- 11.Berridge KC. The debate over dopamine’s role in reward: the case for incentive salience. Psychopharmacology (Berl) 2007;191:391–431. doi: 10.1007/s00213-006-0578-x. [DOI] [PubMed] [Google Scholar]
- 12.Tobiansky DJ, et al. Estradiol in the Preoptic Area Regulates the Dopaminergic Response to Cocaine in the Nucleus Accumbens. Neuropsychopharmacology. 2015 doi: 10.1038/npp.2015.360. [DOI] [PMC free article] [PubMed] [Google Scholar]
- 13.Tobiansky DJ, et al. The medial preoptic area modulates cocaine-induced activity in female rats. Behav Neurosci. 2013;127:293–302. doi: 10.1037/a0031949. [DOI] [PMC free article] [PubMed] [Google Scholar]
- 14.Wu Z, Autry AE, Bergan JF, Watabe-Uchida M, Dulac CG. Galanin neurons in the medial preoptic area govern parental behaviour. Nature. 2014;509:325–330. doi: 10.1038/nature13307. [DOI] [PMC free article] [PubMed] [Google Scholar]
- 15.Kempadoo KA, et al. Hypothalamic neurotensin projections promote reward by enhancing glutamate transmission in the VTA. J Neurosci. 2013;33:7618–7626. doi: 10.1523/JNEUROSCI.2588-12.2013. [DOI] [PMC free article] [PubMed] [Google Scholar]
- 16.Alexander MJ, et al. Estrogen induces neurotensin/neuromedin N messenger ribonucleic acid in a preoptic nucleus essential for the preovulatory surge of luteinizing hormone in the rat. Endocrinology. 1989;125:2111–2117. doi: 10.1210/endo-125-4-2111. [DOI] [PubMed] [Google Scholar]
- 17.Smith MJ, Wise PM. Neurotensin gene expression increases during proestrus in the rostral medial preoptic nucleus: potential for direct communication with gonadotropin-releasing hormone neurons. Endocrinology. 2001;142:3006–3013. doi: 10.1210/endo.142.7.8256. [DOI] [PubMed] [Google Scholar]
- 18.Watters JJ, Dorsa DM. Transcriptional effects of estrogen on neuronal neurotensin gene expression involve cAMP/protein kinase A-dependent signaling mechanisms. J Neurosci. 1998;18:6672–6680. doi: 10.1523/JNEUROSCI.18-17-06672.1998. [DOI] [PMC free article] [PubMed] [Google Scholar]
- 19.Chen TW, et al. Ultrasensitive fluorescent proteins for imaging neuronal activity. Nature. 2013;499:295–300. doi: 10.1038/nature12354. [DOI] [PMC free article] [PubMed] [Google Scholar]
- 20.Leinninger GM, et al. Leptin action via neurotensin neurons controls orexin, the mesolimbic dopamine system and energy balance. Cell Metab. 2011;14:313–323. doi: 10.1016/j.cmet.2011.06.016. [DOI] [PMC free article] [PubMed] [Google Scholar]
- 21.Asaba A, Hattori T, Mogi K, Kikusui T. Sexual attractiveness of male chemicals and vocalizations in mice. Front Neurosci. 2014;8:231. doi: 10.3389/fnins.2014.00231. [DOI] [PMC free article] [PubMed] [Google Scholar]
- 22.Bueno J, Pfaff DW. Single unit recording in hypothalamus and preoptic area of estrogen-treated and untreated ovariectomized female rats. Brain Res. 1976;101:67–78. doi: 10.1016/0006-8993(76)90988-4. [DOI] [PubMed] [Google Scholar]
- 23.Yagi K. Changes in firing rates of single preoptic and hypothalamic units following an intravenous administration of estrogen in the castrated female rat. Brain Res. 1973;53:343–352. doi: 10.1016/0006-8993(73)90219-9. [DOI] [PubMed] [Google Scholar]
- 24.Root CM, Denny CA, Hen R, Axel R. The participation of cortical amygdala in innate, odour-driven behaviour. Nature. 2014;515:269–273. doi: 10.1038/nature13897. [DOI] [PMC free article] [PubMed] [Google Scholar]
- 25.Hori T, Ide M, Miyake T. Ovarian estrogen secretion during the estrous cycle and under the influence of exogenous gonadotropins in rats. Endocrinol Jpn. 1968;15:215–222. doi: 10.1507/endocrj1954.15.215. [DOI] [PubMed] [Google Scholar]
- 26.Caligioni CS. Assessing reproductive status/stages in mice. Curr Protoc Neurosci. 2009 doi: 10.1002/0471142301.nsa04is48. Appendix 4, Appendix 4I. [DOI] [PMC free article] [PubMed] [Google Scholar]
- 27.Edwards DA. Induction of estrus in female mice: Estrogen-progesterone interactions. Hormones and Behavior. 1970;1:299–304. [Google Scholar]
- 28.Stowers L, Liberles SD. State-dependent responses to sex pheromones in mouse. Curr Opin Neurobiol. 2016;38:74–79. doi: 10.1016/j.conb.2016.04.001. [DOI] [PMC free article] [PubMed] [Google Scholar]
- 29.Caroom D, Bronson FH. Responsiveness of female mice to preputial attractant: effects of sexual experience and ovarian hormones. Physiol Behav. 1971;7:659–662. doi: 10.1016/0031-9384(71)90126-0. [DOI] [PubMed] [Google Scholar]
- 30.Tan KR, et al. GABA neurons of the VTA drive conditioned place aversion. Neuron. 2012;73:1173–1183. doi: 10.1016/j.neuron.2012.02.015. [DOI] [PMC free article] [PubMed] [Google Scholar]
- 31.van Zessen R, Phillips JL, Budygin EA, Stuber GD. Activation of VTA GABA neurons disrupts reward consumption. Neuron. 2012;73:1184–1194. doi: 10.1016/j.neuron.2012.02.016. [DOI] [PMC free article] [PubMed] [Google Scholar]
- 32.Nieh EH, et al. Inhibitory Input from the Lateral Hypothalamus to the Ventral Tegmental Area Disinhibits Dopamine Neurons and Promotes Behavioral Activation. Neuron. 2016 doi: 10.1016/j.neuron.2016.04.035. [DOI] [PMC free article] [PubMed] [Google Scholar]
- 33.Stuber GD, Wise RA. Lateral hypothalamic circuits for feeding and reward. Nat Neurosci. 2016;19:198–205. doi: 10.1038/nn.4220. [DOI] [PMC free article] [PubMed] [Google Scholar]
- 34.Jennings JH, et al. Distinct extended amygdala circuits for divergent motivational states. Nature. 2013;496:224–228. doi: 10.1038/nature12041. [DOI] [PMC free article] [PubMed] [Google Scholar]
- 35.Nieh EH, et al. Decoding Neural Circuits that Control Compulsive Sucrose Seeking. Cell. 2015;160:528–541. doi: 10.1016/j.cell.2015.01.003. [DOI] [PMC free article] [PubMed] [Google Scholar]
- 36.Phelan MM, et al. The structure, stability and pheromone binding of the male mouse protein sex pheromone darcin. PLoS ONE. 2014;9:e108415. doi: 10.1371/journal.pone.0108415. [DOI] [PMC free article] [PubMed] [Google Scholar]
- 37.Dhungel S, Urakawa S, Kondo Y, Sakuma Y. Olfactory preference in the male rat depends on multiple chemosensory inputs converging on the preoptic area. Horm Behav. 2011;59:193–199. doi: 10.1016/j.yhbeh.2010.11.011. [DOI] [PubMed] [Google Scholar]
- 38.Sorwell KG, Wesson DW, Baum MJ. Sexually dimorphic enhancement by estradiol of male urinary odor detection thresholds in mice. Behav Neurosci. 2008;122:788–793. doi: 10.1037/0735-7044.122.4.788. [DOI] [PMC free article] [PubMed] [Google Scholar]
- 39.Dey S, et al. Cyclic Regulation of Sensory Perception by a Female Hormone Alters Behavior. Cell. 2015;161:1334–1344. doi: 10.1016/j.cell.2015.04.052. [DOI] [PMC free article] [PubMed] [Google Scholar]
- 40.Herbison AE, Theodosis DT. Neurotensin-lmmunoreactive Neurons in the Rat Medial Preoptic Area are Oestrogen-Receptive. J Neuroendocrinol. 1991;3:587–589. doi: 10.1111/j.1365-2826.1991.tb00322.x. [DOI] [PubMed] [Google Scholar]
- 41.Rønnekleiv OK, Kelly MJ. Diversity of ovarian steroid signaling in the hypothalamus. Front Neuroendocrinol. 2005;26:65–84. doi: 10.1016/j.yfrne.2005.05.001. [DOI] [PubMed] [Google Scholar]
- 42.Kow LM, Pfaff DW. Rapid estrogen actions on ion channels: A survey in search for mechanisms. Steroids. 2016;111:46–53. doi: 10.1016/j.steroids.2016.02.018. [DOI] [PMC free article] [PubMed] [Google Scholar]
- 43.Pfaff D, Waters E, Khan Q, Zhang X, Numan M. Minireview: estrogen receptor-initiated mechanisms causal to mammalian reproductive behaviors. Endocrinology. 2011;152:1209–1217. doi: 10.1210/en.2010-1007. [DOI] [PMC free article] [PubMed] [Google Scholar]
- 44.Roepke TA, Malyala A, Bosch MA, Kelly MJ, Rønnekleiv OK. Estrogen regulation of genes important for K+ channel signaling in the arcuate nucleus. Endocrinology. 2007;148:4937–4951. doi: 10.1210/en.2007-0605. [DOI] [PubMed] [Google Scholar]
- 45.Micevych P, Sinchak K. Temporal and concentration-dependent effects of oestradiol on neural pathways mediating sexual receptivity. J Neuroendocrinol. 2013;25:1012–1023. doi: 10.1111/jne.12103. [DOI] [PMC free article] [PubMed] [Google Scholar]
- 46.Schmidt PJ, Rubinow DR. Sex hormones and mood in the perimenopause. Ann N Y Acad Sci. 2009;1179:70–85. doi: 10.1111/j.1749-6632.2009.04982.x. [DOI] [PMC free article] [PubMed] [Google Scholar]
- 47.Schiller CE, Johnson SL, Abate AC, Rubinow DR, Schmidt PJ. Reproductive Steroid Regulation of Mood and Behavior. Compr Physiol. 2016;6:1135–1160. doi: 10.1002/cphy.c150014. [DOI] [PMC free article] [PubMed] [Google Scholar]
- 48.Becker JB, Hu M. Sex differences in drug abuse. Frontiers in Neuroendocrinology. 2008;29:36–47. doi: 10.1016/j.yfrne.2007.07.003. [DOI] [PMC free article] [PubMed] [Google Scholar]
- 49.Lüscher C. The Emergence of a Circuit Model for Addiction. Annu Rev Neurosci. 2016 doi: 10.1146/annurev-neuro-070815-013920. [DOI] [PubMed] [Google Scholar]
Online Methods References
- 1.Leinninger GM, et al. Leptin Acts via Leptin Receptor-Expressing Lateral Hypothalamic Neurons to Modulate the Mesolimbic Dopamine System and Suppress Feeding. Cell Metabolism. 2009;10:89–98. doi: 10.1016/j.cmet.2009.06.011. [DOI] [PMC free article] [PubMed] [Google Scholar]
- 2.Sparta DR, et al. Construction of implantable optical fibers for long-term optogenetic manipulation of neural circuits. Nat Protoc. 2012;7:12–23. doi: 10.1038/nprot.2011.413. [DOI] [PMC free article] [PubMed] [Google Scholar]
- 3.Chen TW, et al. Ultrasensitive fluorescent proteins for imaging neuronal activity. Nature. 2013;499:295–300. doi: 10.1038/nature12354. [DOI] [PMC free article] [PubMed] [Google Scholar]
- 4.Resendez SL, et al. Visualization of cortical, subcortical and deep brain neural circuit dynamics during naturalistic mammalian behavior with head-mounted microscopes and chronically implanted lenses. Nat Protoc. 2016;11:566–597. doi: 10.1038/nprot.2016.021. [DOI] [PMC free article] [PubMed] [Google Scholar]
- 5.Edwards DA. Induction of estrus in female mice: Estrogen-progesterone interactions. Hormones and Behavior. 1970;1:299–304. [Google Scholar]
- 6.Powers JB. Hormonal control of sexual receptivity during the estrous cycle of the rat. Physiol Behav. 1970;5:831–835. doi: 10.1016/0031-9384(70)90167-8. [DOI] [PubMed] [Google Scholar]
- 7.Thompson ML, Edwards DA. Experiential and strain determinants of the estrogen-progesterone induction of sexual receptivity in spayed female mice. Hormones and Behavior. 1971;2:299–305. [Google Scholar]
- 8.Byers SL, Wiles MV, Dunn SL, Taft RA. Mouse estrous cycle identification tool and images. PLoS ONE. 2012;7:e35538. doi: 10.1371/journal.pone.0035538. [DOI] [PMC free article] [PubMed] [Google Scholar]
- 9.Caligioni CS. Assessing reproductive status/stages in mice. Curr Protoc Neurosci. 2009 doi: 10.1002/0471142301.nsa04is48. Appendix 4, Appendix 4I. [DOI] [PMC free article] [PubMed] [Google Scholar]
- 10.Jennings JH, et al. Distinct extended amygdala circuits for divergent motivational states. Nature. 2013;496:224–228. doi: 10.1038/nature12041. [DOI] [PMC free article] [PubMed] [Google Scholar]
- 11.Sparta DR, et al. Construction of implantable optical fibers for long-term optogenetic manipulation of neural circuits. Nat Protoc. 2012;7:12–23. doi: 10.1038/nprot.2011.413. [DOI] [PMC free article] [PubMed] [Google Scholar]
- 12.Jennings JH, Rizzi G, Stamatakis AM, Ung RL, Stuber GD. The inhibitory circuit architecture of the lateral hypothalamus orchestrates feeding. Science. 2013;341:1517–1521. doi: 10.1126/science.1241812. [DOI] [PMC free article] [PubMed] [Google Scholar]
- 13.Jennings JH, et al. Visualizing hypothalamic network dynamics for appetitive and consummatory behaviors. Cell. 2015;160:516–527. doi: 10.1016/j.cell.2014.12.026. [DOI] [PMC free article] [PubMed] [Google Scholar]
- 14.Dölen G, Darvishzadeh A, Huang KW, Malenka RC. Social reward requires coordinated activity of nucleus accumbens oxytocin and serotonin. Nature. 2013;501:179–184. doi: 10.1038/nature12518. [DOI] [PMC free article] [PubMed] [Google Scholar]
- 15.Phelan MM, et al. The structure, stability and pheromone binding of the male mouse protein sex pheromone darcin. PLoS ONE. 2014;9:e108415. doi: 10.1371/journal.pone.0108415. [DOI] [PMC free article] [PubMed] [Google Scholar]
- 16.Kaur AW, et al. Murine pheromone proteins constitute a context-dependent combinatorial code governing multiple social behaviors. Cell. 2014;157:676–688. doi: 10.1016/j.cell.2014.02.025. [DOI] [PMC free article] [PubMed] [Google Scholar]
- 17.Dey S, et al. Cyclic Regulation of Sensory Perception by a Female Hormone Alters Behavior. Cell. 2015;161:1334–1344. doi: 10.1016/j.cell.2015.04.052. [DOI] [PMC free article] [PubMed] [Google Scholar]
- 18.Kaifosh P, Zaremba JD, Danielson NB, Losonczy A. SIMA: Python software for analysis of dynamic fluorescence imaging data. Front Neuroinform. 2014;8:80. doi: 10.3389/fninf.2014.00080. [DOI] [PMC free article] [PubMed] [Google Scholar]
- 19.Tsai HC, et al. Phasic firing in dopaminergic neurons is sufficient for behavioral conditioning. Science. 2009;324:1080–1084. doi: 10.1126/science.1168878. [DOI] [PMC free article] [PubMed] [Google Scholar]
- 20.van Zessen R, Phillips JL, Budygin EA, Stuber GD. Activation of VTA GABA neurons disrupts reward consumption. Neuron. 2012;73:1184–1194. doi: 10.1016/j.neuron.2012.02.016. [DOI] [PMC free article] [PubMed] [Google Scholar]
- 21.Otis JM, Dashew KB, Mueller D. Neurobiological dissociation of retrieval and reconsolidation of cocaine-associated memory. J Neurosci. 2013;33:1271–1281a. doi: 10.1523/JNEUROSCI.3463-12.2013. [DOI] [PMC free article] [PubMed] [Google Scholar]
- 22.Pfaff D, Waters E, Khan Q, Zhang X, Numan M. Minireview: estrogen receptor-initiated mechanisms causal to mammalian reproductive behaviors. Endocrinology. 2011;152:1209–1217. doi: 10.1210/en.2010-1007. [DOI] [PMC free article] [PubMed] [Google Scholar]
- 23.Kow LM, Pfaff DW. Rapid estrogen actions on ion channels: A survey in search for mechanisms. Steroids. 2016;111:46–53. doi: 10.1016/j.steroids.2016.02.018. [DOI] [PMC free article] [PubMed] [Google Scholar]
- 24.Woolley CS. Acute effects of estrogen on neuronal physiology. Annu Rev Pharmacol Toxicol. 2007;47:657–680. doi: 10.1146/annurev.pharmtox.47.120505.105219. [DOI] [PubMed] [Google Scholar]
- 25.Oberlander JG, Woolley CS. 17β-Estradiol Acutely Potentiates Glutamatergic Synaptic Transmission in the Hippocampus through Distinct Mechanisms in Males and Females. J Neurosci. 2016;36:2677–2690. doi: 10.1523/JNEUROSCI.4437-15.2016. [DOI] [PMC free article] [PubMed] [Google Scholar]
Associated Data
This section collects any data citations, data availability statements, or supplementary materials included in this article.
Supplementary Materials
Supplementary Figure 1. Validation of VTA placement and nuclear ESR1 protein expression.
a. Schematic illustrates Retrobead tracer injection into the VTA and DIO-eYFP injection into the mPOA. VTA: ventral tegmental area, mPOA: medial preoptic area.
b. Confocal image of Retrobead injections into the VTA from a representative animal. PAG: periaqueductal gray, D: dorsal, V: ventral, M: medial, L: lateral, scale bar: 100 μm.
c. Confocal image of Nts Ai9 reporter expression (blue) and ESR1-ir (pink). ESR1: estrogen receptor 1.
d. Confocal image of Nts labeled and nuclear ESR1-ir in the mPOA scale bar: 40 μm.
Supplementary Figure 2. Expression of Vgat, Vglut2, and Nts in mPOA neurons.
a. Confocal image of Nts (green) and Vgat (blue) mRNA in the mPOA (left). Scale bar: 200 μm. Color dot plot from a representative brain slice illustrates the X-Y coordinates of each Vgat expressing cell that is also positive (green) or negative (blue) for Nts (right hemisphere). Scale bar: 500 μm, Nts: neurotensin, Vgat: vesicular GABA transporter, mPOA: medial preoptic area, vBNST: ventral bed nucleus of the stria terminalis, D: dorsal, V: ventral, M: medial, L: lateral, AC: anterior commissure, OX: optic chiasm.
b. Confocal image of Nts (green) and Vglut2 (pink) mRNA in the mPOA (left). Scale bar, 200 μm. Color dot plot from a representative subject illustrates the X-Y coordinates of each Vglut2 expressing cell that is positive (green) or negative (pink) for Nts. Scale bar, 500 μm, Vglut2: vesicular glutamate transporter, for remaining abbreviations refer above (A).
c. Confocal image Nts (green), Vgat mRNA (blue), and Vglut2 mRNA (pink) mRNA in the mPOA. Scale bar: 20 μm.
d. Cumulative distribution plot showing that the mean intensity of Nts expression within each cell that is positive for Nts is higher in estradiol treated mice compared to vehicle treated controls (Kolmogorov-Smirnov D = 0.53, p < 0.0001, 1,900 cells, n = 3 mice per group).
e. Cumulative distribution plot showing that the mean intensity of Vgat expression within each cell that is positive for Nts is higher in estradiol treated mice compared to vehicle treated controls (Kolmogorov-Smirnov D = 0.35, p < 0.0001, 1,900 cells, n = 3 mice per group).
f. Cumulative distribution plot showing that the mean intensity of Vgat expression within each cell that is negative for Nts is higher in estradiol treated mice compared to vehicle treated controls (Kolmogorov-Smirnov D = 0.11, p < 0.0001, 1,900 cells, n = 3 mice per group).
g. Cumulative distribution plot showing that the mean intensity of Vglut2 expression within each cell that is negative for Nts is higher in estradiol treated mice compared to vehicle treated controls (Kolmogorov-Smirnov D = 0.23, p < 0.0001, n = 3 mice per group).
h. Pie chart illustrates the percentage of Nts neurons co-expressing Vgat and/or Vglut2.
Supplementary Figure 3. Validation of Cre and Nts in mPOA-Nts-IRES mice.
a. Representative confocal image of Nts mRNA (green) in the mPOA. mPOA: medial preoptic area, vBNST: ventral bed nucleus of the stria terminalis, OX: optic chiasm, scale bar: 200 μm.
b. Representative confocal image of Cre mRNA (magenta) in the mPOA.
c. Merged confocal image of Nts mRNA (green) and Cre mRNA (magenta).
d. Representative confocal image of Nts mRNA (green) and Cre mRNA (magenta) in the mPOA. Scale bar: 40 μm.
e. Quantification of Nts mRNA (green) and Cre mRNA (magenta) overlap in the mPOA. Pie chart represents overlap.
Supplementary Figure 4. Validation and implementation of mPOANts in vivo calcium imaging.
a. Schematic represents whole cell patch clamp recordings in a mPOANts::GCaMP6 neuron while simultaneously imaging Ca2+ activity. Representative cell shows that increasing current injection increased the intensity of Ca2+ fluorescence.
b. Example calcium traces, F/F0 during patch clamp recordings in mPOANts::GCaMP6 cells from ovariectomized mice treated with vehicle (vehicle) or estradiol (E2) primed 48 hours and 4 hours prior to collecting slices.
c. Estradiol enhanced the Z-score of normalized peak response from baseline in mPOANts::GCaMP6 cells, compared to controls and increasing current injection increased z-score. (Two-Way ANOVA, interaction F8,104 = 4.47, p < 0.0001, Veh n= 6 cells, E2 n= 9 cells; 2 mice per group).
d. Schematic depicts surgery for expression the Cre-inducible GCaMP6s in mPOANts neurons and implanting a Gradient Refractive Index (GRIN) lens for two-photon optical access in awake head-fixed mice.
e. Image represents a standard deviation z-projection acquired from a motion corrected two-photon baseline recording from mPOANts::GCaMP6. Images were used for hand drawing regions of interests (ROIs) over cells.
f. Illustration is an overlay representing hand drawn regions of interest (ROIs) onto a standard deviation projection (c) for subsequent somatic Ca2+ signal extraction in individual neurons.
Supplementary Figure 5. Behavioral preference for attractive odors.
a. Schematic illustrates test for behavioral odor preference for an odor following a habituation to an empty arena.
b. Female mice had no side preference during habituation periods that occurred prior to odor testing (paired t-test, t1,9 = 1.09 p = 0.3061, n = 10 mice).
c. Nose-point time was highest during odor trials consisting of intact male urine, compared to all other odorants. (One-way Anova, F4,37= 10.60 p < 0.0001, n = 7–10 mice).
d. There was no difference in the amount of nose-point time in the saline control zone during each odor test. (One-way Anova, F4,37 = 1.05 p = 0.3950, n = 7–10 mice).
e. All odors induced a behavioral preference for the odor zone over the saline control zone and the preference index for male urine was highest than that of gonadectomzied male or female urine. (One-way Anova, F4,37 = 5.38, p = 0.0016, n = 7–10 mice).
f. Females had the highest odor zone approach bouts to male urine. (One-way Anova, F4,37 = 3.34, p = 0.0196, n = 7–10 mice).
g. Females did not display differences in saline approach bouts. (One-way Anova, F4,37 = 2.01, p = 0.1131, n = 7–10 mice).
Supplementary Figure 6. Behavioral and neuronal responses across hormonal states
a. Schematic illustrates steroid-priming of estradiol (E2) and subsequently progesterone (P4) 4–6 hours prior to behavioral odor testing and compared with an oil injection (vehicle).
b. Heat maps of total time spent in an odor zone from a representative female before and after estradiol priming.
c. Ovariectomzied females had a higher preference for male odor following estradiol priming that was sustained following progesterone administration, with no differences between steroid treatments (One-way Anova, F2,15 = 35.61, p = 0.0003, n = 6 mice).
d. Ovariectomzied females spent more time in the odor zone following estradiol priming and this was sustained following progesterone administration, with no differences between steroid treatments (One-way Anova, F2,15 = 27.86, p = 0.0008, n = 6 mice).
e. No treatment differences were detected in the amount of time spent investigating the control block. (One-way Anova, F2,15 = 1.76, p = 0.238, n = 6 mice).
f. Ca2+ signal normalized to baseline and averaged across male trials. Heat map illustrates response from the same 230 mPOANts::GCaMP6 cells across three separate imaging days. Cells are sorted by male odor response on the day of E2 administration (middle heat plot) and indexed in the same order for comparison on the day of Veh administration (left heat plot) and after P4 administration (right heat plot).
g. Top: Pie charts illustrate the percentage of cells excited (green) or inhibited (blue) in response to male odor by treatment. Bottom: Averaged Ca2+ traces from mPOANts::GCaMP6 cells significantly excited by male odor after estradiol, compared to their response after vehicle or progesterone. (Wilcoxon t-test, all p values < 0.05, n = 230 cells combined across 4 mice).
h. Ca2+ signal normalized to baseline and averaged across female trials. Heat map illustrates response from the same 230 mPOANts::GCaMP6 cells across two separate imaging days. Cells are sorted by female odor response on the day of estradiol administration (right heat plot) and indexed in the same order for comparison on the day of Veh administration (left heat plot).
i. mPOANts::GCaMP6 cells imaged across 2 days of the estrous cycle. Arrows refer to examples of the same cells.
j. Example Ca2+ traces, F/F0, of GCaMP6s Ca2+ dynamics from mPOANts::GCaMP6 cells across two days of the estrous cycle. Arrows point out examples of the same cells across days.
k. mPOANts::GCaMP6 cells had Ca2+ events longer in duration on proestrus, compared to estrus (paired t-test, t154= 2.26, p = 0.0255, n = 155 cells combined across 3 mice).
l. mPOANts::GCaMP6 cells had calcium events higher in peak amplitude on proestrus, compared to estrus (paired t-test, t154= 2.56, p = 0.0113, n = 155 cells combined across 3 mice.
Supplementary Figure 7. Photostimulation of mPOANts in male and female mice.
a. Estrous cycle cytology representing the four days of the mouse estrous cycle. P: proestrus, E: estrus, DI: metestrus, DII: diestrus, scale bar, 62 μm.
b. Individual number of nose pokes into the active port from mPOANts::ChR2 females during proestrous and estrous. Regardless of cycle, differences were observed in the number of pokes as a function of frequency with differences detected between all frequencies except for between 5 and 10 Hz (Two-Way ANOVA, frequency, F3,18 = 199, p < 0.0001, ChR2 n = 4 mice).
c. mPOANts::ChR2 females poked more during 20 and 40 Hz (but not 5 or 10 Hz) of photostimulation on proestrous compared to estrous. (Two-Way ANOVA, interaction, F3,18 = 14.10, p < 0.0001, ChR2 n = 4 mice).
d. mPOANts::ChR2 females displayed a significantly higher mean velocity in the stimulation side of the chamber in all phases of the estrous cycle compared to mPOANts::eYFP controls (Two-Way ANOVA, interaction F3,30 = 5.75, p = 0.0031, eYFP n = 7 mice, ChR2 n = 5 mice).
e. mPOANts::ChR2 males displayed a significantly higher mean velocity on the stimulation side of the chamber, compared to mPOANts::eYFP controls with no effect of day (Two-Way ANOVA, group effect, F1,8 = 31.10, p = 0.0008, eYFP n = 6 mice, Chr2 n = 4 mice). c.
f. Location of optical fiber placements in the mPOA from mPOANts male and female optogenetic cohorts.
Supplementary Figure 8. Photostimulation of mPOANts neurons induces Fos in the mPOA.
a. Confocal image from a mPOANts::ChR2 mouse (top) and mPOANts::eYFP control (bottom). vBNST= ventral bed nucleus of the stria terminalis. D: dorsal, V: ventral, M: medial, L: lateral, AC: anterior commissure, OX: optic chiasm, scale bar: 200 um.
b. Confocal image of mPOANts::ChR2 (green) and optically-evoked Fos immunoreactivity (red), scale bar: 50 um (left column).
c. 20 Hz photostimulation increased the number of cells expressing Fos immunoreactivity in mPOANts::ChR2 mice compared to mPOANts::eYFP controls (unpaired t-test t4 = 15.87, p < 0.0001, n = 3 mice per group).
Supplementary Figure 9. Optogenetic modulation of mPOANts neurons during hormonal and social contexts.
a. Top: Schematic illustrates testing paradigm. Females were tested for real-time place preference after a vehicle control injection once a week preceding and following steroid priming. Steroid-priming consisted of an injection of estradiol and progesterone separated by 48 hours apart, with testing 4 hours after each injection of steroid or vehicle.
Bottom: Stimulation of mPOANts::ChR2 neurons increased the amount of time spent in the photostimulation side of the chamber and steroid priming resulted in an amplified increase in real-time preference for weeks following hormone treatment, compared to those treated with vehicle and mPOANts::eYFP controls (Two-Way ANOVA, interaction F10,75 = 8.91 p < 0.0001, n = 5 – 7 mice per group). E2: estradiol, Veh : vehicle.
b. Photostimulation increased the amount of time mPOANts::ChR2-eYFP males spent in the female zone (Two-Way ANOVA, Interaction F1,8 = 15.20, p = 0.0046, eYFP n= 6, ChR2 n = 5).
c. Photostimulation did not affect the amount of time mPOANts::ChR2-eYFP males spent in the male zone (Two-Way ANOVA, Interaction F1,8 = 5.21, p = 0.0564, eYFP n= 6, ChR2 n = 5).
d. Photostimulation enhanced female preference in mPOANts::ChR2-eYFP males (Two-Way ANOVA, Interaction F1,8 = 15.80, p = 0.0033, eYFP n= 6, ChR2 n = 5).
e. Mating experience in conjunction with steroid priming enhanced male preference. (Two-Way ANOVA, Group F5,35 = 3.68, p = 0.0088, n = 7 mice per group).
f. Photoinhibition did not affect amount of time spent in the female zone. (Two-Way ANOVA, Group F1,12 = 0.045, p = 0.8353, n = 7 mice per group).
g. Photoinhibition did not affect real-time place aversion in mPOANts::NpHR females or mPOANts::eYFP controls across vehicle or steroid-primed conditions (2-Way ANOVA, interaction, F2,16 = 2.52, p = 0.1118, n = 7 mice per group).
h. Schematic illustrates chronic fiber placements in the mPOA from ChR2 and NpHR optogenetic behavioral cohorts and placements in the VTA from ChR2 mice.
Supplementary Figure 10. Optogenetic modulation of mPOANts neurons during a food assay.
a. Schematic illustrates two-chamber assay with a control zone (empty cup) and a food zone (high-fat diet cup). Light stimulation was delivered in alternating 10 min time epochs.
Color heat maps illustrating the spatial location in the food preference assay for a representative previously-primed mPOANts::eYFPcontrol mouse.
Color heat maps illustrate the spatial location in the food preference assay for a representative previously-primed mPOANts::ChR2mouse.
b. No group by time interaction was detected in the amount of time spent in the food zone mice (Two-Way ANOVA, interaction F4,26 = 1.04 p = 0.40, n = 6 mice per group).
c. No group by time interaction was detected in the amount of time spent in the food zone mice (Two-Way ANOVA, interaction F4,26 = 0.21 p =.09322 n = 6 mice per group).
d. Optogenetic stimulation increased the number of food-zone approach bouts in previously-primed mPOANts::ChR2 females compared to vehicle-treated mPOANts::ChR2 and previously-primed eYFP control mice. (Two-Way ANOVA, interaction F4,26 = 6.51 p = 0.0009, n = 5–6 mice per group).
e. Optogenetic stimulation did not affect the number of control cup approach bouts and this did not differ by group. (Two-Way ANOVA, interaction F4,26 = 0.24 p = 0.9122, n = 5–6 mice per group).
f. No group differences of light stimulation were detected in time preference spent in the food zone over the control zone (One-Way ANOVA, interaction F2,13 = 0.44 p = 0.6531, n = 5–6 mice per group).
g. Optogenetic stimulation increased the rate per minute that previously-primed mPOANts::ChR2 females made direct contact with the food compared to vehicle-treated mPOANts::ChR2 and previously-primed eYFP control mice (Two-Way ANOVA, interaction F2,15 = 7.51 p = 0.0055, n = 6 mice per group).
h. Optogenetic stimulation did not affect the amount of time spent eating. (Two-Way ANOVA, interaction F4,26 = 2.14 p = 0.1050, n = 5–6 mice per group).
i. Optogenetic stimulation did not affect food consumption. (One-Way ANOVA, interaction F2,17 = 0.15 p = 0.8640, n = 6 mice per group).
j. Optogenetic inhibition did not affect the amount of time spent in the food zone. (One-Way ANOVA, interaction F2,22 = 0.47 p = 0.9543, n = 6–7 mice per group).
k. Optogenetic inhibition did not affect the amount of time spent in the control zone. (One-Way ANOVA, interaction F2,22 = 0.74 p = 0.4868, n = 6–7 mice per group).
l. Optogenetic inhibition did not affect preference for the food zone (One-Way ANOVA, interaction F1,11 = 3.82, p = 0.0766, n = 6–7 mice per group).
m. Optogenetic inhibition did not affect the number of visits into food zone. (One-Way ANOVA, interaction F2,22 = 0.69 p = 0.5142, n = 6–7 mice per group).
n. Optogenetic inhibition did not affect the number of visits into the control zone. (One-Way ANOVA, interaction F2,22 = 0.405 p = 0.6719, n = 6–7 mice per group). o. Optogenetic inhibition did not affect the amount of high fat diet consumption. (un-paired t-test, t1,10 = 0.70 p = 0.4983, n = 6 mice).
Refers to Figure 1. Basal in vivo Ca2+ dynamics in mPOANts neurons.
Representative video of spontaneous baseline Ca2+ dynamics in mPOANts::GCaMP6s neurons during in vivo 2-photon imaging (2p) an awake head-fixed female in proestrus. Imaging was acquired at 5 Hz but sped up × 4.
Representative video of Ca2+dynamics in mPOANts::GCaMP6s neurons during in vivo 2-photon imaging in an awake head-fixed female in proestrus. Imaging was acquired at 5 Hz but sped up x4. Two concatenated odor trials are shown. Male odor was delivered between ~3 – 5 s and ~13–15 s.
Representative video of a mPOANts::ChR2 female in proestrus during optical self-stimulation test. In this video the female nose pokes through an active port on the left to receive 20 Hz photostimulation with a 5 ms pulse width and for a duration of 3 seconds.
Representative video of a mPOANts::ChR2 female in proestrus during a real-time place preference optogenetic behavioral assay. In this video then female received 20 Hz photostimulation only in the right side of the arena.
Representative video of a mPOANts::ChR2 ovariectomized female that was previously steroid-primed. In this video the female is being photostimulated at 20 Hz during a social preference assay with 2 stimulus mice in the holding chambers; an adult male in the left chamber and an ovariectomized adult female on the right chamber.
Data Availability Statement
All custom codes have been made publically available at a GitHub repository affiliated with Stuber Lab group and this manuscript title (www.github.com/stuberlab). The data that support the findings of this study are available from the corresponding author upon reasonable request.