

Abstract
The N-terminal half of adenovirus e1a assembles multimeric complexes with host proteins that repress innate immune responses and force host cells into S-phase. In contrast, the functions of e1a’s C-terminal interactions with FOXK, DCAF7 and CtBP are unknown. We found that these interactions modulate RAS signaling, and that a single e1a molecule must bind all three of these host proteins to suppress activation of a subset of IFN-stimulated genes (ISGs). These ISGs were otherwise induced in primary respiratory epithelial cells at 12h p.i. This delayed activation of ISGs required IRF3 and coincided with an ~10-fold increase in IRF3 from protein stabilization. The induced IRF3 bound to chromatin and localized to the promoters of activated ISGs. While IRF3, STAT1/2 and IRF9 all greatly increased in concentration, there were no corresponding mRNA increases, suggesting that e1a regulates the stabilities of these key activators of innate immune responses, as shown directly for IRF3.
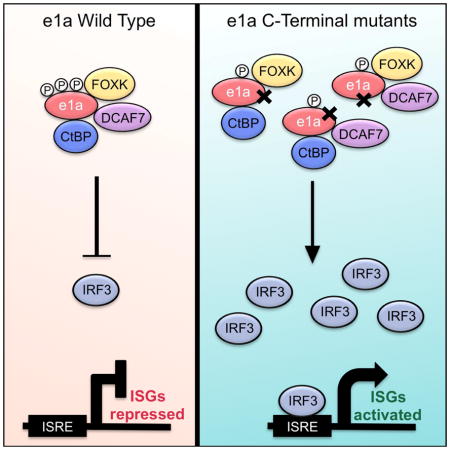
Graphical Abstract
Zemke and Berk report that interactions of neighboring regions in the C-terminal half of a single adenovirus e1a molecule with a host transcription factor, a co-repressor, and a ubiquitin ligase substrate receptor inhibit a noncanonical activation of interferon stimulated genes by adenovirus infection.
Viruses are ancient pathogens that evolved to exploit cellular processes through sophisticated mechanisms that promote viral replication. Human adenovirus type 2 (and the closely related Ad5) is a small DNA tumor virus that infects the exposed, terminally differentiated epithelial cells that line the upper respiratory tract. Normally, these terminally differentiated cells are suboptimal for DNA virus replication since they have low rates of deoxynucleotide synthesis due to their cell cycle arrest in G0. Ad2 overcomes this obstacle through expression of early region genes immediately after infection that establish a cellular environment suitable for efficient viral replication. The first Ad2 gene expressed is E1A, expressed as two major isoforms, large E1A and small E1A (e1a) (Perricaudet et al., 1979; Zhao et al., 2014). While large E1A is necessary for normal activation of other Ad2 genes (Montell et al., 1984; Winberg and Shenk, 1984), e1a is sufficient to drive quiescent cells into S-phase (Kaczmarek et al., 1986; Stabel et al., 1985) while repressing cellular differentiation (Frisch and Mymryk, 2002). As a viral oncogene, e1a transforms primary rodent cells in cooperation with Ad2 E1B55K (Branton et al., 1984; Debbas and White, 1993), Ad2 E1B19K (Debbas and White, 1993), or G12V HRAS (Ruley, 1983). e1a modulates expression of thousands of host genes (Ferrari et al., 2014), yet it does not bind DNA directly. All of e1a’s functions are credited to the binding of host cell proteins, most of which are known to regulate transcription. e1a’s interactions usually map to one or more of four regions highly conserved among primate adenoviruses (CR1-CR4) (Avvakumov et al., 2004; Kimelman, 1986).
e1a’s ability to force quiescent cells into S-phase is mainly attributed to its interaction with the RB proteins (RB1, p107 and p130) (Pelka et al., 2008). RNA-sequencing of mRNAs from cells expressing WT e1a or an e1a mutant defective for binding RB proteins revealed that activation of most e1a induced genes requires the interaction between the purple regions of e1a diagrammed in Fig 1 and the RB proteins (Ferrari et al., 2014). The binding and functional inhibition of the closely related nuclear lysine acetyltransferases p300 and CBP is e1a’s primary mechanism for gene repression by inhibiting acetylation of histone H3 at lysine 18 (H3K18) and 27 (H3K27) (Ferrari et al., 2014; Horwitz et al., 2008). The e1a interaction with p300/CBP promotes dedifferentiation through repression of genes related to cell identity (Ferrari et al., 2014). Interactions with both RB proteins and p300/CBP in e1a’s N-terminal half, are necessary for e1a-mediated transformation (Howe et al., 1990).
Figure 1. Mutations in e1a’s C-terminal Region that Disrupt Interactions with Host Proteins.

(A) e1a protein interaction map with p300/CBP (green), RBs (purple), FOXK (yellow), DCAF7 complexes (red) and CtBP (blue), and e1a conserved regions (CR) 1, 2 and 4. (CR3 is uniquely in Large E1A)
(B) Amino acid substitutions in e1a to disrupt FOXK binding (e1aFOXKb−), DCAF7 binding (e1aDCAF7b−), or CtBP binding (e1aCtBPb−).
(C) Extracts of HeLa cells 24h p.i. with the indicated mutant e1a expression vectors were immunoprecipitated with anti-e1a mAb (M58) and immunoprecipitates were subjected to western blotting with the indicated antibodies. (D) Same as C but with A549 cells.
The C-terminal region of E1A, referring to the sequence encoded by exon 2, is not required for co-transformation of rodent cells by e1a plus G12V HRAS (Howe et al., 1990). In fact, deletions in e1a’s C-terminal region result in increased numbers of transformants in co-transformation assays with activated HRAS (Boyd et al., 1993). Paradoxically, e1a’s C-terminal region is necessary for normal rates of transformation when cooperating with E1B (Subramanian et al., 1991).
Two members of the forkhead box family transcription factors, FOXK1 and FOXK2 (collectively FOXK) interact with a serine/threonine rich region of Ad2 e1a just upstream of CR4 in its C-terminal half (Fig 1A; Komorek et al., 2010). This region is conserved among the human adenoviruses classified in “species C” and is similar to a domain of the human papillomavirus E6 protein from HPV14 and HPV21, also shown to bind FOXK1 and 2 (Komorek et al., 2010). This interaction is mediated through a forkhead-associated (FHA) domain that is unique to FOXK within the forkhead box family and facilitates an interaction with phosphorylated serine/threonine (Durocher and Jackson, 2002; Komorek et al., 2010). Foxk1 knockout mice show a severe growth defect as well as impairment of myogenic cell proliferation (Garry et al., 2000). In synchronized U2OS cells, FOXK1 knockdown causes loss of normal cell cycle oscillations (Grant et al., 2012). Little is known about the functional consequences of the FOXK1/2-e1a interaction, though e1a mutations that disrupt this interaction present a G12V HRAS-cooperative hyper-transformation phenotype (Komorek et al., 2010).
Recently, it was shown that DCAF7 (a.k.a. HAN11 or WDR68) directly interacts with a broad region of E1A’s CR4 (Fig 1A; Glenewinkel et al., 2016). Mutations in E1A that interfere with DCAF7 binding also exhibit hyper-transformation in cooperation with G12V HRAS (Komorek et al., 2010). DCAF7 is a CLR4 E3 ubiquitin ligase substrate receptor (Jin et al., 2006). DCAF7 binds to the dual specificity tyrosine-regulated kinases, DYRK1A and DYRK1B (collectively DYRK1) as well as the homeodomain interacting protein kinase 2, HIPK2 (Miyata and Nishida, 2011; Ritterhoff et al., 2010). Through its direct binding to E1A, DCAF7 is responsible for E1A’s indirect association with DYRK1A/B and HIPK2 (Glenewinkel et al., 2016). Genetic studies in zebrafish and Drosophila indicate that DCAF7 orthologs are necessary for normal organismal development (Morriss et al., 2013; Nissen et al., 2006). The DYRK1 Drosophila ortholog, minibrain (mnb) is necessary for normal postembryonic neurogenesis (Tejedor et al., 1995). DYRK1A is found on the Down syndrome critical region of chromosome 21 in humans, and is believed to contribute to the pathology of the disease (Shapiro, 1999). Also, DYRK1A promotes formation of the DREAM complex, which represses E2F-regulated cell cycle genes during quiescence (Sadasivam and DeCaprio, 2013).
CtBP1 and CtBP2 (collectively CtBP) bind directly to proteins, including transcriptional repressors, with a PXDLS amino acid motif, located in E1A CR4 (Fig 1A; Schaeper et al., 1995). Repressors with PXDLS-like motifs such as Zeb1/2 and Znf217 recruit CtBP dimers to target promoters (Postigo and Dean, 1999; Quinlan et al., 2006). CtBP acts as a corepressor, through its association with chromatin modifying enzymes such as histone deactylases and the KDM1A H3K4 demethylase (Shi et al., 2003). CtBP is reported to repress transcription of tumor suppressor genes like Cdkn1A, Perp, Bax, and Noxa (Grooteclaes et al., 2003). However, how e1a modulates CtBP activity and how the e1a-CtBP interaction inhibits co-transformation with G12V HRAS remains poorly understood. To further explore functions of these interactions with regions of the C-terminal half of e1a, we constructed multi-site e1a mutants that disrupt these interactions and analyzed the effects of these mutations on e1a-regulated host cell gene expression.
RESULTS
e1a mutants defective for C-terminal region-host protein interactions
We constructed Ad vectors expressing mutant e1as defective for interacting with FOXK, DCAF7 or CtBP (FOXKb−, DCAF7b− and CtBPb−, respectively). Multi-site combinations of individual mutations that had been previously shown to reduce these interactions were constructed in order to generate strong phenotypes that simplify genomic level analysis. To eliminate the FOXK interaction with the e1a ser/thr-rich region just N-terminal of CR4 (Fig 1A), two e1a amino acid substitutions T183A and S185A were introduced (Fig 1B), previously reported to individually interfere with e1a’s ability to bind FOXK (Komorek et al., 2010). Immunoprecipitation of e1a followed by western blotting validated that these amino acid substitutions inhibited e1a-association with FOXK1 but not with CtBP, DCAF7 or DYRK1A (Fig 1C,1D). To prevent e1a binding to DCAF7 complexes we constructed a four amino acid substitution, R212E, D225K, L226A and L227A (Fig 1B), mutations previously shown to individually reduce association with DYRK1A (Cohen et al., 2013). This mutant failed to co-IP DCAF7 and one of its associated kinases, DYRK1A (Fig 1D), however e1a’s interactions with FOXK1 and CtBP remained intact (Fig 1C). Lastly, we mutated the previously characterized e1a CtBP binding motif (Zhao et al., 2007), PLDLS, to ALAAA spanning amino acids 233-237 (Fig 1B). These mutations completely eliminate e1a’s ability to co-IP CtBP (Fig 1C). The mutations introduced in FOXKb−, DCAF7b− and CtBPb− did not interfere with e1a’s ability to bind RB1 or p300 (Fig 1D).
WT e1a from whole cell lysate can be resolved into two differentially migrating bands by SDS-PAGE; however, the e1a C-terminal mutants exhibited primarily the faster migrating form (Fig 1C, S1). The slower migrating form is due to phosphorylation at Ser89 (Dumont et al., 1989). Although pSer89 is reduced in the C-terminal mutants, phosphorylation at Ser173, the major site of e1a phosphorylation (Tsukamoto et al., 1986), was similar to WT e1a (Fig S1).
To assay the effects of these mutations following infection, we incorporated these E1A mutants into dl1500 background human Ad5 vectors, previously described (Ferrari et al., 2014), that do not express the large E1A isoform making them defective for activation of other adenoviral promoters and viral replication (Montell et al., 1984).
Consequences of defects in e1a interactions on regulation of cellular mRNAs and virus replication
Contact-inhibited, G1-arrested human primary bronchial/tracheal epithelial cells (HBTEC), derived from the natural host tissue for Ad2 and the closely related Ad5, were infected with FOXKb−, DCAF7b−, CtBPb−, or a WT e1a expressing Ad5 vector (e1aWT). To control for the effects of the infectious process on cellular gene expression, cells were also mock-infected or infected with an Ad5 E1A deletion mutant (ΔE1A), dl312 (Jones and Shenk, 1979). For comparison, we included infections with two Ad5 vectors expressing e1a N-terminal multi-site mutants, a p300/CBP-binding mutant, e1aP300b−, and an RB1/p107/p130-binding mutant, e1aRBb− (Ferrari et al., 2014). e1aP300b− and e1aRBb− were found previously to misregulate hundreds of genes that are activated or repressed by e1aWT in primary human fibroblasts (Ferrari et al., 2014).
RNA-seq was performed with RNA isolated at 24 h p.i. to determine which expressed genes (FPKM>1) were differentially expressed 2-fold or more by the e1a mutant expressing cells compared to cells expressing WT e1a. Relatively small numbers of genes were expressed differently in cells producing e1a C-terminal mutants compared to cells expressing e1aWT (105 – 146 genes overexpressed by the different C-terminal mutants compared to e1aWT, and 68 – 138 genes underexpressed (Fig 2A, Table S1,S2). Since the genes expressed at higher level in the e1a mutant compared to e1aWT expressing cells were also expressed at higher level than in mock-infected cells (Fig 3A), they were activated by infection with the vectors expressing the e1a C-terminal mutants. The same genes were only slightly activated by the ΔE1A mutant (Fig 3A). Similarly, genes expressed at lower level by the C-terminal mutants than in cells expressing WT e1a were expressed at lower level than in mock-infected cells, and were reduced less by the ΔE1A mutant (Fig 3B). Consequently, these genes were more repressed by the e1a C-terminal mutants than by WT e1a. The number of genes differentially expressed by the C-terminal mutants compared to e1aWT was much lower than the number of differentially expressed genes comparing e1aP300b− and e1aRBb− to e1aWT (Fig 2B, Table S1,S2). These data show that the e1a-p300/CBP and e1a-RB family protein interactions regulate many more cellular genes than the e1a C-terminal interactions.
Figure 2. Cellular Gene Expression in HBTEC Expressing WT e1a or e1a Mutants.

(A) Scatter plot of log2 FPKM values for all expressed cellular genes (>1 FPKM) in cells expressing e1a mutants (y-axis), (FOXKb−, orange; DCAF7b−, red; CtBPb−, blue), and WT e1a (x-axis). Colored dots above and below the black lines show the FPKMs of genes expressed at two times higher (above) or two times lower (below) than the level from e1aWT. FPKMs of genes expressed within 2-fold of the mock-infected levels are shown in gray.
(B) Same as (A) but for cells expressing the e1a p300b− mutant (green) or the RBb− mutant (purple).
Figure 3. Genes Differentially Expressed by e1a C-terminal Mutants.

(A) Distributions of FPKMs plotted as boxplots for the genes expressed 2-fold higher by HBTEC expressing FOXKb− (left, 105 genes), DCAF7b− (middle, 146 genes) or CtBPb− (right, 119 genes) compared to e1aWT.
(B) Distributions of FPKM values for genes expressed 2-fold lower by HBTECs expressing FOXKb− (68 genes, left), DCAF7b− (105 genes, middle) or CtBPb− (138 genes, right) compared to e1aWT. (A,B) * p<0.005, ** p<0.001, *** p<0.0001 Kolmogorov-Smirnov test for significant differences from the distribution in e1aWT expressing HBTECs.
(C–D) Venn diagrams showing overlap and gene ontologies, with p values shown in parentheses, for genes expressed 2-fold higher (C) or 2-fold lower (D) by each e1a mutant compared to e1aWT. The ISRE motif enriched in promoters of genes expressed 2-fold higher by all three e1a mutants is shown in (C).
Unexpectedly, there was a large overlap in the genes overexpressed in response to each of the C-terminal mutants (Fig 3A,C). Most of these genes were overexpressed 2-fold or more by two or more C-terminal mutants with 52 genes being overexpressed by all three. Furthermore, when considering the three groups of genes overexpressed in response to the FOXKb−, DCAF7b−, and CtBPb− e1a mutants, changes in their expression relative to that in cells expressing WT e1a were similar for each of the mutants (Fig 3A). These results suggest that each of the e1a C-terminal interactions influence host cell gene expression similarly. Gene ontology analysis of the 52 genes overexpressed ≥2-fold by all three mutants showed overwhelming enrichment for interferon (IFN) response genes (p=7.2 E-47) (Fig 3C). Several of these genes are known to have antiviral functions (Schoggins, 2014). Motif analysis of the promoter regions of the 52 genes overexpressed by all three C-terminal mutants shows that they are highly enriched for the well-characterized IFN-stimulated response element (ISRE) (p-value 1 E-22) (Fig 3C) bound by IFN-signaling activated transcription factors such as IRFs and STATs (Borden et al., 2007).
As with the genes overexpressed by the C-terminal mutants, the genes expressed 2-fold lower in cells expressing a C-terminal mutant compared to e1aWT also showed a surprisingly high degree of overlap (Fig 3B,D). Again, the distributions of expression for the three sets of genes 2-fold lower for each C-terminal mutant, were significantly lower for all three C-terminal mutants compared to e1aWT (Fig 3B). These results further demonstrate that all three of the e1a C-terminal interactions regulate a similar set of cellular genes. The genes that were expressed at lower level when e1a was defective for any one of its C-terminal interactions are enriched for genes related to the HRAS oncogenic signature (Fig 3D).
To test if the loss of e1a’s C-terminal interactions affect virus replication through the activation of this subset of ISGs we infected separate plates of HBTEC with vectors for each of the mutants to induce the C-terminal mutant activated genes. 12h later the cells were superinfected with WT Ad5. 48h later, virus was harvested and WT Ad5 was assayed by plaque formation on HeLa cells. (The recombinant Ad5 vectors cannot form plaques on HeLa cells because they do not express the large E1A protein required to activate transcription from the other viral early promoters.) Cells initially infected with the e1a FOXKb− and CtBPb− vectors produced ~12 fold less WT Ad5 than cells pre-infected with an e1aWT expressing vector, while cells initially infected with the DCAF7b− vector produced ~28 fold less (Fig 4A). These data indicate that activation and/or repression of host genes by the e1a C-terminal mutants greatly interfere with Ad5 replication. This interference with viral replication correlates with the level of the ISGs induced by the C-terminal mutants (Fig 3A,4A).
Figure 4. Individual e1as Must Complex with FOXK, DCAF7, and CtBP to Maximize Virus Replication by Preventing ISG Activation.

(A) HBTEC were infected with vectors expressing WT e1a or the indicated C-terminal mutants. 12h later, the same cells were superinfected with WT Ad5 virus at an moi of 5 for 48h before harvesting virus. Virus titers were quantified by plaque assays on a HeLa monolayer.
(B) Relative levels of indicated mRNAs in HBTEC infected with vectors for the indicated e1a C-terminal mutants, as assayed by qRT-PCR. F−/D−/C− refers to cells coinfected with all three of the e1a C-terminal mutants. (A,B) Data are represented as averages of three separate experiments + S.D. * p<0.05, ** p<0.01, *** p<0.001, compared to WT e1a.
The same e1a molecule must make all three C-terminal region interactions to block transcriptional activation of a subset of IFN-stimulated genes
e1a has been postulated to function as a molecular hub (Pelka et al., 2008) due to its intrinsically disordered flexible structure (Ferreon et al., 2009), allowing it to form functional multimeric complexes by simultaneously binding to multiple proteins that would otherwise not interact. While the RNA-seq results indicate that e1a must make all three C-terminal interactions with host cell proteins to reduce expression of certain ISGs, they do not address the question of whether one e1a molecule must make two or three of the three possible interactions to prevent activation of these ISGs. To address this question we performed a coinfection with vectors for all three C-terminal mutants to determine if there would be complementation of the defect in suppressing overexpression of these ISGs. Expression of IFIT2, ISG15 and OASL were similar in the coinfected cells as in cells expressing the individual mutants (Fig 4B). The e1a mutants expressed in the coinfected cells can make each of the three possible bimolecular interactions between e1a and FOXK, e1a and the DCAF7 complex, and e1a and CtBP (Fig 1C,D). Yet these ISGs continued to be overexpressed, phenocopying cells expressing the single mutants. These results suggest that e1a prevents activation of these ISGs, dependent on the same e1a molecule interacting with all three C-terminal binding proteins, either simultaneously or in series. Coinfection of cells with vectors that produced equal amounts of WT e1a and the DCAF7b− mutant showed that DCAF7b− is partially dominant to e1aWT (Fig S2A).
To further explore the complexes e1a forms with cellular proteins, nuclear extracts from mock or e1aWT vector-infected HeLa cells were subjected to gel filtration on a Superose 6 column capable of resolving globular protein complexes of 0.1 to 2 MDa. In the presence of e1a, p300, RB1 and FOXK1 were shifted to earlier eluting fractions indicating incorporation into higher molecular weight complexes (Fig S2B). The most dramatic shift was with RB1; a large fraction of RB1 co-eluted with p300 in the presence of e1a, consistent with our previous observations (Ferrari et al., 2014) and an earlier report of an e1a-p300-RB1 trimeric complex (Wang et al., 1995). Eluted fractions containing FOXK1 and CtBP1 were distinct from fractions containing p300-e1a-RB1 complexes (Fig S2B, compare red and purple boxes). DCAF7 and DYRK1A eluted heterogeneously from high molecular weight fractions ~1 MDa, consistent with a recent report (Vona et al., 2015), through lower molecular weight fractions down to ~150 kD. These data indicate that most of the e1a-p300-RB1 complexes in the nucleus are distinct from e1a complexes containing FOXK1 and CtBP1.
Increased transcription of overexpressed ISGs
An increase in mRNA expression can be due to a higher level of transcription or increased stability of the transcript. To test if the increased expression of IFIT2 and ISG15 in cells expressing the C-terminal e1a mutants was due to increased transcription, we designed primers for qRT-PCR that only amplify intron-containing pre-mRNA. The higher levels of IFIT2 and ISG15 pre-mRNA induced by expression of the C-terminal e1a mutants (Fig 5A) indicates that these genes were activated at the level of transcription. Transcriptional activation was further confirmed by the observation of activating chromatin signatures. ChIP-seq for RNA polymerase II (pol2) revealed that ISG15 had an increase in pol2 association near the transcription start site (TSS) as well as through the gene body after infection with the C-terminal mutant vectors but not with the e1aWT vector (Fig 5B). Another ISG, MX1 also had peaks of pol2 near the alternative TSSs that increased after infection with the C-terminal mutant vectors compared to the e1aWT vector, correlating with the increased level of mRNA (Fig 5B). A similar profile was seen for OASL (Fig S3A) and other activated ISGs (not shown). ChIP-seq was also performed on two histone modifications that correlate with levels of active transcription, acetylated (ac) H3K18 and H3K27. Both ISG15 and MX1 exhibited increases in H3K18ac near their TSSs after expression of the e1a C-terminal mutants but not e1aWT, while H3K27ac increased only slightly or not at all (Fig 5B). OASL gained acetylation on both H3K18 and H3K27 near its TSS in response to the C-terminal mutants (Fig S3A). The average profile of pol2 and H3K18ac near the TSS for the 52 genes overexpressed by all three C-terminal mutants showed that on average pol2 and H3K18ac were higher in cells expressing the mutants compared to e1aWT (Fig S3B). The higher levels of pre-mRNA, pol2 and H3 acetylation demonstrate a transcriptional activation of these ISGs induced by the e1a C-terminal mutants.
Figure 5. Transcriptional Activation of ISGs by e1a C-terminal Mutants.

(A) Relative levels of IFIT2 and ISG15 pre-mRNAs following infection with the indicated vectors or coinfection with the vectors for each of the three e1a C-terminal mutants (F−/D−/C−). Data are represented as averages of three separate experiments + S.D. * p<0.05 compared to WT e1a.
(B) Genome browser plots of RNA- or ChIP-seq normalized sequence tags.
e1a C-terminal mutants cause increases in IRFs and STATs, but only IRF3 is necessary for ISG activation
STAT1 and STAT2 are phosphorylated following Type I IFN receptor activation resulting in formation of transcription factor ISGF3 composed of p-STAT1, p-STAT2 and IRF9 (Borden et al., 2007; Darnell et al., 1994). We noted that many of the 52 genes overexpressed by all three C-terminal e1a mutants are also in a list of genes activated by the transcription factor unphosphorylated ISGF3 (U-ISGF3), a complex of unphosphorylated STAT1 (U-STAT1) and STAT2 (U-STAT2) with IRF9 that reach high concentrations and drive a secondary prolonged response to IFNβ-stimulation lasting for days (Cheon and Stark, 2009; Cheon et al., 2013). 21 out of the 29 U-ISGF3 activated genes (72%) reported in Cheon et al. (2013) were overexpressed 2-fold or more by all three e1a C-terminal mutants (Fig S4A) and 26 (90%) were overexpressed by at least one e1a C-terminal mutant. Given this striking overlap, we examined levels of total and phosphorylated STAT1, STAT2, and IRF9 protein following infection to determine if we could attribute ISG activation by the C-terminal e1a mutants to increased U-ISGF3.
Indeed, by 24h p.i. the C-terminal e1a mutants caused a substantial increase in the concentrations of STAT1, STAT2 and IRF9 compared to mock-infected cells (Fig 6A). Infection with the ΔE1A vector also increased STAT1/2, although to a lesser extent than vectors for the C-terminal mutants, but IRF9 was increased to a comparable level. While U-ISGF3 subunits have been reported to increase in concentration following activation of the type I IFN receptors and JAK/STAT signaling pathway, we did not detect any phosphorylated STAT1 following infection from 2–24h with any of the Ad5 vectors (Fig S4B). Importantly, the type I IFN encoding mRNAs were not significantly increased as measured by RNA-seq. These observations indicate that ISG activation is not due to an autocrine response to IFN production by the infected cells, but rather, may result from the large increase in the U-ISGF3 subunits, independent of JAK/STAT pathway activation.
Figure 6. e1a C-terminal Mutants Increase STAT1/2, IRF9 and IRF3 but Only IRF3 is Necessary for ISG Activation.

(A) Western blots of HBTEC extract from 24h p.i., with the indicated expression vectors.
(B) Western blots with extract from 2fTGH and U2A cells transfected with indicated siRNAs for 72h and immunoblotted for KD efficiency of IRF3 and IRF9.
(C) qRT-PCR assaying OASL and IFIT2 mRNA from U2A cells transfected with a negative control siRNA with no known targets (si CTRL), siRNA targeting IRF3 (si IRF3) or no siRNA (−). Data are represented as averages of three separate experiments + S.D.
(D) Same as with (C) but in 2fTGH and including siRNA targeting IRF9. Data are represented as averages of three separate experiments + S.D.
(E) Western blots of HBTEC extract from 6, 12 or 24 h p.i., with the indicated expression vectors.
To determine if the U-ISGF3 complex was responsible for ISG activation by the e1a C-terminal mutants, we infected U2A cells, which do not express IRF9 (McKendry et al., 1991), the principal DNA binding subunit (Fink and Grandvaux, 2013). Inconsistent with a requirement for U-ISGF3, the FOXKb− e1a mutant activated OASL and IFIT2 to a similar level as in the parental cells, 2fTGH (Fig 6C,D), which express IRF9 (Fig 6B). Similar results were observed in STAT1 mutant U3A and STAT2 mutant U6A cells (Stark, 2007) (Fig S5). Therefore U-ISGF3 is not necessary for activation of these ISGs by the e1a C-terminal mutants.
Since, the promoters of the activated ISGs contain ISREs bound by all the IRFs, we analyzed changes in expression of other IRFs in addition to IRF9. IRF3 is the principal effector activating the IFN response pathway following cellular detection of viral DNA during infection (Ikushima et al., 2013). When we analyzed IRF3 protein following infection of HBTEC by the C-terminal mutants, we observed an increase over mock-infected cells by 12h p.i. that became still greater by 24h p.i. (Fig 6E). The structurally related IRF7, however, did not change. IRF3 is regulated by cytoplasmic restriction until phosphorylated to allow nuclear entry (Lin et al., 1998). Consequently we analyzed the phosphorylation status of IRF3 at activating site Ser396. Cells expressing the e1a C-terminal mutants but not WT e1a had high IRF3 Ser396 phosphorylation at 24h p.i., comparable to the level induced by poly(I:C), a TLR3 ligand, after 3h (Fig S6A). Although we observed increased total IRF3 by 12h p.i. (Fig 6E), phosphorylation was not induced until 24h p.i. (Fig S6A); therefore the increase in IRF3 preceded its phosphorylation at Ser396.
Unlike IRF9, IRF3 siRNA knockdowns in U2A cells did prevent e1a-FOXKb− from activating OASL and IFIT2 (Fig 6B,C). IRF3 siRNA KD In the parental 2fTGH cells also prevented activation of these genes, while siRNA KD of IRF9 had no significant effect (Fig 6B,D). Taken together, these results indicate that IRF3, but not U-ISGF3, is necessary for e1a C-terminal mutant activation of these ISGs.
IRFs and STATs increase post-transcriptionally leading to IRF3 accumulation on chromatin independent of phosphorylation to activate a subset of ISGs
Following the observation that IRF3, and not IRF9, was required for ISG activation by the e1a C-terminal mutants, we analyzed chromatin associated levels of these proteins as well as STAT1/2. We observed a dramatic increase in IRF3 association with chromatin at 12h p.i. that persisted to 36h p.i., specifically in response to the C-terminal mutants (Fig 7A). Furthermore, IRF3 ChIP-seq in C-terminal mutant, but not mock-infected or e1aWT expressing HBTEC revealed IRF3 binding to the promoters of activated ISGs such as ISG15 and MX1 (Fig 7B). Inconsistent with phosphorylation being required for IRF3’s nuclear entry, we did not observe IRF3 phosphorylation at 12h p.i. when IRF3 had increased on chromatin. However, an increase in pIRF3 was observed at later time points. STAT1 also accumulated on chromatin in e1a C-terminal mutant expressing cells, but with slower kinetics than IRF3 (Fig 7A). STAT2 and IRF9 showed only modest increases in association with chromatin. The observed increase of IRF3 on chromatin 12h p.i. is consistent with the kinetics of ISG activation induced in cells expressing e1a C-terminal mutants. In these cells OASL, ISG15 and IFIT2 were activated by 12h p.i. and ISG15 and IFIT2 mRNAs continued to increase until or past 24h (Fig 7C, left).
Figure 7. e1a C-terminal Mutants induce stabilization and IRF3 binding to Chromatin Prior to Phosphorylation.

(A) Western blot of chromatin associated proteins from HBTEC 6, 12, 24 or 36h p.i. with the indicated vectors.
(B) Genome browser plots of IRF3 ChIP-seq normalized sequence tags.
(C) qRT-PCR of OASL, ISG15, IFIT2, IRF3, STAT1, STAT2 and IRF9 mRNA from HBTEC during a time course of infection with the indicated vectors. Data are plotted as relative to mock-infected.
(D) S35-Met –Cys pulse-chase followed by IRF3 IP SDS-PAGE and autoradiography from HBTEC infected with either e1aWT or DCAF7b−. Left is autoradiogram displaying IRF3 band and right is graph of log2 of the relative intensities of the bands measured by densitometry from the autoradiogram. The least squares line through the points indicates a t1/2 ≈ 0.33 h.
The increased levels of IRFs and STATs could be due to an increase in their respective mRNAs, accelerated translation or stabilization of the proteins. To determine which mechanism occurs under these conditions, IRF3, STAT1/2 and IRF9 mRNA were assayed by qRT-PCR from 0–36h p.i. (Fig 7C, right). The levels of these mRNAs increased 2-fold or less, whereas their encoded proteins increased much more by 24h p.i. (Fig 6A,E). Therefore, the increase in these proteins is not a result of their mRNAs increasing, whether from transcription or message stabilization. To determine if IRF3 is stabilized we performed S35 protein labeling pulse-chase experiments followed by IRF3 immunopreciptitaion and autoradiography. In e1aWT expressing HBTEC IRF3 had a short half-life, ~20 min. In contrast, in cells expressing e1aFOXKb− there was no observed IRF3 decay (Fig 7D). Taken together, our data suggest that the e1a C-terminal mutants activate transcription of a subset of ISGs through an increase in IRF3 by protein stabilization, leading to selective ISG promoter binding and transcription activation. Furthermore, the phosphorylation of IRF3 induced by poly(I:C) activation of TLR3 signaling, did not lead to an increase in total IRF3 in HBTEC (Fig S6B). Therefore a mechanism that increases IRF3 protein level independently of phosphorylation at the activating site operates in the e1a C-terminal mutant expressing cells. We note that the well-characterized IRF3 target IFNB1 (Ikushima et al., 2013), was not activated throughout a timecourse of infection (Fig S4C), and IRF3 was not found to bind the IFNB1 promoter following infection with the e1a C-terminal mutant expressing Ad vectors (Fig S6C), while IRF3 is recruited to IFNB1 following infection with other viruses as seen in Sendai virus infected human B lymphocytes (Freaney et al., 2013). Taken together this suggests a noncanonical mechanism of activation by IRF3 with restricted gene targets.
Discussion
This study has identified a previously unrecognized anti-viral defense involving activation of a subset of interferon stimulated genes (ISGs) beginning 12h post adenovirus infection. This is a much later time course than activation of ISGs by recognition of viral nucleic acids in endosomes during infection by the pathogen pattern receptors TLR7 and 9 (Ikushima et al., 2013). This late activation of ISGs was revealed by infection of primary human bronchial/tracheal epithelial cells (HBTEC) with adenovirus mutants expressing only the small e1a protein mutated at binding sites for host proteins and protein complexes in the C-terminal half of the 243 amino acid e1a protein. Infection with these mutants resulted in activation of a small subset (~50) of the hundreds of ISGs activated by the binding of an α- or β-IFN to the type I IFN receptor on the cell surface (Stark, 2007). This late activation of this subset of ISGs requires IRF3, which accumulates to high levels by 12h p.i. in cells expressing e1a C-terminal mutants, but not in cells expressing WT e1a. Unexpectedly, the C-terminal mutants induce phosphorylation of IRF3 at its activating site Ser396 after accumulation of unphosphorylated IRF3 on chromatin. This is in contrast to the canonical view that nuclear import of IRF3 is regulated by phosphorylation (Lin et al., 1998). Complementation analysis in HBTEC coinfected with the mutants indicate that a single e1a molecule must interact via conserved regions in its C-terminal half with transcription factors FOXK1 or 2, the DCAF7 specificity factor of CLR4 ubiquitin-ligase complexes, and co-repressors CtBP1 or 2 in order to block activation of these ISGs. It is worth noting that only human adenovirus species C e1as contain the FOXK binding region (Cohen et al., 2013). Therefore this function of the e1a C-terminus may be limited to Ads in species C.
Similarly to the genes activated by mutations in e1a’s C-terminal region, the genes repressed by these mutations had a high degree of overlap between the three different e1a C-terminal mutants (Fig 3C,D). Surprisingly, these genes are enriched for the HRAS oncogenic signature. Repression of the Ras pathway by these mutants was unexpected considering oncogenic Ras cooperative co-transformation assays with e1a C-terminal mutants result in a larger number of transformed colonies compared to WT e1a (Boyd et al., 1993). Perhaps the C-terminal mutations increase the number of transformed foci in e1a-G12V HRAS co-transformation assays (Boyd et al. 1993; Cohen et al. 2013) because they lower gene activation by oncogenic RAS to a level that is more compatible with cell survival and replication. In this regard, it is well-established that high level RAS signaling induces senescence (Serrano et al., 1997).
Cells coinfected with all three e1a C-terminal mutant expressing Ad vectors caused increased expression of IFIT2, ISG15 and OASL similarly to infections with any of the individual mutants (Fig 4B,5A). This observation suggests that all three e1a C-terminal binding events must occur on the same e1a molecule to prevent induction of these ISGs. Some evidence supporting a multimeric e1a C-terminal region complex comes from a proteomic analysis of DYRK1A and DYRK1B complexes in the E1A expressing HEK293 cells (Varjosalo et al., 2013). The authors detected FOXK1 and CtBP2 as well as other major E1A binding proteins such as p300, RBs and p400 in complexes with DYRK1A and DYRK1B. In support of a possible multimeric complex with e1a and its C-terminal region binding partners, these proteins partially co-elute in size exclusion gel filtration column fractions from infected HeLa cell nuclear extract (Fig S2B). Additionally, p300-associated e1a complexes were distinct from those containing FOXK1 and CtBP1, while DCAF7 and DYRK1A eluted in all e1a-containing fractions. Also, phosphorylation of e1a Ser89 causing a reduction in mobility in SDS-PAGE, varied between size-fractionated complexes (Fig S2B). These results indicate that there are multiple different e1a-containing complexes in the cell, probably with distinct functions.
e1a co-eluting with FOXK1 was hyperphosphorylated (Fig S2B, upper band), consistent with the notion that FOXKs bind e1a through their FHA domains that bind phosphoserine/threonine (Li et al., 2000). DYRK1A was recently reported to phosphorylate E1A in vivo (Glenewinkel et al., 2016). Consequently, the decrease in the slower migrating form of e1aDCAF7b− may be explained if one or more of the protein kinases associated with the DCAF7 complex, DYRK1A, DYRK1B, or HIPK2, is responsible for phosphorylating e1a Ser89.
Since our list of 52 e1a C-terminal mutant induced genes had a high degree of overlap with genes activated by the U-ISGF3 complex generated very late in response to β-interferon (Cheon and Stark, 2009; Cheon et al., 2013) (Fig S4A), we asked if U-ISGF3 components, U-STAT1, U-STAT2 and IRF9, increase following expression of e1a C-terminal mutants. Indeed, we found much higher levels of these proteins in cells expressing the e1a C-terminal mutants (Fig 6A). However, the e1a C-terminal mutants continued to induce these ISGs in IRF9 mutant cells. We found that another IRF, IRF3, was necessary, as a siRNA KD of IRF3 prevented activation of these ISGs (Fig 6C,D). IRF3, STAT1/2 and IRF9 proteins increased greatly, yet the mRNAs encoding them did not increase more than 2-fold (Fig 7B). IRF3 was found to increase as a result of protein stabilization in cells expressing e1aDCAF7b-. Similarly, the e1a C-terminal binding mutants may influence the stability of IRF9 and STAT1/2 proteins.
Relevant to our observation that the e1a C-terminal mutant induces stabilization of IRF3, IRF3 stability is regulated by polyubiquitinylation by the E3 ubiquitin ligase RAUL (a.k.a. UBE3C). RAUL activity is increased by the Kaposi’s sarcoma virus protein RTA to suppress an innate immune response (Yu and Hayward, 2010). Adenovirus e1a may also be regulating an IRF3 ubiquitin ligase by a mechanism dependent on all three C-terminal interactions to prevent IRF3 protein from accumulating in response to adenovirus infection.
It is not immediately obvious how e1a interactions with FOXK, DCAF7 and CtBP prevent the stabilization of transcription factors that activate a restricted set of ISGs. However, a recent RNAi screen in Drosophila revealed that D.m. FOXK1 is required for activation of antiviral genes following infection with RNA viruses in both Drosophila and mammalian cells (Panda et al., 2015). Relevantly, depletion of FOXK1 by siRNA knockdown in U2OS cells reduced expression from a virus-inducible ISRE-luciferase reporter. FOXK1 transcriptional activation of ISRE-containing promoters could be a direct link between e1a’s FOXK binding and regulation of a subset of ISGs.
Downregulation of some ISGs by e1a has been attributed to its ability to bind the H2B E3 ubiquitin ligase complex hBre1/RNF20 via an N-terminal region including aa 4-25, inhibiting H2B ubiquitinylation (Fonseca et al., 2012). However, it is unlikely that the mutations made in e1a’s C-terminal region affect its ability to bind hBre1 via amino acids 4-25. Another recent report suggested that e1a’s C-terminal region binding to RuvBL1 contributes to the suppression of ISG activation (Olanubi et al., 2017). However the e1a mutants that were defective in RuvBL1 binding also have disrupted FOXK and DYRK1A binding (Komorek et al., 2010).
It is remarkable that these e1a mutants, defective for binding different host proteins with no known overlapping functions, result in a similar phenotypic cellular response. One unifying feature shared among these e1a mutants is their hypophosphorylation. The phosphorylation(s) absent in the three e1a C-terminal mutants might be required for e1a to form a complex that counteracts the increase in IRF3 and subsequent ISG activation. The mechanism by which these hypophosphorylated e1a C-terminal mutants activate a late IFN response by increasing IRF3 protein warrants further exploration.
STAR Methods
Contact For Reagent and Resource Sharing
Further information and requests for resources and reagents should be directed to and will be fulfilled by the Lead Contact, Arnold Berk (berk@mbi.ucla.edu).
Experimental Model and Subject Details
Cell Culture
Male human Bronchial/Tracheal Epithelial Cells (HBTEC, Lifeline Cell Technology Cat# FC-0035; lot# 02196) were grown at 37°C in BronchiaLife Medium Complete Kit (Lifeline Cell Technology catalog number: LL-0023) in a 5% CO2 incubator until they reached confluence. Cells were then incubated 3 days more without addition of fresh media and were either mock infected or infected with the indicated Ad5-based vectors in the conditioned medium. All other cell lines were grown in Dulbecco’s Modified Eagle Medium (DMEM) with 10% fetal bovine serum.
Method Details
Ad Vectors, Infection, Interferon Treatment
Ad5 vectors expressed Ad2 WT or mutant e1a’s from the normal E1A promoter with the dl1500 deletion removing the 13S E1A mRNA 5’ splice site (Montell et al.,1984). The vectors were constructed using the ψ5 vector and in vivo Cre24 mediated recombination (Hardy et al., 1997), and consequently contain an out of frame insertion of a LoxP site at the Bgl II site in the region encoding the carboxy-terminus of E1B-55K. All infections were for 24 h at an moi of 60, unless otherwised indicated. These multiplicities of infection yielded approximately equal amounts of WT and C-terminal mutant e1a proteins and mRNA as judged by western blotting, qRT-PCR of E1A message and mapping of RNA-seq reads to the Ad2 genome. Human interferon-α 1 (IFNα) from Cell Signaling Technology (Cat#8927) was added to the conditioned media of HBTEC cultures at a concentration of 10 ng/mL for indicated times. The ΔE1A mutant was dl312 (Jones and Shenk, 1979).
RNA-seq Procedure and Data Analysis
1X10⁶ Low-passage HBTEC were mock-infected or infected with Ad5 E1A-E1B-substituted, E3-deleted vectors expressing WT Ad2 small E1A proteins from the dl1520 deletion removing the 13S E1A mRNA 50 splice site (Montell et al., 1984), 3 days after reaching confluence. RNA was isolated 24h p.i. using QIAGEN RNeasy Plus Mini Kit. Eluted RNA was treated with Ambion DNA-free™ DNA Removal Kit and then Ambion TRIzol reagent, precipitated with isopropanol, and dissolved in sterile water. RNA concentration was measured with a Qubit fluorometer. One microgram of RNA was fragmented and copied into DNA then PCR amplified with bar-coded primers for separate samples to prepare sequencing libraries using the Illumina TruSeq RNA Sample Preparation procedure. Libraries were sequenced using the Illumina HIseq-2000 to obtain single end 50-base-long reads. Sequences were aligned to the hg19 human genome sequence using TopHat v2. FPKM (fragments per kb per million mapped reads) for each annotated hg19 RefSeq gene ID was determined using Cuffdiff v2 from Cufflinks RNA-Seq analysis tools at http://cufflinks.cbcb.umd.edu. Homer (http://homer.salk.edu/homer PMID: 20513432) gene ontology enrichment analysis was performed on indicated gene lists. Homer motif discovery algorithm was used to look for transcription factor motifs +/− 1 kb from the TSS of genes expressed 2X or more by all three e1a C-terminal mutants compared to e1aWT. RNA-seq results from mock, ΔE1A, e1aWT and e1a C-terminal mutants were validated with three replicate experiments. One representative experiment was used for further analysis and presentation of the data.
ChIP-Seq
Pol2, H3K18ac and H3K27ac ChIP-seq was performed using 1×10⁷ low-passage HBTEC were mock-infected or infected with indicated Ad vector 3 days after reaching confluence. 24h p.i. cells were cross-linked for 1% formaldehyde for 10 minutes at room temperature on rotator. Formaldehyde crosslinking was quenched with 0.14M glycine for 30 minutes at room temperature on rotator. Cells were washed with PBS and scraped from plates in PBS with Roche protease inhibitor cocktail. Cells were pelleted and lysed in 400uL lysis buffer (1% SDS, 50mM Tris-HCl pH8, 20mM EDTA, Roche complete protease inhibitors) and sonicated at 4°C using the Qsonica Q800R2 at 20% amplitude 10s on 30s off until DNA fragments from sheared chromatin were mostly between the sizes of 200–600 base pairs. 100uL of sonicated chromatin was diluted in 10X lysis dilution buffer (16.7 mM Tris-HCl, 1.1% Triton X-100, 1.2mM EDTA, 167mM NaCl) and precleared for 1h 4°C with 30uL of protein A dynabe ads washed 10X lysis dilution buffer on nutator. IPs were performed O/N at 4°C on nutator with precleared chromatin and 2ug of anti-Pol2, -H3K27ac or 5uL of H3K18ac anti-rabbit sera. 50uL of protein A dynabeads were added for 4h on nutator at 4°C. Bead-immunocomplexes were was hed for 5min 2X with each of the following buffers in order: wash buffer A (50mM Hepes pH 7.9, 0.1% SDS, 1% Triton X-100, 0.1% Deoxycholate, 1mM EDTA, 140mM NaCl), wash buffer B (50mM Hepes pH 7.9, 0.1% SDS, 1% Triton X-100, 0.1% Deoxycholate, 1mM EDTA, 500mM NaCl), LiCl buffer (20mM Tris-HCl pH8, 0.5% NP-40, 0.5% Deoxycholate, 1mM EDTA, 250mM LiCl), TE (50mM Tris-HCl pH8, 1mM EDTA). Elution was performed in 150uL of elution buffer (50mM Tris HCl pH8, 1mM EDTA, 1% SDS) then ChIP samples and inputs (10uL of precleared chromatin lysis plus 140uL elution buffer) were reverse crosslinked O/N at 65°C. Samples were RNase A treated for 1h at 37°C and DNA was purified and extracted with phenol/chloroform and ethanol precipitated. DNA pellets were resuspended in 12uL of TE and measured using Qubit fluorometer. IRF3 ChIP-seq was performed similarly with the following modifications: cells were double crosslinked with 4mM DSG in PBS for 30min then 1% formaldehyde for 10 min, crosslinking was quenched in 500mM Tris pH7.9 for 20min and cell pellets were lysed in 1mL lysis buffer 1 (50mM HEPES-KOH, pH 7.5, 140mM NaCl, 1mM EDTA, 10% glycerol, 0.5% NP-40, 0.25% Triton X-100, Roche complete protease inhibitors) for 10min on ice. Lysate was pelleted at 3000 rpm 5min 4°C then resuspended in 1mL lysis buffer 2 (10mM Tris-HCl, pH 8.0, 200mM NaCl, 1mM EDTA, 0.5mM EGTA, Roche complete protease inhibitors) and placed on nutator 10min 4°C and pelleted as before, then resuspended in 125uL of lysis buffer 3 (10mM Tris-HCl, pH 8.0, 100mM NaCl, 1mM EDTA, 0.5mM EGTA, 0.1% Na-Deoxycholate, 0.5% N-lauroylsarcosine, Roche complete protease inhibitors) and sonicated, 5ug of anti-IRF3 (Cat#sc-9082; Lot#31515) was used, magnetic beads were washed and blocked in 0.5% BSA in PBS. Sequencing libraries were constructed from 1 ng of immunoprecipitated and input DNA using the KAPA Hyper Prep Kit from KAPA Biosystems and NEXTflex ChIP-Seq barcodes purchased from Bioo Scientific.
Data Analysis of ChIP-seq
ChIP-seq libraries were sequenced using Hiseq-2000 or 4000 systems for single-end 50 base pair reads. Reads were mapped to the hg19 human genome reference using Bowtie2 software. Only reads that aligned to a unique position in the genome with no more than two sequence mismatches were retained for further analysis. Duplicate reads that mapped to the same exact location in the genome were counted only once to reduce clonal amplification effects. A custom algorithm executed by MATLAB was used for further processing. The genome was tiled into 50 base pair windows and each read was extended by 150 bases and was counted as one read to each window to which it partially or fully matched. The total counts of the input and ChIP samples were normalized to each other. Normalization was done across samples for equal number of uniquely mapped reads. The input sample was used to estimate the expected counts in a window. Wiggle files were generated using a custom algorithm and present the data as normalized tag density as seen in all figures with genome browser shots and average tag density for the indicated TSSs generated by CEAS software.
siRNA and Poly(I:C) Transfections
siRNA KD was performed in U2A or 2fTGH using Invitrogen RNAiMAX reverse transfection protocol. 500,000 cells were plated in 6cm2 plates in antibiotic free 10% FBS DMEM containing siRNA for a final concentration of 10nM that was preincubated in 7.5uL of lipofectamine RNAiMAX reagent in 750uL of Opti-MEM. Ambion siRNAs used were IRF3 s7505, IRF9 s2029 and negative control no.1 AM4611. After 48h of transfections cells were infected for 24h in U2A cells and 12h in 2fTGH with Ad5 vectors or mock-infected. Poly(I:C) purchased from Sigma-Aldrich was transfected into cells at 20ug/mL final concentration using 20uL of lipofectamine 2000 Invitrogen diluted in 1mL of Opti-Mem into 10cm2 plates of confluent HBTECs. RNA was isolated using QIAGEN RNeasy Plus Mini Kit. Cells were lysed for protein in EBC lysis buffer (120mM NaCl, 0.5% NP-40, 50mM Tris-Cl pH 8.0, Roche cOmplete protease inhibitor). Transfections were performed in triplicate. Data are represented as an average of n=3 experimental replicates.
Cellular Biochemical Fractionation
For chromatin associated protein 4×10⁶ HBTEC were infected for indicated times collected and washed in PBS and resuspended in 100uL of Buffer A (10mM HEPES [pH 7.9], 10mM KCl, 1.5mM MgCl2, 0.34 M sucrose, 10% glycerol, 1mM dithiothreitol, and Roche protease inhibitor cocktail) and triton X-100 was added for 0.1% final concentration. Cells were incubated on ice for 8 minutes then nuclei were pelleted by centrifugation 5 min, 1,300 × g, 4°C. Supernatant extract was collected as cytoplasmic extract. The pellet was washed 1X in buffer A and lysed in buffer B (3mM EDTA, 0.2mM EGTA, 1mM dithiothreitol, and Roche protease inhibitor cocktail), and insoluble chromatin was pelleted from soluble (nucleoplasmic supernatant) by centrifugation (5 min, 1,700 × g, 4°C). The chromatin pellet was wash ed once with buffer B and resuspended in 1% SDS Laemmli buffer and denatured for 10 min at 65°C. HeLa cell nuclear extract for Superose 6 gel filtration was isolated as described in (Dignam et al., 1983). 15×107 HeLa cells were mock or e1aWT infected for 24h then pelleted in PBS. Cells were resuspended in 5 volumes to pellet size with Buffer A (10mM HEPES (pH 7.9 at 4C), 1.5mM MgCl2, 10mM KC1 and 0.5mM DTT). Cells were transferred to B-type pestle dounce homogenizer and lysed with 10 strokes then centrifuged for 20 min at 10,000 rpm. Nuclei pellets were resuspended in buffer C (20mM HEPES (pH 7.9), 25% (v/v) glycerol, 0.42M NaCl, 1.5mM MgCl2, 0.2mM EDTA, 0.5mM PMSF and 0.5mM DTT) and stirred gently for 30 min at 4°C. Nuclei were spun at 10,000 rpm for 30min. Supernatant was collected and used for Superose 6 gel filtration.
Co-Immunoprecipitation
Co-IPs were performed using M58 crosslinked to protein G agarose beads. 1mL of clarified M58 hybridoma supernatant was incubated with 50uL of 50% slurry protein G agarose beads on nutator for 4h at 4°C. Beads were washed 3X with 0. 2M sodium borate pH 9 then antibody was crosslinked to protein G beads in 20mM DMP in 0.2M sodium borate pH 9 for 40 min on nutator at room temperature. Beads were then washed once with 0.2M ethanolamine pH 8 then quenched in 1mL ethanolamine pH 8 on nutator for 2h at room temperature. To remove uncoupled IgGs beads were washed 3X with 0.58% acetic acid and 150mM NaCl, then washed 3X with PBS. Cells were lysed in EBC lysis buffer (120 mM NaCl, 0.5% NP-40, 50 mM Tris-Cl pH 8.0, and Roche cOmplete protease inhibitors) l on ice. 2–4 mg of supernatant lysate from infected HeLa or A549 cells was precleared with 30uL agarose G beads for 1h then immunoprecipitated overnight at 4°C with M58 cross-linked to agarose G beads. Immuno-bead complexes were washed 3 times with cold EBC buffer and eluted in Laemmli buffer and incubated 10 min at 65°C.
Western blot
Proteins were extracted from indicated cells by lysis in EBC (120 mM NaCl, 0.5% NP-40, 50 mM Tris-Cl pH 8.0, and Roche cOmplete protease inhibitors). Protein concentration was quantified by Bradford assay and normalized in Laemmli buffer and heated for 10min at 65°C then resolved in a 9% SDS-polyacrylamide gel. Proteins were electrotransferred to a polyvinylidene difluoride (PVDF) membrane then blocked in 5% milk in TBS-Tween 0.1% (blocking buffer) for 30 minutes. Primary antibody was added at manufacturer recommended dilutions for 1h at room temperature or O/N at 4°C. Membranes were washed 3X in TBS-Tween (0.1%) then anti-mouse or anti-rabbit secondary antibodies were added for 1h room temperature in blocking buffer. Membranes were then washed 3X in TBS-Tween (0.1%) prior to addition of ECL reagent for detection of chemiluminescence. Western blots were validated with replicates of two or more with representative western blots presented.
qRT-PCR
Cells were collected at indicated times following transfection or infection and RNA was isolated as described above. 1ug of RNA, as measured by Qubit fluorometer, was used for reverse transcription with SuperScript III First-Strand Synthesis SuperMix using random hexamer primers. qRT-PCR was performed with 5uL of cDNA, diluted 1:10 or 1:10000 for 18s rRNA. Runs were done using an ABI 7500 Real Time Thermocycler and reactions took place in optical-grade, 96-well plates (Applied Biosystems, Carlsbad, CA, USA) 25uL total volume with primers at a concentration of 900nM and 12.5uL of 2X FastStart Universal SYBR Green Master (Rox). Relative mRNA levels were calculated as 2ΔCt and normalized to relative values of 18s rRNA. Data are presented as average of three or more experimental replicates ± standard deviation.
Plaque Assay
6cm2 confluent HBTEC plates were infected for 12h at moi 60 with the indicated e1a-expressing recombinant Ad5 vectors then superinfected with WT Ad5 virus for 48h. Cells were lysed with 3 cycles of freeze/thaw/vortex in 1mL of PBS and the cellular debris was pelleted. The supernatant, containing released Ad particles, was serially diluted to 10−4 – 10−6 and 100uL of the dilutions used to infect 6cm2 80% confluent HeLa monolayer. After 1h absorption of virus 5mL of 0.7% agarose in DMEM with 10% fetal bovine serum was overlayed. 1 day later 3mL of 0.7% agarose and DMEM with 10% fetal bovine serum was overlayed. Cells were stained with neutral red stain on day 6 p.i. and plaques were counted on day 7 to determine Ad5 titers. Data are represent the average plaque forming units from three replicate superinfections ± standard deviation.
S35 Pulse-Chase Protein Labeling and Autoradiography
Confluent 3×10⁶ HBTEC were mock-infected or infected for 22h with the indicated Ad vectors. Cells were washed 2X with room temperature PBS and DMEM Met-Cys-free (Gibco Cat#21013) pulse media with 250uCi/mL EasyTag EXPRESS 35S Protein Labeling Kit was added to cells for 2h and placed in cell culture incubators. After labeling, labeling media was removed and cells were washed 2X with room temperature PBS and Fresh HBTEC media was added for indicated chase times. Upon harvesting cells were washed with cold PBS and collected and lysed in 500uL of EBC lysis buffer (120 mM NaCl, 0.5% NP-40, 50 mM Tris-Cl pH 8.0, and Roche cOmplete protease inhibitors). Cell lysate was used for IRF3 immunoprecipitation as described above in co-immunoprecipitation section with 2uL of anti-IRF3 (D6I4C) from Cell Signaling Technology. Eluted protein was run on 9% SDS polyacrylamide gels. Gels were fixed in 10% acetic acid and 20% methanol in water on rotator for 30 minutes. Gels were washed for 30 minutes in DI water on rotator and incubated in 1M sodium salicylate on rotator for 30 minutes prior to being dried on a gel drying vacuum system. Exposed films were scanned and band intensities were quantified using ImageJ software.
Quantification and Statistical Analysis
Relative mRNA values as determined by qRT-PCR from experiments of three independent biological replicates were used to determine significance between conditions using a one-way ANOVA statistical tests. Statistical differences in the distributions of expression (FPKM values) of a given set of genes between conditions were determined using Kolmogorov-Smirnov tests.
Data and Software Availability
The accession number for the sequencing data reported in this paper is GEO: GSE105040; https://www.ncbi.nlm.nih.gov/geo/query/acc.cgi?acc=GSE105040.
Supplementary Material
Table S2. Genes expressed 2X differently in mock infected cells or in e1a mutant expressing cells compared to cells expressing e1aWT, Related to Figure 2
Table S3. Oligonucleotide sequences and information, Related to STAR Methods
Adenovirus infection induces a late IFN-independent activation of IFN stimulated genes
Adenovirus e1a C-terminus complexes with FOXK, DCAF7 and CtBP to inhibit ISG activation
e1a C-terminal mutants increase the concentration of IRFs and STATs
Increased level of IRF3 through protein stabilization activates a subset of ISGs
Acknowledgments
This work was supported by USPHS grant R01CA025235 to A.J.B. N.R.Z. was supported by T32AI060567 and the Philip Whitcome Fellowship. We thank Carol Eng for excellent technical assistance.
Footnotes
Author Contributions
N.R.Z. and A.J.B. designed the experiments. N.R.Z. conducted the experiments and bioinformatic analyses. N.R.Z. and A.J.B. wrote the paper.
Publisher's Disclaimer: This is a PDF file of an unedited manuscript that has been accepted for publication. As a service to our customers we are providing this early version of the manuscript. The manuscript will undergo copyediting, typesetting, and review of the resulting proof before it is published in its final citable form. Please note that during the production process errors may be discovered which could affect the content, and all legal disclaimers that apply to the journal pertain.
References
- Avvakumov N, Kajon AE, Hoeben RC, Mymryk JS. Comprehensive sequence analysis of the E1A proteins of human and simian adenoviruses. Virology. 2004;329:477–492. doi: 10.1016/j.virol.2004.08.007. [DOI] [PubMed] [Google Scholar]
- Borden EC, Sen GC, Uze G, Silverman RH, Ransohoff RM, Foster GR, Stark GR. Interferons at age 50: past, current and future impact on biomedicine. Nat Rev Drug Discov. 2007;6:975–990. doi: 10.1038/nrd2422. [DOI] [PMC free article] [PubMed] [Google Scholar]
- Boyd JM, Subramanian T, Schaeper U, La Regina M, Bayley S, Chinnadurai G. A region in the C-terminus of adenovirus 2/5 E1a protein is required for association with a cellular phosphoprotein and important for the negative modulation of T24-ras mediated transformation, tumorigenesis and metastasis. EMBO J. 1993;12:469–478. doi: 10.1002/j.1460-2075.1993.tb05679.x. [DOI] [PMC free article] [PubMed] [Google Scholar]
- Branton PE, Bayley ST, Graham FL. Transformation by human adenoviruses. BBA - Rev Cancer. 1984;780:67–94. doi: 10.1016/0304-419x(84)90007-6. [DOI] [PubMed] [Google Scholar]
- Cheon H, Stark GR. Unphosphorylated STAT1 prolongs the expression of interferon-induced immune regulatory genes. Proc Natl Acad Sci U S A. 2009;106:9373–9378. doi: 10.1073/pnas.0903487106. [DOI] [PMC free article] [PubMed] [Google Scholar]
- Cheon H, Holvey-Bates EG, Schoggins JW, Forster S, Hertzog P, Imanaka N, Rice CM, Jackson MW, Junk DJ, Stark GR. IFNβ-dependent increases in STAT1, STAT2, and IRF9 mediate resistance to viruses and DNA damage. EMBO J. 2013;32:2751–2763. doi: 10.1038/emboj.2013.203. [DOI] [PMC free article] [PubMed] [Google Scholar]
- Cohen MJ, Yousef AF, Massimi P, Fonseca GJ, Todorovic B, Pelka P, Turnell AS, Banks L, Mymryk JS. Dissection of the C-terminal region of E1A redefines the roles of CtBP and other cellular targets in oncogenic transformation. J Virol. 2013;87:10348–10355. doi: 10.1128/JVI.00786-13. [DOI] [PMC free article] [PubMed] [Google Scholar]
- Darnell JE, Kerr IM, Stark GR. Jak-STAT pathways and transcriptional activation in response to IFNs and other extracellular signaling proteins. Science. 1994;264:1415–1421. doi: 10.1126/science.8197455. [DOI] [PubMed] [Google Scholar]
- Debbas M, White E. Wild-type p53 mediates apoptosis by E1A, which is inhibited by E1B. Genes Dev. 1993;7:546–554. doi: 10.1101/gad.7.4.546. [DOI] [PubMed] [Google Scholar]
- Dignam JD, Martin PL, Shastry BS, Roeder RG. Eukaryotic gene transcription with purified components. Methods Enzymol. 1983;101:582–598. doi: 10.1016/0076-6879(83)01039-3. [DOI] [PubMed] [Google Scholar]
- Dumont DJ, Tremblay ML, Branton PE. Phosphorylation at serine 89 induces a shift in gel mobility but has little effect on the function of adenovirus type 5 E1A proteins. J Virol. 1989;63:987–991. doi: 10.1128/jvi.63.2.987-991.1989. [DOI] [PMC free article] [PubMed] [Google Scholar]
- Durocher D, Jackson SP. The FHA domain. FEBS Lett. 2002;513:58–66. doi: 10.1016/s0014-5793(01)03294-x. [DOI] [PubMed] [Google Scholar]
- Ferrari R, Gou D, Jawdekar G, Johnson SA, Nava M, Su T, Yousef AF, Zemke NR, Pellegrini M, Kurdistani SK, et al. Adenovirus small E1A employs the lysine acetylases p300/CBP and tumor suppressor Rb to repress select host genes and promote productive virus infection. Cell Host Microbe. 2014;16:663–676. doi: 10.1016/j.chom.2014.10.004. [DOI] [PMC free article] [PubMed] [Google Scholar]
- Ferreon JC, Martinez-Yamout MA, Dyson HJ, Wright PE. Structural basis for subversion of cellular control mechanisms by the adenoviral E1A oncoprotein. Proc Natl Acad Sci U S A. 2009;106:13260–13265. doi: 10.1073/pnas.0906770106. [DOI] [PMC free article] [PubMed] [Google Scholar]
- Fink K, Grandvaux N. STAT2 and IRF9: Beyond ISGF3. Jak-Stat. 2013;2:e27521. doi: 10.4161/jkst.27521. [DOI] [PMC free article] [PubMed] [Google Scholar]
- Fonseca GJ, Thillainadesan G, Yousef AF, Ablack JN, Mossman KL, Torchia J, Mymryk JS. Adenovirus evasion of interferon-mediated innate immunity by direct antagonism of a cellular histone posttranslational modification. Cell Host Microbe. 2012;11:597–606. doi: 10.1016/j.chom.2012.05.005. [DOI] [PubMed] [Google Scholar]
- Freaney J, Kim R, Mandhana R, Horvath C. Extensive cooperation of immune master regulators IRF3 and NF??B in RNA Pol II recruitment and pause release in human innate antiviral transcription. Cell Rep. 2013;4:959–973. doi: 10.1016/j.celrep.2013.07.043. [DOI] [PMC free article] [PubMed] [Google Scholar]
- Frisch SM, Mymryk JS. Adenovirus-5 E1A: paradox and paradigm. Nat Rev Mol Cell Biol. 2002;3:441–452. doi: 10.1038/nrm827. [DOI] [PubMed] [Google Scholar]
- Garry DJ, Meeson A, Elterman J, Zhao Y, Yang P, Bassel-Duby R, Williams RS. Myogenic stem cell function is impaired in mice lacking the forkhead/winged helix protein MNF. Proc Natl Acad Sci U S A. 2000;97:5416–5421. doi: 10.1073/pnas.100501197. [DOI] [PMC free article] [PubMed] [Google Scholar]
- Glenewinkel F, Cohen MJ, King CR, Kaspar S, Bamberg-Lemper S, Mymryk JS, Becker W. The adaptor protein DCAF7 mediates the interaction of the adenovirus E1A oncoprotein with the protein kinases DYRK1A and HIPK2. Sci Rep. 2016;6:28241. doi: 10.1038/srep28241. [DOI] [PMC free article] [PubMed] [Google Scholar]
- Grant GD, Gamsby J, Martyanov V, Brooks L, 3rd, George LK, Mahoney JM, Loros JJ, Dunlap JC, Whitfield ML. Live-cell monitoring of periodic gene expression in synchronous human cells identifies Forkhead genes involved in cell cycle control. Mol Biol Cell. 2012;23:3079–3093. doi: 10.1091/mbc.E11-02-0170. [DOI] [PMC free article] [PubMed] [Google Scholar]
- Grooteclaes M, Deveraux Q, Hildebrand J, Zhang Q, Goodman RH, Frisch SM. C-terminal-binding protein corepresses epithelial and proapoptotic gene expression programs. Proc Natl Acad Sci U S A. 2003;100:4568–4573. doi: 10.1073/pnas.0830998100. [DOI] [PMC free article] [PubMed] [Google Scholar]
- Harlow E, Franza BR, Schley C. Monoclonal antibodies specific for adenovirus early region 1A proteins: extensive heterogeneity in early region 1A products. J Virol. 1985;55:533–546. doi: 10.1128/jvi.55.3.533-546.1985. [DOI] [PMC free article] [PubMed] [Google Scholar]
- Horwitz GA, Zhang K, McBrian MA, Grunstein M, Kurdistani SK, Berk AJ. Adenovirus small e1a alters global patterns of histone modification. Science. 2008;321:1084–1085. doi: 10.1126/science.1155544. [DOI] [PMC free article] [PubMed] [Google Scholar]
- Howe JA, Mymryk JS, Egan C, Branton PE, Bayley ST. Retinoblastoma growth suppressor and a 300-kDa protein appear to regulate cellular DNA synthesis. Proc Natl Acad Sci U S A. 1990;87:5883–5887. doi: 10.1073/pnas.87.15.5883. [DOI] [PMC free article] [PubMed] [Google Scholar]
- Ikushima H, Negishi H, Taniguchi T. The IRF family transcription factors at the interface of innate and adaptive immune responses. Cold Spring Harb Symp Quant Biol. 2013;78:105–116. doi: 10.1101/sqb.2013.78.020321. [DOI] [PubMed] [Google Scholar]
- Jin J, Arias EE, Chen J, Harper JW, Walter JC. A Family of Diverse Cul4-Ddb1-Interacting Proteins Includes Cdt2, which Is Required for S Phase Destruction of the Replication Factor Cdt1. Mol Cell. 2006;23:709–721. doi: 10.1016/j.molcel.2006.08.010. [DOI] [PubMed] [Google Scholar]
- Jones N, Shenk T. Isolation of adenovirus type 5 host range deletion mutants defective for transformation of rat embryo cells. Cell. 1979;17:683–689. doi: 10.1016/0092-8674(79)90275-7. [DOI] [PubMed] [Google Scholar]
- Kaczmarek L, Ferguson B, Rosenberg M, Baserga R. Induction of cellular DNA synthesis by purified adenovirus E1A proteins. Virology. 1986;152:1–10. doi: 10.1016/0042-6822(86)90366-1. [DOI] [PubMed] [Google Scholar]
- Kimelman D. A novel general approach to eucaryotic mutagenesis functionally identifies conserved regions within the adenovirus 13S E1A polypeptide. Mol Cell Biol. 1986;6:1487–1496. doi: 10.1128/mcb.6.5.1487. [DOI] [PMC free article] [PubMed] [Google Scholar]
- Komorek J, Kuppuswamy M, Subramanian T, Vijayalingam S, Lomonosova E, Zhao LJ, Mymryk JS, Schmitt K, Chinnadurai G. Adenovirus type 5 E1A and E6 proteins of low-risk cutaneous beta-human papillomaviruses suppress cell transformation through interaction with FOXK1/K2 transcription factors. J Virol. 2010;84:2719–2731. doi: 10.1128/JVI.02119-09. [DOI] [PMC free article] [PubMed] [Google Scholar]
- Li J, Lee GI, Van Doren SR, Walker JC. The FHA domain mediates phosphoprotein interactions. J Cell Sci. 2000;113(Pt 23):4143–4149. doi: 10.1242/jcs.113.23.4143. [DOI] [PubMed] [Google Scholar]
- Lin R, Heylbroeck C, Pitha PM, Hiscott J. Virus-Dependent Phosphorylation of the IRF-3 Transcription Factor Regulates Nuclear Translocation, Transactivation Potential, and Proteasome-Mediated Degradation. Mol Cell Biol. 1998;18:2986–2996. doi: 10.1128/mcb.18.5.2986. [DOI] [PMC free article] [PubMed] [Google Scholar]
- McKendry R, John J, Flavell D, Müller M, Kerr IM, Stark GR. High-frequency mutagenesis of human cells and characterization of a mutant unresponsive to both alpha and gamma interferons. Proc Natl Acad Sci U S A. 1991;88:11455–11459. doi: 10.1073/pnas.88.24.11455. [DOI] [PMC free article] [PubMed] [Google Scholar]
- Miyata Y, Nishida E. DYRK1A binds to an evolutionarily conserved WD40-repeat protein WDR68 and induces its nuclear translocation. Biochim Biophys Acta - Mol Cell Res. 2011;1813:1728–1739. doi: 10.1016/j.bbamcr.2011.06.023. [DOI] [PubMed] [Google Scholar]
- Montell C, Courtois G, Eng C, Berk A. Complete transformation by adenovirus 2 requires both E1A proteins. Cell. 1984;36:951–961. doi: 10.1016/0092-8674(84)90045-x. [DOI] [PubMed] [Google Scholar]
- Morriss GR, Jaramillo CT, Mikolajczak CM, Duong S, Jaramillo MS, Cripps RM. The Drosophila wings apart gene anchors a novel, evolutionarily conserved pathway of neuromuscular development. Genetics. 2013;195:927–940. doi: 10.1534/genetics.113.154211. [DOI] [PMC free article] [PubMed] [Google Scholar]
- Nissen RM, Amsterdam A, Hopkins N. A zebrafish screen for craniofacial mutants identifies wdr68 as a highly conserved gene required for endothelin-1 expression. BMC Dev Biol. 2006;6:28. doi: 10.1186/1471-213X-6-28. [DOI] [PMC free article] [PubMed] [Google Scholar]
- Olanubi O, Frost JR, Radko S, Pelka P. Suppression of type I interferon signaling by E1A via RuvBL1/Pontin. J Virol. 2017 doi: 10.1128/JVI.02484-16. JVI.02484-16. [DOI] [PMC free article] [PubMed] [Google Scholar]
- Panda D, Gold B, Tartell MA, Rausch K, Casas-Tinto S, Cherry S. The transcription factor FoxK participates with Nup98 to regulate antiviral gene expression. MBio. 2015:6. doi: 10.1128/mBio.02509-14. [DOI] [PMC free article] [PubMed] [Google Scholar]
- Pelka P, Ablack JNG, Fonseca GJ, Yousef AF, Mymryk JS. MINIREVIEW Intrinsic Structural Disorder in Adenovirus E1A: a Viral Molecular Hub Linking Multiple Diverse Processes. J Virol. 2008;82:7252–7263. doi: 10.1128/JVI.00104-08. [DOI] [PMC free article] [PubMed] [Google Scholar]
- Perricaudet M, Akusjärvi G, Virtanen A, Pettersson U. Structure of two spliced mRNAs from the transforming region of human subgroup C adenoviruses. Nature. 1979;281:694–696. [Google Scholar]
- Postigo AA, Dean DC. ZEB represses transcription through interaction with the corepressor CtBP. Proc Natl Acad Sci U S A. 1999;96:6683–6688. doi: 10.1073/pnas.96.12.6683. [DOI] [PMC free article] [PubMed] [Google Scholar]
- Quinlan KGR, Nardini M, Verger A, Francescato P, Yaswen P, Corda D, Bolognesi M, Crossley M. Specific recognition of ZNF217 and other zinc finger proteins at a surface groove of C-terminal binding proteins. Mol Cell Biol. 2006;26:8159–8172. doi: 10.1128/MCB.00680-06. [DOI] [PMC free article] [PubMed] [Google Scholar]
- Ritterhoff S, Farah CM, Grabitzki J, Lochnit G, Skurat AV, Schmitz ML. The WD40-repeat protein Han11 functions as a scaffold protein to control HIPK2 and MEKK1 kinase functions. EMBO J. 2010;29:3750–3761. doi: 10.1038/emboj.2010.251. [DOI] [PMC free article] [PubMed] [Google Scholar]
- Ruley HE. Adenovirus early region 1A enables viral and cellular transforming genes to transform primary cells in culture. Nature. 1983;304:602–606. doi: 10.1038/304602a0. [DOI] [PubMed] [Google Scholar]
- Sadasivam S, DeCaprio JA. The DREAM complex: master coordinator of cell cycle-dependent gene expression. Nat Rev Cancer. 2013;13:585–595. doi: 10.1038/nrc3556. [DOI] [PMC free article] [PubMed] [Google Scholar]
- Schaeper U, Boyd JM, Verma S, Uhlmann E, Subramanian T, Chinnadurai G. Molecular cloning and characterization of a cellular phosphoprotein that interacts with a conserved C-terminal domain of adenovirus E1A involved in negative modulation of oncogenic transformation. Proc Natl Acad Sci U S A. 1995;92:10467–10471. doi: 10.1073/pnas.92.23.10467. [DOI] [PMC free article] [PubMed] [Google Scholar]
- Schoggins JW. Interferon-stimulated genes: Roles in viral pathogenesis. Curr Opin Virol. 2014;6:40–46. doi: 10.1016/j.coviro.2014.03.006. [DOI] [PMC free article] [PubMed] [Google Scholar]
- Serrano M, Lin AW, McCurrach ME, Beach D, Lowe SW. Oncogenic ras provokes premature cell senescence associated with accumulation of p53 and p16(INK4a) Cell. 1997;88:593–602. doi: 10.1016/s0092-8674(00)81902-9. [DOI] [PubMed] [Google Scholar]
- Shi Y, Sawada J, Sui G, Affar EB, Whetstine JR, Lan F, Ogawa H, Luke MPS, Nakatani Y, Shi Y. Coordinated histone modifications mediated by a CtBP co-repressor complex. Nature. 2003;422:735–738. doi: 10.1038/nature01550. [DOI] [PubMed] [Google Scholar]
- Stabel S, Argos P, Philipson L. The release of growth arrest by microinjection of adenovirus E1A DNA. EMBO J. 1985;4:2329–2336. doi: 10.1002/j.1460-2075.1985.tb03934.x. [DOI] [PMC free article] [PubMed] [Google Scholar]
- Stark GR. How cells respond to interferons revisited: From early history to current complexity. Cytokine Growth Factor Rev. 2007;18:419–423. doi: 10.1016/j.cytogfr.2007.06.013. [DOI] [PMC free article] [PubMed] [Google Scholar]
- Subramanian T, Malstrom SE, Chinnadurai G. Requirement of the C-terminal region of adenovirus E1a for cell transformation in cooperation with E1b. Oncogene. 1991;6:1171–1173. [PubMed] [Google Scholar]
- Subramanian T, Zhao L, Chinnadurai G. Interaction of CtBP with adenovirus E1A suppresses immortalization of primary epithelial cells and enhances virus replication during productive infection. Virology. 2013 Jun;443:313–320. doi: 10.1016/j.virol.2013.05.018. [DOI] [PMC free article] [PubMed] [Google Scholar]
- Suka N, Suka Y, Carmen AA, Wu J, Grunstein M. Highly specific antibodies determine histone acetylation site usage in yeast heterochromatin and euchromatin. Mol Cell. 2001;8:473–479. doi: 10.1016/s1097-2765(01)00301-x. [DOI] [PubMed] [Google Scholar]
- Tejedor F, Zhu XR, Kaltenbach E, Ackermann A, Baumann A, Canal I, Heisenberg M, Fischbach KF, Pongs O. minibrain: A new protein kinase family involved in postembryonic neurogenesis in Drosophila. Neuron. 1995;14:287–301. doi: 10.1016/0896-6273(95)90286-4. [DOI] [PubMed] [Google Scholar]
- Tsukamoto aS, Ponticelli a, Berk aJ, Gaynor RB. Genetic mapping of a major site of phosphorylation in adenovirus type 2 E1A proteins. J Virol. 1986;59:14–22. doi: 10.1128/jvi.59.1.14-22.1986. [DOI] [PMC free article] [PubMed] [Google Scholar]
- Varjosalo M, Keskitalo S, VanDrogen A, Nurkkala H, Vichalkovski A, Aebersold R, Gstaiger M. The Protein Interaction Landscape of the Human CMGC Kinase Group. Cell Rep. 2013;3:1306–1320. doi: 10.1016/j.celrep.2013.03.027. [DOI] [PubMed] [Google Scholar]
- Vona CD, Bezdan D, Islam ABMMK, Salichs E, López-Bigas N, Ossowski S, Luna SDL. Chromatin-wide profiling of DYRK1A reveals a role as a gene-specific RNA polymerase II CTD kinase. Mol Cell. 2015;57:506–521. doi: 10.1016/j.molcel.2014.12.026. [DOI] [PubMed] [Google Scholar]
- Wang HG, Moran E, Yaciuk P. E1A promotes association between p300 and pRB in multimeric complexes required for normal biological activity. J Virol. 1995;69:7917–7924. doi: 10.1128/jvi.69.12.7917-7924.1995. [DOI] [PMC free article] [PubMed] [Google Scholar]
- Winberg G, Shenk T. Dissection of overlapping functions within the adenovirus type 5 E1A gene. EMBO J. 1984;3:1907–1912. doi: 10.1002/j.1460-2075.1984.tb02066.x. [DOI] [PMC free article] [PubMed] [Google Scholar]
- Yu Y, Hayward GS. The Ubiquitin E3 Ligase RAUL Negatively Regulates Type I Interferon through Ubiquitination of the Transcription Factors IRF7 and IRF3. Immunity. 2010;33:863–877. doi: 10.1016/j.immuni.2010.11.027. [DOI] [PMC free article] [PubMed] [Google Scholar]
- Zhao H, Chen M, Pettersson U. A new look at adenovirus splicing. Virology. 2014;456–457:329–341. doi: 10.1016/j.virol.2014.04.006. [DOI] [PubMed] [Google Scholar]
- Zhao LJ, Subramanian T, Vijayalingam S, Chinnadurai G. PLDLS-dependent interaction of E1A with CtBP: regulation of CtBP nuclear localization and transcriptional functions. Oncogene. 2007;26:7544–7551. doi: 10.1038/sj.onc.1210569. [DOI] [PMC free article] [PubMed] [Google Scholar]
Associated Data
This section collects any data citations, data availability statements, or supplementary materials included in this article.
Supplementary Materials
Table S2. Genes expressed 2X differently in mock infected cells or in e1a mutant expressing cells compared to cells expressing e1aWT, Related to Figure 2
Table S3. Oligonucleotide sequences and information, Related to STAR Methods