

Abstract
Purpose
Ethnic minority groups usually have a more unfavourable disease risk profile than the host population. In Europe, ethnic inequalities in health have been observed in relatively small studies, with limited possibilities to explore underlying causes. The aim of the Healthy Life in an Urban Setting (HELIUS) study is to investigate the causes of (the unequal burden of) diseases across ethnic groups, focusing on three disease categories: cardiovascular diseases, mental health and infectious diseases.
Participants
The HELIUS study is a prospective cohort study among six large ethnic groups living in Amsterdam, the Netherlands. Between 2011 and 2015, a total 24 789 participants (aged 18–70 years) were included at baseline. Similar-sized samples of individuals of Dutch, African Surinamese, South-Asian Surinamese, Ghanaian, Turkish and Moroccan origin were included. Participants filled in an extensive questionnaire and underwent a physical examination that included the collection of biological samples (biobank).
Findings to date
Data on physical, behavioural, psychosocial and biological risk factors, and also ethnicity-specific characteristics (eg, culture, migration history, ethnic identity, socioeconomic factors and discrimination) were collected, as were measures of health outcomes (cardiovascular, mental health and infections). The first results have confirmed large inequalities in health between ethnic groups, such as diabetes and depressive symptoms, and also early markers of disease such as arterial wave reflection and chronic kidney disease, which can only just partially be explained by inequalities in traditional risk factors, such as obesity and socioeconomic status. In addition, the first results provided important clues for targeting prevention and healthcare.
Future plans
HELIUS will be used for further research on the underlying causes of ethnic differences in health. Follow-up data will be obtained by repeated measurements and by linkages with existing registries (eg, hospital data, pharmacy data and insurance data).
Keywords: ethnicity, health inequalities, cardiovascular disease, mental health, infectious disease, helius study
Strengths and limitations of this study.
The main strength of our cohort is the inclusion of a large number of participants from several ethnic groups living in the same city, in whom an extensive set of questionnaires, biological samples and physical measurements were collected.
Outcomes and risk factors were measured using the same methodology across all ethnic groups, including the majority population, which allows direct comparisons between the groups.
Another major strength is the focus on three disease categories (cardiovascular diseases, mental health and infectious diseases), allowing us to investigate potential cross-links between them.
Response rates were relatively low, possibly resulting in selection bias. Nevertheless, large numbers of each ethnic group were included, and all socioeconomic levels are represented in the samples; moreover, our non-response analyses show that socioeconomic differences between participants and non-participants were very small.
Introduction
Ethnic minority groups usually have a more unfavourable disease risk profile than the host population. For example, the prevalence of viral hepatitis B and C infections,1 as well as the death risks from almost all infections,2 are generally higher among ethnic minority groups. Depressive symptoms are more common in ethnic minority groups across Europe.3 Also, the higher cardiovascular risk among ethnic minorities is well documented, for example, the high prevalence of coronary heart disease among South Asians4 and the higher risk of stroke among people originating from Africa.5
In Europe, ethnic inequalities in health have been observed in relatively small studies, with limited possibilities to explore underlying causes. In addition, most large-scale population-based studies excluded ethnic minorities,6 possibly due to the practical challenges to include these groups and because a homogeneous study population increases the internal validity of the study.7 The ‘Healthy Life in an Urban Setting’ (HELIUS) study was set up to fill this gap in epidemiological health research in Europe, aiming to provide a knowledge base for the improvement of healthcare and the prevention of communicable and non-communicable diseases in ethnic minority groups.7
The HELIUS study is designed as a prospective cohort study, including six ethnic groups (including the Dutch as a reference) living in Amsterdam, the Netherlands. The general objective of the HELIUS study is to study the causes of (the unequal burden of) diseases across these ethnic groups, with emphasis on three disease categories: cardiovascular diseases, mental health and infectious diseases.7 These are all major causes of global disease burden and mortality,8 9 and these disease categories are characterised by large ethnic variation, shared risk factors and complex patterns of causal relations to each other.10 11 The aim of this paper is to describe the cohort (design, participation, baseline study population and measurements) and illustrate some key findings to date. In addition, the strength and limitations of the cohort are described, as well as future plans and the collaboration policy of the study.
Cohort description
Study design
Between January 2011 and December 2015, baseline HELIUS data were collected among Amsterdam residents of Dutch, Surinamese, Ghanaian, Turkish and Moroccan ethnic origin. More information on the migration backgrounds of the Dutch ethnic minority groups included in HELIUS can be found in table 1. Data were collected through a questionnaire (or interview) and a physical examination that included the collection of biological samples. All participants provided written informed consent.
Table 1.
Information on the migration history of the ethnic minority groups included in the HELIUS study
| Ethnic group | Migration history |
| Surinamese | The Surinamese migrated to the Netherlands from Suriname, a former Dutch colony in South America. Surinamese with an African background (referred to as ‘Creole’ in the Dutch context) are mainly the descendants of West Africans, and those with a South-Asian background (referred to as ‘Hindustani’ in the Dutch context) have their roots in North India. Both groups migrated to Suriname in the 19th century. Their migration from Suriname to the Netherlands was mainly due to the unstable political situation in Suriname in 1975 and 1980. Ethnic minority groups with comparable South Asian and African backgrounds can also be found in other European countries, including the UK. |
| Turks and Moroccans | Turks and Moroccans form important migrant groups in the Netherlands and in other West European countries (Belgium, France, Spain, Italy and Germany). Migration from Turkey and Morocco was encouraged in the 1960s and early 1970s to fill labour shortages in unskilled occupations. The initial period of labour migration was followed by a second period (1970–1980) in which many guest workers brought their spouses and children to the Netherlands. Since then, many young Turkish and Moroccan people have chosen partners from their region of origin. |
| Ghanaians | The migration of Ghanaians to the Netherlands occurred in two phases. The first phase (between 1974 and 1983) was due to economic reasons. The second phase (in the early 1990s) was linked to drought, political instability and the expulsion of Ghanaians from Nigeria. Ghanaians are also an important migrant group in the UK and Germany. |
Recruitment
People in the age range of 18–70 years were randomly sampled, stratified by ethnic origin, through the municipality register of Amsterdam. This register contains data on country of birth of citizens and of their parents, thus allowing for sampling based on the widely accepted Dutch standard indicator for ethnic origin. This country of birth indicator of ethnicity has the advantage of being objective and stable over time, and cross-validation studies showed a high correlation between the country of birth indicator and self-identified ethnic group indicator among Turkish, Moroccan and Surinamese people in the Netherlands.12 More specifically, a person was defined as of non-Dutch ethnic origin if he/she fulfilled one of two criteria: (1) he/she was born outside the Netherlands and has at least one parent born outside the Netherlands (first generation) or (2) he/she was born in the Netherlands but both parents were born outside the Netherlands (second generation). For the Dutch sample, we invited people who were born in the Netherlands and whose parents were born in the Netherlands. A limitation of the country of birth indicator for ethnicity is that people who are born in the same country might have a different ethnic background, which in the Dutch context is applicable to the Surinamese population (see table 1). Therefore, after data collection, participants of Surinamese ethnic origin were further classified according to self-reported ethnic origin (obtained by questionnaire) into ‘African’, ‘South-Asian’ or ‘other’.12
Selected individuals of Dutch, Surinamese, Ghanaian, Turkish and Moroccan ethnic origin received a written invitation combined with written information and a response card (in Dutch, and also in English for Ghanaian participants, in Turkish for Turkish participants and Moroccan Arabic for Moroccan participants). After a positive response, subjects received a confirmation letter of an appointment for a physical examination and a digital or paper version of the questionnaire (depending on the preference of the subject) to fill out at home. Questionnaires were also available in English for Ghanaian participants and in Turkish for Turkish participants. Participants who were unable to complete the questionnaire themselves were offered assistance from a trained ethnically matched same-sex interviewer, speaking their preferred language. Non-Dutch persons who did not respond to the written invitation letter were visited at home by an ethnically matched interviewer to provide additional information if needed (eg, due to language or reading problems) and to assist in filling out the questionnaire in case the subject was willing to participate in the study. At the physical examination, participants were asked whether they had family members aged 18–70 years old (parents, siblings, children and partner) living in Amsterdam who would also be willing to participate. If so, a maximum of three of these family members were also invited to participate. This multigenerational design enables us to study both family relations as well as different migration generations.
Response and participation rates
Of those invited (n=91 609), 28 individuals were deceased before we invited them, and 1562 appeared not to live at the address or recently moved outside of Amsterdam, leading to 90 019 eligible persons for response analyses.
Of the 90 019 persons invited, 35 322 (39%) responded to our written invitation (figure 1). Of those who responded, 20 445 (58%) agreed to participate. Of the 90 019 persons invited, 54 697 (61%) did not respond to our written invitation. We were able to visit 19 307 (35%) of those non-responders at home. Of the 19 307 visited at home, 4344 (23%) agreed to participate, whereas 10 286 (53 %) refused to participate. We were unable to contact 4677 (24%), even after five visits (both during day time and in the evening). Therefore, overall, we were able to contact and get a response from 55% (49 952/90 019) of those invited, either by written invitation or after a home visit by an interviewer. Of those, in total 50% (24 789/49 952) agreed to participate, which we define as the ‘participation rate’. There were modest ethnic variations in response and participation rates as shown in figure 1. The most frequently mentioned reasons for not participating were ‘no time’, ‘not interested’ or ‘having health problems’. Also, 1217 persons who initially agreed to participate repeatedly did not show up at their appointment or could not be reached to arrange an appointment and, for these reasons, did not participate.
Figure 1.

Flow chart of recruitment for the HELIUS study. Participation rate: percentage of participants of those contacted; response rate: percentage of participants of those invited.
Finally, of all 90 019 invited persons, baseline data were obtained from 24 789 participants (28%), which we define as the ‘response rate’. The response rate also showed some variation across ethnic groups (figure 1). The response among family members was somewhat higher (~40%) than among index persons (~25%), but in the end, only 12.9% of all participants were recruited as family members (and part of them were also already selected in the random samples of index persons). Of the 24 789 participants, 23 942 participants completed the questionnaire, 23 012 completed the physical examination including the collection of biological samples and 22 165 participants completed both. Table 2 presents the demographic characteristics at baseline, stratified by the six major ethnic groups. As expected, it shows large variations in both age and educational levels (self-reported highest level of education attained, either in the Netherlands or in the country of origin), within and across the ethnic groups. There were gender differences in educational level in some of the ethnic groups. Among Ghanaian, Turkish and Moroccan participants, the proportion of low education was higher in women than in men, whereas the proportion of medium-low education was lower (data not shown).
Table 2.
Demographic characteristics of the baseline HELIUS study population by ethnicity
| Dutch | South-Asian Surinamese | African Surinamese | Ghanaian | Turkish | Moroccan | |
| N | 4671 | 3369 | 4458 | 2735 | 4200 | 4502 |
| Age (years) | 46.1±14.1 | 45.1±13.5 | 47.6±12.8 | 44.0±11.7 | 39.9±12.5 | 39.7±13.1 |
| Age groups | ||||||
| 18–29 years | 883 (18.9) | 661 (19.6) | 611 (13.7) | 420 (15.4) | 1139 (27.1) | 1328 (29.5) |
| 30–39 years | 824 (17.6) | 500 (14.8) | 602 (13.5) | 477 (17.4) | 925 (22.0) | 1058 (23.5) |
| 40–49 years | 956 (20.5) | 870 (25.8) | 1075 (24.1) | 920 (33.6) | 1214 (28.9) | 1047 (23.3) |
| 50–59 years | 1114 (23.8) | 902 (26.8) | 1508 (33.8) | 811 (29.7) | 739 (17.6) | 783 (17.4) |
| 60–70 years | 894 (19.1) | 436 (12.9) | 662 (14.8) | 107 (3.9) | 183 (4.4) | 286 (6.4) |
| Sex | ||||||
| Female | 2525 (54.1) | 1809 (53.7) | 2654 (59.5) | 1671 (61.1) | 2281 (54.3) | 2786 (61.9) |
| Migration generation | ||||||
| 1st generation | NA | 2545 (75.5) | 3689 (82.8) | 2582 (94.4) | 2885 (68.7) | 2998 (66.6) |
| Educational level* | ||||||
| Low | 153 (3.3) | 474 (14.1) | 252 (5.7) | 684 (28.0) | 1260 (31.1) | 1303 (30.4) |
| Medium-low | 660 (14.3) | 1120 (33.4) | 1602 (36.2) | 976 (40.0) | 1008 (25.0) | 782 (18.2) |
| Medium-high | 1018 (22.1) | 1003 (29.9) | 1582 (35.8) | 629 (25.8) | 1174 (29.1) | 1468 (34.2) |
| High | 2784 (60.3) | 753 (22.5) | 986 (22.3) | 152 (6.2) | 586 (14.5) | 739 (17.2) |
Data are presented as mean±SD or n (%).
Participants of unknown/other Surinamese (n=803), or unknown/other (n=51) ethnic origin are excluded from this table.
*Low=no schooling or elementary schooling only, medium-low=lower vocational schooling or lower secondary schooling, medium-high=intermediate vocational schooling or intermediate/higher secondary schooling, high=higher vocational schooling or university.
NA, not applicable.
Differences between participants, non-participants and those not contacted
Among all ethnic groups, women were more likely to participate than men, as evidenced by the higher percentage of women among participants as compared with that of the total random samples (all invited) (table 3). Among those not contacted, the percentage of women was particularly low (except among Surinamese).
Table 3.
Sex, age, and postal code-based socioeconomic status (SES) indicators among participants, non-participants and those not contacted by ethnicity
| Dutch | Surinamese* | Ghanaian | Turkish | Moroccan | |
| Sex (% women) | |||||
| All invited (random samples) | 50.0 | 54.9 | 52.9 | 47.7 | 49.3 |
| Participants | 54.1 | 57.3 | 61.1 | 54.3 | 61.9 |
| Non-participants | 55.5 | 52.1 | 48.6 | 49.9 | 59.7 |
| Not contacted | 44.3 | 55.1 | 48.3 | 42.8 | 38.9 |
| Age (years) | |||||
| All invited (random samples) | 43.2±14.6 | 43.5±13.6 | 42.8±12.3 | 37.6±13.3 | 37.9±13.5 |
| Participants | 46.0±14.1 | 46.2±13.1 | 43.7±11.8 | 39.6±12.5 | 39.5±13.1 |
| Non-participants | 47.9±14.7 | 43.6±13.9 | 42.2±13.4 | 37.8±13.5 | 38.4±14.1 |
| Not contacted | 38.8±13.6 | 41.3±13.4 | 42.4±12.1 | 36.5±13.3 | 37.1±13.3 |
| SES indicator (average property value, kEuro) | |||||
| All invited (random samples) | 264.9±139.0 | 192.3±70.7 | 154.3±47.0 | 194.9±61.6 | 192.8±60.3 |
| Participants | 273.6±139.6 | 196.2±72.0 | 151.9±43.9 | 194.4±58.1 | 195.2±56.9 |
| Non-participants | 258.8±136.7 | 191.9±69.0 | 150.9±43.0 | 193.0±61.4 | 194.5±61.9 |
| Not contacted | 261.3±139.4 | 189.5±70.8 | 158.1±50.9 | 196.4±63.4 | 191.0±60.8 |
| SES indicator (% on minimum income) | |||||
| All invited (random samples) | 10.0 (2.7–20.7) | 22.0 (9.5–34.4) | 30.0 (18.5–39.4) | 25.0 (12.5–36.4) | 28.0 (17.1–38.5) |
| Participants | 9.1 (1.7–19.0) | 20.9 (7.8–33.3) | 30.8 (19.2–40.0) | 26.1 (13.3–37.0) | 28.6 (18.2–38.7) |
| Non-participants | 11.1 (2.9–22.7) | 21.8 (9.1–34.6) | 31.0 (18.9–40.9) | 26.3 (14.3–26.3) | 29.0 (17.6–39.1) |
| Not contacted | 10.2 (3.0–20.8) | 22.9 (10.9–35.0) | 28.6 (17.1–37.9) | 23.8 (11.1–35.3) | 27.3 (16.3–37.9) |
Data are presented as percentages, mean±SD or median (IQR).
*Non-response data were only available for the Surinamese sample as a whole, because municipality registers do not distinguish between Surinamese subgroups.
On average, those who participated were slightly older than those who refused to participate (except for the Dutch) or were not contacted. Those not contacted were the youngest among all ethnic groups. Figure 2 (upper panel) shows the response rates by age groups and ethnicity. The highest response was in the age group 45–54 years among the Ghanaian, Turkish and Moroccan groups, whereas in the Dutch and Surinamese groups, the highest response was among those aged 55–64 years. The lower response rates in the Ghanaian, Turkish and Moroccan groups of older age might be due to language difficulties experienced, in particular, in these older groups. Among those contacted, the percentage of those agreeing to participate (participation rate) also differed slightly by age group across all ethnic groups (figure 2, lower panel).
Figure 2.

Response rate (upper panel) and participation rate (lower panel) by 5-year age groups and ethnicity. Participation rate: percentage of participants of those contacted; response rate: percentage of participants of those invited (see also figure 1).
To explore to what extent the response was related to socioeconomic status (SES), we constructed two SES indicators based on registry data at the level of the six-digit postcodes maintained by the Department of Research and Statistics of the Municipality of Amsterdam: (1) the average property value of dwellings and (2) the percentage of residents living on a minimum income. This six-digit postcode area is the smallest geographical unit available. On average, these units are 50 by 50 m in size and include 10–20 households. Table 3 shows that both SES indicators are more favourable (ie, higher property value and lower percentage of residents living on minimum income) among participants as compared with non-participants. However, the differences are relatively small, particularly when compared with differences in these SES indicators across ethnic groups. The differences in SES indicators between the ethnic groups are in line with the ethnic differences in individual-level measured educational level as measured among participants (table 2), showing the highest educational level among Dutch (highest percentage of medium-high plus high education) and the lowest among Ghanaians (highest percentage of low plus medium-low education).
Measurements of risk factors and health outcomes
Table 4 provides an overview of the variables that were measured either by questionnaire or during the physical examination (more details on measurements are available from the authors on request). Risk factors include general factors such as physical, behavioural, psychosocial and biological factors, as well as ethnicity-specific characteristics such as culture, migration history, ethnic identity, socioeconomic factors and discrimination. In addition, more extensive measures were measured not in the total study population but in subsamples only. For example, dietary intake was estimated by an additional extensive food frequency questionnaire in a subsample of about 5200 participants.13 Table 5 lists the biological samples that were collected (and, for those who gave permission, also stored) and the laboratory measurements that are already available. Faeces microbiome data will be available from a subsample of about 6000 participants; this will provide a unique cohort to extend research on the role of gut microbiota composition in the development of diabetes, cardiovascular diseases and other health outcomes.14 15
Table 4.
Variables measured by questionnaire and measures obtained during the physical examination (extension of tables from ref 7)
| Theme | Variables questionnaire | Outcomes | Physical examination |
| Explanatory factors | Explanatory factors/outcomes | ||
| General |
Demographic and ethnicity-specific factors: sex, age, marital status, household composition, country of birth of participant and his/her (grand)parents, self-reported ethnicity, migration history, educational level, occupational status, occupational level, religion, cultural distance (acculturation), ethnic identity, perceived ethnic discrimination (Everyday Discrimination Scale) Health-related behaviours: smoking, alcohol intake, cannabis use, physical activity (SQUASH questionnaire), weight perception, fruit intake, vegetarian diet, dietary pattern (breakfast, lunch and evening meal), coffee/tea intake, sugary drinks intake Healthcare use and related factors: subjectively measured health literacy (SBS-Q), compliance with medication, perceived quality of GP, healthcare use (GP, specialists, psychological care and alternative healthcare), healthcare use in country of origin Subsample*:
|
Perceived general health, quality of life (SF-12), list of 20 chronic conditions, functional limitations (in those aged >55 years) | Anthropometry (weight, height and circumferences of waist, hip, thigh, arm and calf) Body fat percentage (using bioelectrical impedance) Hand grip strength Current medication use Subsamples*:
|
| Cardiovascular health | History of high blood pressure/hypercholesterolaemia/ diabetes (including family history), family history of cardiovascular disease/sudden death, fainting history, age of menarche, age of menopause | Angina pectoris, possible myocardial infarction and intermittent claudication (by Rose questionnaire), self-reported and suspected myocardial infarction, self-reported and suspected cerebrovascular events | Blood pressure (sitting position, 5 min of rest, WatchBP Home, Microlife) Electrocardiogram (supine position, MAC 1600 System, GE Healthcare) Subsamples*:
|
| Mental health | Perceived social support (DES subscale of SSQT with SSQS), childhood trauma, parental psychiatric history, mastery (Pearlin-Schooler Mastery Scale), neuroticism and extraversion (NEO Five Factor Inventory), stressful life events | Depressive symptoms (PHQ-9), nicotine use-related disorder (Fagerstrom), alcohol use-related disorder (AUDIT), cannabis use-related disorder (CUDIT) | |
| Infectious diseases | History and presence of allergy/asthma/rhinitis, family history of allergy/asthma, food allergy, urogenital infections, travel behaviour, use of self-tests, history of blood transfusions, history of surgery in other countries, injecting drug use, sexual behaviour, use of contraceptives (women), vaccination against human papilloma virus (women), circumcision (men) | Self-reported current respiratory symptoms Self-reported vaginal hygiene (women) |
*In subsamples, we strived for equal numbers in each ethnic group.
ABI, ankle-brachial index; AUDIT, Alcohol Use Disorders Identification Test; BP, blood pressure; CUDIT, Cannabis Use Disoreders Identification Test; DES, Daily Emotional Support subscale; GP, General practitioner; NEO, Neuroticism, Extraversion and Openness; PHQ-9, Patient Health Questionnaire-9; REALM-D, Rapid Estimate of Adult Literacy in Medicine in Dutch; SBS-Q, Chew’s Set of Brief Screening Questions; SF-12, 12-Item Short Form Survey; SQUASH, Short Questionnaire to Assess Health-enhancing physical activity; SSQS, Social Support Questionnaire for Satisfaction; SSQT, Social Support Questionnaire for Transactions;.
Table 5.
Overview of available laboratory measures and stored biological samples
| Type of sample | Laboratory measurements available | Biological samples stored in biobank |
| Fasting blood (including DNA) |
|
|
| Morning urine |
|
|
| Faeces samples (subsample, n≈6000) |
|
Not applicable |
| Vaginal swabs (subsample, n≈6000) |
|
|
| Nasal and throat swabs (subsample, n≈6600) |
|
|
*Available in 2018.
ApoB, Apolipoprotein B; CRP, C reactive protein; GSA, global screening array; HbA1c, glycosylated hemoglobin A1C; HDL, high density lipoprotein; LDL, low density lipoprotein; Lpa, lipoprotein a; pH, potential of hydrogen; SNP, single nucleotide polymorphism.
Cross-cultural validity of measurements
Whenever possible, we used standard validated questionnaires. For example, the Patient Health Questionnaire-9 (PHQ-9) was used to measure depressive symptoms,16 the 12-Item short form survey (SF-12) was used to measure quality of life17 and the short questionnaire to assess health-enhancing physical activity (SQUASH) was used to assess physical activity.18 However, because validity studies for these instruments were performed in the Dutch general population or in only a few ethnic groups in the Netherlands only,19 it was unknown whether they had similar validity and reliability for all the ethnic groups included in HELIUS. Validity studies within the HELIUS study indicated that the PHQ-9 20 and SF-12 indeed measure the same concepts in all ethnic groups and that there are no systematic differences in reporting between the groups. Also, the validity of self-reported physical activity with the SQUASH was similar across ethnic groups. However, consistent with findings in the literature, we observed low agreement between self-reported physical activity and objectively measured physical activity by accelerometer and heart rate monitor. In addition, low test–retest reliability was found for the SQUASH in all groups, implying no valid basis for the comparison of physical activity between the different ethnic groups.21
Longitudinal data
Baseline HELIUS measurements took place in 2011–2015. The goal of HELIUS is to repeat baseline measurements during follow-up examinations every 5–10 years to enable longitudinal analyses on the relationship between risk factors and cardiovascular diseases, mental health and infectious diseases. In addition, in the participants’ written informed consent obtained at baseline, we also asked permission (1) to store biological samples in the HELIUS biobank for future research (94% agreed), (2) to link their individual data to registries containing data relating to the participants’ health (such as hospital admissions, pharmacy data, vaccination programmes; 90% agreed), (3) to request the official causes of death from Statistics Netherlands (87% agreed) and (4) to approach them for additional studies in the future (substudies; 92% agreed). This enables us to obtain new laboratory measures at baseline in the future (from stored samples in the biobank) and to link baseline HELIUS data to follow-up data (risk factors, health outcomes and mortality) obtained from existing registrations. In 2016, a first linkage of HELIUS data to follow-up registry data (healthcare use data as registered by healthcare insurance company) was performed, and data are currently analysed.
Findings to date
A list of all publications that are based on data from the HELIUS study is available at this website: http://www.heliusstudy.nl/nl/researchers/publications. The first results have confirmed large inequalities in health between ethnic groups, such as diabetes and depressive symptoms, which can only partially be explained by inequalities in traditional risk factors, such as obesity and SES. In addition, the first results provided important clues for targeting prevention and healthcare. Below, we highlight some of these key findings emerging from the HELIUS study.
Ethnic inequalities in health
The prevalence of important cardiovascular disease risk factors varies largely between the ethnic groups. Figure 3A (upper panel) shows that, while the prevalence of diabetes in the Dutch group remains below 5%, the prevalence of diabetes ranges from 10% to 12% in participants of African Surinamese, Ghanaian, Turkish and Moroccan origin and is particularly high among the South-Asian Surinamese (20%). Ethnic minority groups also have a 1.3 (Moroccans) to 3.6 (Ghanaians) times higher prevalence of hypertension as compared with the Dutch groups, and hypertension prevalence is particularly high in the two groups of African origin (Ghanaians and African Surinamese).22 The higher prevalence of hypertension among the Turkish and Moroccan groups compared with the Dutch group suggests that risk patterns may be changing unfavourably over time because, just over a decade ago, these groups had a lower prevalence of hypertension compared with the Dutch.23 A large variation is also seen in depressive symptoms, with particularly high prevalence rates of depressed mood among the South-Asian Surinamese (19%), Turkish (23%) and Moroccan (21%) participants (figure 3B) (middle panel).
Figure 3.
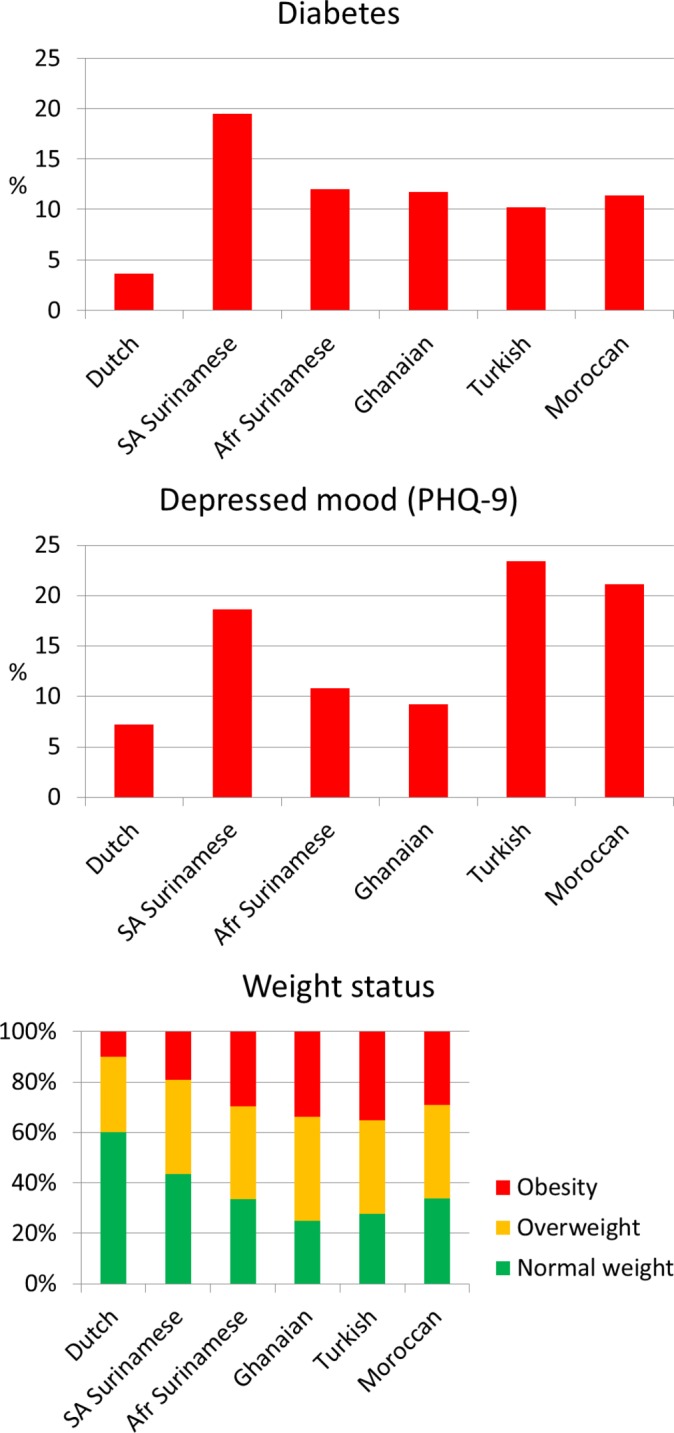
The prevalence of diabetes (upper panel), depressive mood (middle panel) and weight status (lower panel) by ethnicity. Diabetes is defined by self-reported diagnosis of diabetes, fasting glucose ≥7.0 mmol/L and/or use of glucose lowering medication; depressed mood defined as a PHQ-9 sum score ≥10; obesity defined as a BMI ≥30 kg/m2; overweight defined as a BMI 25–30 kg/m2; normal weight defined as a BMI <25 kg/m2. Afr, African; BMI, body mass index; PHQ-9, patient health questionnaire-9; SA, South-Asian.
Overweight is one of the most important causes of increased cardiovascular risk and is also associated with depression.24 As expected, large differences in overweight and obesity were found between the ethnic groups (figure 3C) (lower panel). While 60% of the Dutch population is considered to have a normal weight based on their body mass index, this percentage is only about 30% in the ethnic minority groups. Particularly in the Ghanaian and Turkish groups, the prevalence of normal weight is very low, and the prevalence of obesity (extreme overweight) is extremely high, that is, up to 35% as compared with 10% in the Dutch. However, the ethnic inequalities in both hypertension and diabetes are not explained by differences in overweight, or other ‘traditional’ risk factors such as fat distribution, educational level or health behaviours.22 25 Ethnic inequalities were not only observed for cardiovascular risk factors, but also for early markers of cardiovascular disease or markers of end-organ damage, such as arterial wave reflection and chronic kidney disease26 27; again, this could not be attributed to traditional cardiovascular disease risk factors. Our results suggest ethnic inequalities in the aetiology of these diseases and emphasise the importance of further research on the underlying causes of ethnic differences in cardiovascular health.
Within HELIUS, we also examined some risk factors that are less often investigated. For example, hand grip strength (a marker of muscle function) was found to be strongly related with diabetes, and large differences in hand grip strength were found between the ethnic groups (highest in Dutch and lowest in South-Asian Surinamese).28 In addition, short sleep duration (<7 hours per night) was more prevalent in the ethnic minority groups as compared with the Dutch,29 and short sleep duration was related to overweight, diabetes and hypertension.30 However, despite these strong relations, both short sleep duration and hand grip strength only marginally contributed to the large ethnic inequalities in cardiovascular risk factors.28 30 Chronic stress is also suggested to contribute to cardiovascular risk, and an important chronic stress factor specific for ethnic minority groups is the level of perceived ethnic discrimination (PED).31 In HELIUS, a positive association was found between PED and the clustering of traditional cardiovascular risk factors (metabolic syndrome) in some ethnic groups, with PED contributing about 5%–7% to the metabolic syndrome in Surinamese and Moroccans.32 PED was also related to depressive symptoms. In ethnic minority groups, PED is reported to account for about 25% of depressive symptoms.33
Human papillomavirus (HPV) is an easily transmittable sexually transmitted infection, and persistent infections with high-risk HPV (hrHPV) types cause nearly all cases of cervical cancer.34 Higher incidences of cervical cancer (the fourth most common female cancer globally) have been observed among ethnic minority women as compared with women of Dutch origin.35 In HELIUS, the seroprevalence of hrHPV seroprevalence in blood, and the prevalence of vaginal high-risk hrHPV infection, differed between the ethnic groups.36–38 South-Asian Surinamese, Moroccan and Turkish women had an overall lower seroprevalence of hrHPV (22%, 14% and 15%, respectively) as compared with Dutch women (30%).38 Vaginal hrHPV prevalence was highest in the Dutch (42%) followed by the African Surinamese (32%), Turkish (29%), Ghanaian (26%), Moroccan (26%) and South Asian Surinamese women (18%).36 When adjusting for sexual risk behaviour, the odds to be hrHPV positive were similar for all ethnic groups. However, because of the higher incidence of cervical cancer in ethnic minority groups compared with the Dutch,35 we expected to observe higher (sero)prevalences of hrHPV in ethnic minority women than in Dutch women. Future studies should explore other factors potentially responsible for the higher incidence of cervical cancer in these ethnic minorities (eg, differences in clearance/persistence of hrHPV infection or differences in participation in cervical cancer screening programmes).
Prevention and healthcare
Results of the earlier Surinamese in The Netherlands: Study on Ethnicity and Health (SUNSET) study in 2001–2003 showed that, at that time, Surinamese participants were less often aware of their high blood pressure and, therefore, were also less often treated, as compared with Dutch participants.39 This suggested a reduced access or quality of healthcare among Surinamese as compared with the Dutch, which could contribute to ethnic disparities in health. Our recent HELIUS results show that, as compared with the Dutch, the Surinamese groups (and the other ethnic minority groups) are currently even more often aware of their high blood pressure and are more often treated for hypertension.22 These results suggest an improvement in hypertension management among ethnic minorities in Amsterdam in the last decade. However, despite medical treatment, ethnic minority groups suffering from hypertension still have lower rates of adequately controlled blood pressure levels.22 A similar pattern is observed for diabetes: although similar or even higher awareness and treatment levels are observed in ethnic minority groups compared with the Dutch, poor glycaemic control is still highly prevalent.25 As poor blood pressure control and poor glycaemic control are serious risk factors for cardiovascular diseases, it is important to investigate the causes of this poor control among the ethnic minority groups. One important factor to consider is the use of healthcare outside the Netherlands. In HELIUS, we observed that some ethnic minority groups use healthcare in their country of origin more often than other ethnic minority groups, ranging from 4% among Surinamese to over 20% among Turkish ethnic groups.40 We need to evaluate to what extent this influences their healthcare use in the Netherlands and their health.
Of all participants included in HELIUS, although 5% reported a history of cardiovascular disease (myocardial infarction, stroke and/or revascularisation), many of them did not have the risk factors under control; that is, 33% was still smoking, 76% was overweight, 55% did not achieve the norm for physical activity, 31% had uncontrolled blood pressure and 58% still had increased low-density lipoprotein (LDL)-cholesterol levels.41 These results show that risk factor control in secondary prevention is poor in the majority of individuals with cardiovascular diseases. The results suggest that secondary prevention should perhaps focus on different risk factors, depending on the ethnic origin of the individual patient.
Strengths and limitations
The main strengths of our cohort are the inclusion of a large number of participants from several ethnic groups living in the same city and the collection of an extensive set of questionnaires, biological samples and physical measurements. Outcomes and risk factors are measured based on the same methodology across all ethnic groups, including the majority population.
Several supportive measures were taken to enhance the enrolment of ethnic minority groups. For example, we used ethnic-specific communication strategies, for example, working with faith communities (churches and mosques) and endorsement from local key figures. In addition, after invitation by mail, we visited participants at home, used translated questionnaires and had ethnically matched interviewers and research assistants to provide help during data collection. Despite these labour-intensive measures, response rates were relatively low, and this may have resulted in selection bias. However, we were able to include large numbers of each ethnic group in which all social-economic levels are represented; moreover, our non-response analyses show that socioeconomic differences between participants and non-participants were very small.
In HELIUS, the unique ethnic differentiation can be used to investigate which factors might explain ethnic inequalities in health, such as socioeconomic factors, culture, migration history, ethnic identity, discrimination and genetic factors. Furthermore, we are able to validate existing questionnaires (such as the SF-12 and PHQ-9) across these ethnic groups. The addition of more complex or specific measures performed among subsamples of the cohort (such as gut microbiome data) will provide additional unique data bases. Finally, a major strength is the focus on three disease categories that each are a major cause of the global burden of disease, thereby enabling studies on the potential crosslinks between these disease categories.
Acknowledgments
The authors would like to thank all participants of the HELIUS study. In addition, we would like to thank the management team, research nurses, interviewers, research assistants and other staff who took part in the data collection for this study.
Footnotes
Contributors: MBS, MP, EMD, RJGP, AHZ and KS participated in the conceptual design of the study. MS drafted the manuscript and performed the analyses. All authors critically revised the manuscript and contributed to interpretation of the data. All authors read and approved the final version of the manuscript.
Funding: The Academic Medical Center (AMC) of Amsterdam and the Public Health Service of Amsterdam (GGD Amsterdam) provided core financial support for HELIUS. The HELIUS study is also funded by research grants of the Dutch Heart Foundation (Hartstichting; grant no. 2010T084), the Netherlands Organization for Health Research and Development (ZonMw; grant no. 200500003), the European Integration Fund (EIF; grant no. 2013EIF013) and the European Union (Seventh Framework Programme, FP-7; grant no. 278901).
Competing interests: None declared.
Patient consent: Obtained.
Ethics approval: The HELIUS study has been approved by the Ethical Review Board of the Academic Medical Center Amsterdam.
Provenance and peer review: Not commissioned; externally peer reviewed.
Data sharing statement: No additional data available.
Collaborators: The HELIUS study has an open policy with regard to collaboration with other research groups and welcomes collaborations from a wide variety of disciplines. Information on procedures toacquire the available data and/or samples are described in the HELIUS Collaboration Policy, which can be found at www.heliusstudy.nl/nl/researchers/collaboration. In brief, to make use of the available data for research, we request a publication proposal describing background, aim, research questions, methods (analysis plan), and time table. All proposals should be submitted to HELIUS via the corresponding author of this article, or via info@heliusstudy.nl. The proposals are discussed in the HELIUS Executive Board regarding the study aims (compatibility with the general objectives of the HELIUS study/informed consent), the quality of the research proposal, and potential overlap with on going studies. After approval, the requested data will be provided after a Data Transfer Agreement has been signed. For more information, please visit our website or contact the corresponding author.
References
- 1. Hahné SJ, Veldhuijzen IK, Wiessing L, et al. . Infection with hepatitis B and C virus in Europe: a systematic review of prevalence and cost-effectiveness of screening. BMC Infect Dis 2013;13:181 10.1186/1471-2334-13-181 [DOI] [PMC free article] [PubMed] [Google Scholar]
- 2. Stirbu I, Kunst AE, Bos V, et al. . Differences in avoidable mortality between migrants and the native Dutch in The Netherlands. BMC Public Health 2006;6:78 10.1186/1471-2458-6-78 [DOI] [PMC free article] [PubMed] [Google Scholar]
- 3. Missinne S, Bracke P. Depressive symptoms among immigrants and ethnic minorities: a population based study in 23 European countries. Soc Psychiatry Psychiatr Epidemiol 2012;47:97–109. 10.1007/s00127-010-0321-0 [DOI] [PubMed] [Google Scholar]
- 4. Bainey KR, Jugdutt BI. Increased burden of coronary artery disease in South-Asians living in North America. Need for an aggressive management algorithm. Atherosclerosis 2009;204:1–10. 10.1016/j.atherosclerosis.2008.09.023 [DOI] [PubMed] [Google Scholar]
- 5. Liebson PR. Cardiovascular disease in special populations III: stroke. Prev Cardiol 2010;13:1–7. 10.1111/j.1751-7141.2009.00041.x [DOI] [PubMed] [Google Scholar]
- 6. Bhopal RS. Research agenda for tackling inequalities related to migration and ethnicity in Europe. J Public Health 2012;34:167–73. 10.1093/pubmed/fds004 [DOI] [PubMed] [Google Scholar]
- 7. Stronks K, Snijder MB, Peters RJ, et al. . Unravelling the impact of ethnicity on health in Europe: the HELIUS study. BMC Public Health 2013;13:402 10.1186/1471-2458-13-402 [DOI] [PMC free article] [PubMed] [Google Scholar]
- 8. Murray CJ, Vos T, Lozano R, et al. . Disability-adjusted life years (DALYs) for 291 diseases and injuries in 21 regions, 1990-2010: a systematic analysis for the Global burden of disease study 2010. Lancet 2012;380:2197–223. 10.1016/S0140-6736(12)61689-4 [DOI] [PubMed] [Google Scholar]
- 9. GBD 2015 Mortality and Causes of Death Collaborators. Global, regional, and national life expectancy, all-cause mortality, and cause-specific mortality for 249 causes of death, 1980-2015: a systematic analysis for the Global Burden of Disease Study 2015. Lancet 2016;388:1459–544. 10.1016/S0140-6736(16)31012-1 [DOI] [PMC free article] [PubMed] [Google Scholar]
- 10. Penninx BW, Milaneschi Y, Lamers F, et al. . Understanding the somatic consequences of depression: biological mechanisms and the role of depression symptom profile. BMC Med 2013;11:129 10.1186/1741-7015-11-129 [DOI] [PMC free article] [PubMed] [Google Scholar]
- 11. Sessa R, Pietro MD, Filardo S, et al. . Infectious burden and atherosclerosis:a clinical issue. World J Clin Cases 2014;2:240–9. 10.12998/wjcc.v2.i7.240 [DOI] [PMC free article] [PubMed] [Google Scholar]
- 12. Stronks K, Kulu-Glasgow I, Agyemang C. The utility of ‘country of birth’ for the classification of ethnic groups in health research: the Dutch experience. Ethn Health 2009;14:255–69. 10.1080/13557850802509206 [DOI] [PubMed] [Google Scholar]
- 13. Dekker LH, Snijder MB, Beukers MH, et al. . A prospective cohort study of dietary patterns of non-western migrants in the Netherlands in relation to risk factors for cardiovascular diseases: HELIUS-Dietary Patterns. BMC Public Health 2011;11:441 10.1186/1471-2458-11-441 [DOI] [PMC free article] [PubMed] [Google Scholar]
- 14. Zhernakova A, Kurilshikov A, Bonder MJ, et al. . Population-based metagenomics analysis reveals markers for gut microbiome composition and diversity. Science 2016;352:565–9. 10.1126/science.aad3369 [DOI] [PMC free article] [PubMed] [Google Scholar]
- 15. Falony G, Joossens M, Vieira-Silva S, et al. . Population-level analysis of gut microbiome variation. Science 2016;352:560–4. 10.1126/science.aad3503 [DOI] [PubMed] [Google Scholar]
- 16. Kroenke K, Spitzer RL, Williams JB. The PHQ-9: validity of a brief depression severity measure. J Gen Intern Med 2001;16:606–13. [DOI] [PMC free article] [PubMed] [Google Scholar]
- 17. Ware J, Kosinski M, Keller SD. A 12-item short-form health survey: construction of scales and preliminary tests of reliability and validity. Med Care 1996;34:220–33. [DOI] [PubMed] [Google Scholar]
- 18. Wendel-Vos GC, Schuit AJ, Saris WH, et al. . Reproducibility and relative validity of the short questionnaire to assess health-enhancing physical activity. J Clin Epidemiol 2003;56:1163–9. 10.1016/S0895-4356(03)00220-8 [DOI] [PubMed] [Google Scholar]
- 19. Baas KD, Cramer AO, Koeter MW, et al. . Measurement invariance with respect to ethnicity of the Patient Health Questionnaire-9 (PHQ-9). J Affect Disord 2011;129 229–35. 10.1016/j.jad.2010.08.026 [DOI] [PubMed] [Google Scholar]
- 20. Galenkamp H, Stronks K, Snijder MB, et al. . Measurement invariance testing of the PHQ-9 in a multi-ethnic population in Europe: the HELIUS study. BMC Psychiatry 2017;17:349 10.1186/s12888-017-1506-9 [DOI] [PMC free article] [PubMed] [Google Scholar]
- 21. Nicolaou M, Gademan MG, Snijder MB, et al. . Validation of the squash physical activity questionnaire in a multi-ethnic population: The helius study. PLoS One 2016;11:e0161066 10.1371/journal.pone.0161066 [DOI] [PMC free article] [PubMed] [Google Scholar]
- 22. Agyemang C, Kieft S, Snijder MB, et al. . Hypertension control in a large multi-ethnic cohort in Amsterdam, The Netherlands: the HELIUS study. Int J Cardiol 2015;183:180–9. 10.1016/j.ijcard.2015.01.061 [DOI] [PubMed] [Google Scholar]
- 23. Agyemang C, Ujcic-Voortman J, Uitenbroek D, et al. . Prevalence and management of hypertension among Turkish, Moroccan and native Dutch ethnic groups in Amsterdam, the Netherlands: The Amsterdam Health Monitor Survey. J Hypertens 2006;24:2169–76. 10.1097/01.hjh.0000249693.73618.c9 [DOI] [PubMed] [Google Scholar]
- 24. de Wit L, Luppino F, van Straten A, et al. . Depression and obesity: a meta-analysis of community-based studies. Psychiatry Res 2010;178:230–5. 10.1016/j.psychres.2009.04.015 [DOI] [PubMed] [Google Scholar]
- 25. Snijder MB, Agyemang C, Peters RJ, et al. . Case finding and medical treatment of type 2 diabetes among different ethnic minority groups: the helius study. J Diabetes Res 2017;2017:1–8. 10.1155/2017/9896849 [DOI] [PMC free article] [PubMed] [Google Scholar]
- 26. Snijder MB, Stronks K, Agyemang C, et al. . Ethnic differences in arterial stiffness the HELIUS study. Int J Cardiol 2015;191:28–33. 10.1016/j.ijcard.2015.04.234 [DOI] [PubMed] [Google Scholar]
- 27. Agyemang C, Snijder MB, Adjei DN, et al. . Ethnic disparities in ckd in the netherlands: the healthy life in an urban setting (helius) study. Am J Kidney Dis 2016;67:391–9. 10.1053/j.ajkd.2015.07.023 [DOI] [PubMed] [Google Scholar]
- 28. van der Kooi AL, Snijder MB, Peters RJ, et al. . The association of handgrip strength and type 2 diabetes mellitus in six ethnic groups: an analysis of the helius study. PLoS One 2015;10:e0137739 10.1371/journal.pone.0137739 [DOI] [PMC free article] [PubMed] [Google Scholar]
- 29. Anujuo K, Stronks K, Snijder MB, et al. . Ethnic differences in self-reported sleep duration in The Netherlands--the HELIUS study. Sleep Med 2014;15:1115–21. 10.1016/j.sleep.2014.04.019 [DOI] [PubMed] [Google Scholar]
- 30. Anujuo K, Stronks K, Snijder MB, et al. . Relationship between short sleep duration and cardiovascular risk factors in a multi-ethnic cohort - the helius study. Sleep Med 2015;16:1482–8. 10.1016/j.sleep.2015.08.014 [DOI] [PubMed] [Google Scholar]
- 31. Williams DR, Mohammed SA. Discrimination and racial disparities in health: evidence and needed research. J Behav Med 2009;32:20–47. 10.1007/s10865-008-9185-0 [DOI] [PMC free article] [PubMed] [Google Scholar]
- 32. Ikram UZ, Snijder MB, Agyemang C, et al. . Perceived ethnic discrimination and the metabolic syndrome in ethnic minority groups: The healthy life in an urban setting study. Psychosom Med 2017;79:101–11. 10.1097/PSY.0000000000000350 [DOI] [PubMed] [Google Scholar]
- 33. Ikram UZ, Snijder MB, Fassaert TJ, et al. . The contribution of perceived ethnic discrimination to the prevalence of depression. Eur J Public Health 2015;25:243–8. 10.1093/eurpub/cku180 [DOI] [PubMed] [Google Scholar]
- 34. de Martel C, Ferlay J, Franceschi S, et al. . Global burden of cancers attributable to infections in 2008: a review and synthetic analysis. Lancet Oncol 2012;13:607–15. 10.1016/S1470-2045(12)70137-7 [DOI] [PubMed] [Google Scholar]
- 35. Arnold M, Aarts MJ, van der Aa M, et al. . Investigating cervical, oesophageal and colon cancer risk and survival among migrants in The Netherlands. Eur J Public Health 2013;23:867–73. 10.1093/eurpub/cks146 [DOI] [PubMed] [Google Scholar]
- 36. Alberts CJ, Vos RA, Borgdorff H, et al. . Vaginal high-risk human papillomavirus infection in a cross-sectional study among women of six different ethnicities in Amsterdam, the Netherlands: the HELIUS study. Sex Transm Infect 2016;92:611–8. 10.1136/sextrans-2015-052397 [DOI] [PubMed] [Google Scholar]
- 37. Kovaleva A, Alberts CJ, Waterboer T, et al. . A cross-sectional study on the concordance between vaginal HPV DNA detection and type-specific antibodies in a multi-ethnic cohort of women from Amsterdam, the Netherlands - the HELIUS study. BMC Infect Dis 2016;16:502 10.1186/s12879-016-1832-4 [DOI] [PMC free article] [PubMed] [Google Scholar]
- 38. Alberts CJ, Michel A, Bruisten S, et al. . High-risk human papillomavirus seroprevalence in men and women of six different ethnicities in Amsterdam, the Netherlands: The HELIUS study. Papillomavirus Res 2017;3:57–65. 10.1016/j.pvr.2017.01.003 [DOI] [PMC free article] [PubMed] [Google Scholar]
- 39. Agyemang C, Bindraban N, Mairuhu G, et al. . Prevalence, awareness, treatment, and control of hypertension among black surinamese, South Asian surinamese and White Dutch in Amsterdam, The Netherlands: the SUNSET study. J Hypertens 2005;23:1971–7. 10.1097/01.hjh.0000186835.63996.d4 [DOI] [PubMed] [Google Scholar]
- 40. Şekercan A, Lamkaddem M, Snijder MB, et al. . Healthcare consumption by ethnic minority people in their country of origin. Eur J Public Health 2015;25:384–90. 10.1093/eurpub/cku205 [DOI] [PubMed] [Google Scholar]
- 41. Minneboo M, Lachman S, Snijder MB, et al. . Risk factor control in secondary prevention of cardiovascular disease: results from the multi-ethnic HELIUS study. Neth Heart J 2017;25:250–7. 10.1007/s12471-017-0956-5 [DOI] [PMC free article] [PubMed] [Google Scholar]