

Abstract
Purpose. Advanced cancer patients with disease progression develop cachexia. Nevertheless, cancer patients at nutritional risk have shown improved body weight and quality of life with oral nutritional supplements. Method. This was a randomized controlled trial in adult female cancer patients (n = 63) attending palliative clinics, with symptoms of cachexia. Eligible patients were randomly distributed into control (n = 33) and intervention (n = 30) groups. Both groups were provided with nutritional and physical activity counseling, but the intervention group received an additional 100 g of Improved Atta (IAtta) for 6 months daily consumption. This study was designed to assess the efficacy of IAtta (with counseling) in enhancing the health status of cachexic patients. Anthropometric measurements, dietary intake, physical activity level and quality of life parameters were assessed at baseline, after 3 months, and at the end of 6 months. Results. Patients in the control group (n = 15) had significantly decreased body weight (P = .003), mid–upper-arm circumference (P = .002), and body fat (P = .002) by the end of intervention. A trend of body weight gain in the intervention group (n = 17; P = .08) and significant increase of body fat (P = .002) was observed; moreover, patients reported a significant improvement in fatigue (P = .002) and appetite scores (P = .006) under quality-of-life domains at the end of intervention. Conclusions. Embedding a nutrition-sensitive intervention ( IAtta ) within Indian palliative care therapy may improve quality of life and stabilize body weight in cancer cachexia patients.
Keywords: cachexia, IAtta, palliative care, nutrition-sensitive intervention, quality of life
Introduction
Cancer cachexia is a complex, multifactorial syndrome involving progressive body weight loss, leading to loss of lean body mass and fat stores, combined with functional impairment, reduction in food intake, and altered metabolism. Worldwide, more than 50% of advanced cancer patients suffer from cachexia, and it accounts for mortality in 10% of them.1,2 Cachexia progresses through different stages, initiated by less than 5% pretreatment body weight loss along with anorexia and various metabolic changes (ie, pre-cachexia stage), to more than 5% weight loss with sarcopenia and systemic inflammation (ie, cachexia stage), and finally becoming unresponsive to anticancer treatment, with less than 3 months of expected patient survival (ie, refractory cachexia).3 Although established guidelines exist for nutrition management of cachexia (by various organizations) in cancer patients,4-6 these guidelines are not adopted by the majority of the Indian public hospitals in view of a shortage of clinical nutritionists as part of the cancer management team. Nutritional management remains a lacuna in their care.
The accessibility to reliable cancer treatment and palliative care is very limited for most Indians. The number of oncologists and palliative care health workers in India is low when compared with the developed world, in spite of the high incidence of cancer.7 The central and state governments spend less than 1.5% of their gross domestic products on public health care. Development of better infrastructure and management in cancer care will be difficult if the central and state governments do not increase the budget and allowances allocated for public health.8 Strategies need to be developed by channeling the available resources and keeping in mind the social norms for patient-centered palliative care in India. International guidelines need to be tailored to address cancer patient care in the Indian public health setting.7
In spite of increasing awareness and availability of health care facilities for palliative care, the role of nutrition is not being emphasized. Palliative care for cachexia patients should involve a multimodal treatment approach, which includes not only symptom management, but also nutritional supplementation to correct the energy deficit and physical activity to reduce muscle atrophy.4 Advanced cancer patients have shown increased lean body mass and better quality of life when their diets are supplemented with oral nutritional supplements (ONSs) and/or they are provided with nutritional counseling.9,10 Moreover, dietary counseling has enhanced energy and protein intake and quality of life, reduced radiotherapy toxicity complications, and lowered mortality among advanced cancer patients.11,12 It has been documented that the nutritional intake of cancer cachexia patients is calorie deficient, and they suffer from micronutrient deficiencies.13-17 In the absence of energy-dense nutrient-rich supplements in their diets, the nutritional requirements of these patients are not met, and this puts them in jeopardy.18
ONS is a synthetic energy and protein-dense formula, which aids in patient health status improvement and is widely available in the Indian market. However, this remains unaffordable or unavailable for many in the Indian community. Also, Indians like home cooked food, which is more acceptable compared with packed or refined food items.19 There is a need to develop a natural nutritional supplement meal that can be prepared with minimal training at home using locally available sustainable ingredients. Such a meal can help correct nutritional deficits and improve treatment outcomes among poor cancer patients. At the present time, research is moving toward designing a nutrition-specific optimum mix of foods to target malnutrition among poor populations by addressing food security as well—namely, nutrition-sensitive interventions.20 Nutrition-sensitive intervention meals will address global malnutrition as well as support the development of small- and medium-sized enterprises.20
In India, the traditional flat bread chapati is made of whole wheat flour (called atta) and, along with curry, is consumed daily by approximately 50% of urban and rural people.21 We, therefore, developed a nutritious flour mix using locally available and acceptable ingredients, called Improved Atta (IAtta). The purpose of this study was to determine whether this nutrition-sensitive intervention (along with dietary counseling) improves anthropometric indicators and quality of life in free-living cancer cachexic patients.
We hypothesize that IAtta supplementation along with nutritional counseling can improve cancer cachexic patients’ anthropometric status and quality of life.
Methods
The study was carried out at Dr BRA Institute Rotary Centre Hospital, All India Institute of Medical Sciences (AIIMS), New Delhi, India between December 2013 and August 2014. This centre provides comprehensive palliative care to cancer patients. This study was approved by the ethics committees of the University of Westminster (Approval No.: 12_13_11) and AIIMS (IEC/NP-79/2013) prior to recruitment. The study was carried out in accordance with the guidelines of the Indian Council of Medical Research and Helsinki Declaration. It is registered on http://www.clinicaltrials.gov vide, identifier no. NCT02350855.
In this prospective randomized controlled intervention, we recruited female free-living cancer cachexic patients who were attending the palliative care clinic for symptom management. A total of 123 adult female patients with advanced cancer were screened for eligibility. Patients with weight loss of more than 5% from pretreatment weight, body mass index less than 20 kg/m2 along with hemoglobin level less than 12 g/dL, and energy intake of less than 1500 kcal/d were considered eligible for participation. Patients with gastrointestinal tract disorders, on anabolic steroids, taking synthetic ONSs, and with life expectancy of less than 3 months were excluded from participation. The study’s protocol and patients’ eligibility criteria have been published earlier.10 Eligible patients were asked for consent and enrolled in the study. They were allocated study codes, and a randomization sheet was generated by using nQuery software (7.0 version) by RG. The patients were enrolled by NK and then allocated into 2 groups—intervention group (30 patients) and control group (33 patients)—by RG using simple randomization procedures (Figure 1). Both groups were provided with nutritional counseling (by NK), but the intervention group also received 100 g of IAtta (by RG), to be consumed in addition to their daily dietary intake for 6 months. The patients in control groups were unaware of the IAtta intervention in the other group.
Figure 1.

Study consort diagram.
Intervention
In both groups, all patients received 30 minutes of dietary counseling per visit by a qualified nutritionist. Patients were advised to increase the frequency of homemade meals, and the consumption of energy- and protein-dense food products was encouraged during these sessions.
Patients in the intervention group collected 14 packets of 100 g of IAtta every fortnight during their appointments, whereas the control patients were advised with respect to their dietary habits at every clinic visit (twice a month). Intervention group patients were advised to consume the whole IAtta pack in addition to their daily diet. Each 100 g pack of IAtta contained a mixture of roasted bengal gram flour, roasted barley flour, roasted soybean flour, flaxseed powder, and dried Amaranthus spinosus powder (Table 1). All ingredients included were in roasted and dried form to eliminate microorganism growth and ensure longer shelf life. IAtta was prepared in the hospital kitchen every evening before the patients’ appointment the next day. Utensils used during preparation and ingredient mixing were properly washed and disinfected before every use. Kitchen surfaces in contact with food were cleaned at initiation, and adequate personal hygiene was ensured at all stages of IAtta preparation. It was double packed using food grade plastic bags to eliminate moisture and pathogens. Each pack was labeled with use by date and batch number. The caregiver was advised to make unleavened flat breads (chapatis) by adding spices from the dispensed IAtta pack and to discard leftover supplement at the end of the day. On average 3 flat breads could be prepared from each pack, which provides approximately 400 kcal. Each 400 kcal consists of 50% daily protein requirement, 75% daily fat requirement, and 30% to 50% of iron, calcium, and vitamin A as part of an Indian sedentary woman’s recommended dietary allowance.22 Adherence to IAtta consumption was assessed by self-report of the patient (and/or caregiver), and a manual record of the number of packets dispensed at each visit was maintained. Before the start of follow-up counseling sessions, patients were first interviewed about the number of packets left and accordingly given fresh packs to consume.
Table 1.
IAtta Ingredients and Nutritional Benefits.
| IAtta Ingredients | Roasted Bengal Gram Flour (Cicer arietinum) | Roasted Barley Flour (Hordeum sativum) | Roasted Soy Flour (Glycine max) | Amaranth Leaves (Amaranthus spinosus) | Flax Seeds (Linum usitassimum) |
|---|---|---|---|---|---|
| Rationale for inclusion and advantages | Affordable source of protein, folate, β-carotene, and healthy fatty acids50 | β-Glucan in barley has shown immunomodulatory activity and enhances probiotic activity51 | Enhances the immune system. Soy isoflavons have antioxidant, estrogenic, and antiosteoporotic effects; consists of total isoflavon 1021.5-1084.3 µg/g52 | Reported for anti-inflammatory, antibacterial, immunomodulatory, antioxidant activity; antipyretic and laxative, with a high concentration of essential amino acids53,54 | Rich source of α-linolenic acid, soluble and insoluble fibers, phytoestrogenic lignans, and antioxidants. Reported for anti-inflammatory, antifungal, antithrombic function55; consists of 23 g of α-linolenic acid (per 100 g)56 and biological effect equivalent to 0.4 g of long-chain omega 3 fatty acids57 |
| Total per 100 g | Energy: ~400 kcala | Carbohydrate: ~40 ga (39% of total calories) | Protein: ~26 ga (26% of total calories) | Fat: ~16 ga (35% of total calories) | Total dietary fiber: ~14 gb |
| Iron: ~8 mga | Calcium: ~180 mga | Phosphorus: 338 mga | Vitamin A (carotene): 386 µga | Total folic acid: 67 µga |
Depending on the physical status of the patients, low levels of physical activity (walking and/or stairs) and participation in household activities was encouraged during counseling sessions.
Data Collection
Anthropometric measures, nutritional status, physical activity levels, and quality of life estimation were assessed at baseline, after 3 months, and at 6 months of recruitment for patients in both the groups by NK.
Anthropometric Parameters
Body weight was assessed using Tanita BC-545N segmental composition monitor (Tanita Corporation, Tokyo, Japan). Mid–upper -arm circumference (MUAC) was measured using a nonstretchable measuring tape. Four site skin fold thickness (SFT; ie, triceps, biceps, subscapular and suprailiac) was measured to the nearest 0.2 mm (Harpenden Skinfold Caliper, 0120, Baty International, West Sussex, England). The sum of 4 skinfolds was used to calculate body density. Body fat percentage was calculated using the Siri equation.23 All anthropometric measurements were taken by the same trained investigator throughout the study.
Nutritional Status Parameters
Dietary history was obtained during one-on-one interview sessions between the nutritionist and the patient. Two-day 24-hour dietary recall data were recorded using sample vessels of different sizes for portion size estimation. Additionally, the Indian Migrant Study Food Frequency Questionnaire (IMS-FFQ) consisting of 184 commonly consumed food items and validated among the rural and urban Indian population was used.24 Patients’ daily energy, carbohydrate, protein, and fat intake were calculated using IMS-FFQ and dietary recall data. Dietary data were analyzed using DietCal software (Dietary Assessment and Planning software based on the book Nutritive Value of Indian Foods).25 The Patient Generated Subjective Global Assessment (PG-SGA) questionnaire helped monitor the deterioration or improvement of patients’ nutritional status throughout the study. PG-SGA has been recommended as the nutrition assessment tool for cancer patients by the Oncology Nutrition Dietetic practice group of the American Dietetic Association.26
Physical Activity Level
The Indian Migrant Study Physical Activity Questionnaire (IMS-PAQ) was used to assess patients’ physical activity throughout the day.27 Patients reported every activity performed along with the average amount of time spent for each activity. Metabolic equivalent unit (MET) was assigned to each activity performed according to the Compendium of Physical activity.28 Thus, patients’ total daily energy expenditure was estimated.
Quality-of-Life Assessment
The EORTC-QLQ-C30 questionnaire, a validated tool, was used to analyze patients’ quality of life.29 A translated version in Hindi was available from the official website. The questionnaire consisted of 30 questions, which were divided into 5 functional scales—physical, role, cognitive, emotional, and social—8 symptom scales—fatigue, nausea and vomiting, pain, dyspnea, sleep disturbance, loss of appetite, constipation, and diarrhea— and global health and financial status. A score was calculated for all the 15 domains using the scoring manual.
Statistical Methods
Sample size calculations have been published earlier.8 The sample size for the pilot study was calculated considering similar baseline weight in the 2 groups. After 6 months of intervention, we expected a difference of approximately 10 kg of weight between the intervention group and control group. The study sample size was calculated as 72, with 36 patients per group, in order to study the impact of intervention. This sample size is chosen based on a CI (power) of 80% for allowable sample error (precision limit) of 5%. But because of a low recruitment rate, the study commenced with a total of 63 patients. All statistical analyses were done using SPSS software (version 20.0, SPSS Inc, Chicago, IL). Data were analyzed using repeated-measures ANOVA and the Friedman test followed by Bonferroni correction for multicomparisons to determine the changes within the groups at different time points. The Student t-test and Wilcoxon signed-rank test were conducted on the variables to assess the difference between intervention and control groups. Baseline parameters—body weight, body fat, MUAC, energy intake, physical activity level, global health quality of life, and fatigue domain—were adjusted to observe the overall difference between the groups using a generalized estimating equation. A P value ≤.05 was considered statistically significant.
The primary end points of this study were to improve patients’ anthropometric status and quality of life. Maintaining physical activity, nutritional status, and biochemical parameter assessments were among the secondary end points for this study.
Results
Patients’ baseline characteristics and tumor site have been detailed in Tables 2 and 3, respectively. Out of the 63 patients recruited for the study, 51% completed the intervention. There were no demographic or clinical differences among the patients who dropped out compared with the ones who finished the study. Data analysis was blinded because all data were collected using patient codes.
Table 2.
Tumor Site for the Recruited Study Patients.
| Site of Tumor | Intervention Group | Control Group |
|---|---|---|
| Ano-rectum | 3 | 2 |
| Bone | 1 | 2 |
| Brain | 0 | 1 |
| Breast | 7 | 7 |
| Buccal cavity | 1 | 1 |
| Chest wall | 1 | 1 |
| Eyelid | 0 | 1 |
| Female genitourinary tract | 12 | 10 |
| Lung | 2 | 4 |
| Olfactory | 1 | 0 |
| Spine | 1 | 0 |
| Suprarenal mass | 0 | 1 |
| Thyroid | 1 | 3 |
Table 3.
Baseline Characteristics of All Patients.a
| Baseline Parameters | Intervention Group (n = 30) | Control Group (n = 33) | P Value |
|---|---|---|---|
| Age (years) | 44.0 ± 13.2 | 47.8 ± 14.7 | .284 |
| Weight (kg) | 39.7 ± 5.7 | 41.1 ± 7.3 | .402 |
| MUAC (cm) | 20.8 ± 2.1 | 22.2 ± 2.4 | .49 |
| Body fat (%) | 20.5 ± 5.2 | 25.4 ± 6.5 | .012b |
| Energy intake (kcal) | 947.4 ± 327.9 | 756.7 ± 364.2 | .033b |
| Protein intake (g) | 30.3 ± 12.0 | 23.3 ± 12.6 | .03b |
| Fat intake (g) | 28.1±13.1 | 24.9 ± 14.9 | .375 |
| PG-SGA score | 7.8 ± 2.2 | 9.4 ± 2.6 | .010b |
| Global Health Status score (QoL) | 66.7 (16.7, 83.3) | 50 (8.3, 100) | .026b |
| Fatigue score (QoL) | 88.9 (0, 100) | 100 (0, 100) | .05b |
| Appetite loss score (QoL) | 66.7 (0, 100) | 100 (0, 100) | .047b |
Abbreviations: MUAC, mid–upper-arm circumference; PG-SGA, Patient-Generated Subjective Global Assessment; QoL, quality of life.
Data presented as mean ± SD or median (range).
Denotes P < .05.
Anthropometric Results
Patients in the intervention group had gained body weight, but this was not statistically significant (P = .081), whereas patients in the control group showed statistically significantly reduced body weight (P = .003) and MUAC (P = .006) at the end of 6 months (Figures 2 and 3). Body fat increased significantly in the intervention group (P = .002) and decreased significantly in the control group (P = .032) at the end of the 6-month intervention as compared with baseline (Figure 4). Adjusted analysis revealed significant difference in percentage body fat among the groups (P value = .001).
Figure 2.
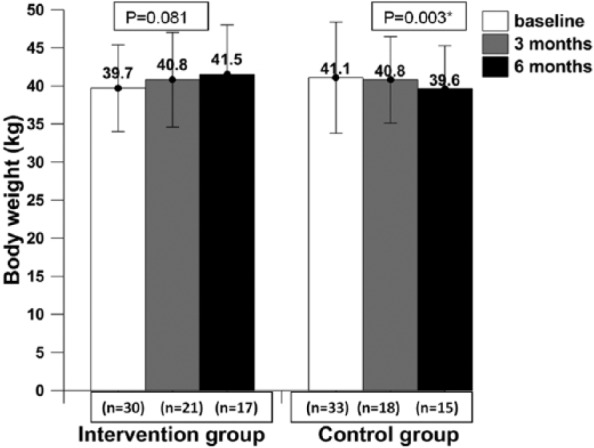
The body weight of patients at baseline, mid-intervention, and post-intervention.
* Data presented as mean ± SD; P value ≤.05 was considered statistically significant at 95% CI.
Figure 3.
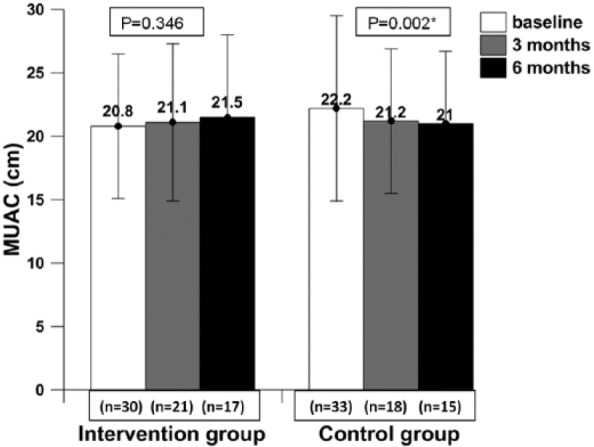
The mid–upper-arm circumference (MUAC) of patients at baseline, mid -intervention, and post- intervention.
* Data presented as mean ± SD; P value ≤.05 was considered statistically significant at 95% CI.
Figure 4.
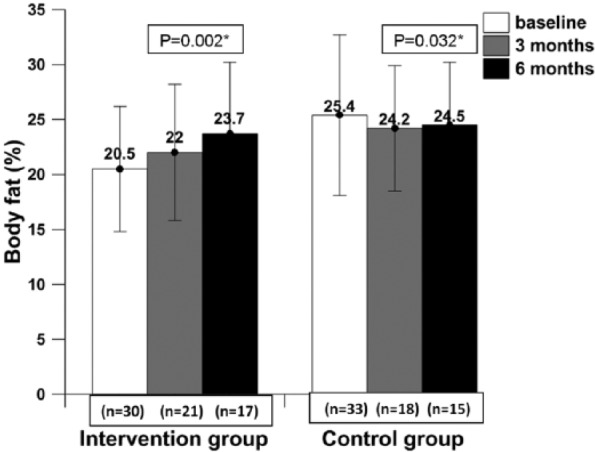
The body fat percentage of patients at baseline, mid-intervention, and post -intervention.
* Data presented as mean ± SD; P value ≤.05 was considered statistically significant at 95% CI.
Dietary Intake and Nutritional Status Results
At the end of 6 months, a significant increase in energy intake (P = .001) and macronutrient intake—that is, carbohydrate (P = .001), protein (P = .001), and fat (P = .006)—was observed in the intervention group (Table 4). Using the FFQ, intervention group patients also showed a statistically significant increase in energy intake (P = .006). The PG-SGA score for the intervention group improved at the end of the 6-month study (from baseline 7.8 ± 2.2 to 6.5 ± 3.1 at 6 months) but was not statistically significant (P = .735), whereas for the control group, the score did not change (from baseline 9.4 ± 2.6 to 9.5 ± 2.4 at 6 months, P = .863). On adjusting the baseline parameters there was a significant change in energy intake (P = .004, by dietary recall) and PG-SGA score (P < .001) during intervention.
Table 4.
Dietary Intake (according to 2-Day Dietary Recall) of Patients During Baseline, Follow-up at 3 Months and Post intervention.a
| Nutrient | Measurement Intervals | Intervention Group | Control Group | P Value |
|---|---|---|---|---|
| Energy by dietary recall (kcal) | Baseline | 947.4 ± 327.9 (n = 30) | 756.7 ± 364.2 (n = 33) | .033b |
| 3-Month intervention | 1284.4 ± 510.2 (n = 21) | 689.0 ± 388.5 (n = 18) | .003b | |
| 6-Month intervention | 1485.3 ± 477.4 (n = 17) | 803.0 ± 525.0 (n = 15) | .001b | |
| P value (overall) | .001b | .519 | ||
| Carbohydrate by dietary recall (g) | Baseline | 142.7 ± 50.5 (n = 30) | 109.1 ± 51.0 (n = 33) | .011b |
| 3-Month intervention | 178.2 ± 69.7 (n = 21) | 100.1 ± 46.3 (n = 18) | <.001b | |
| 6-Month intervention | 226.9 ± 81.1 (n = 17) | 123.0 ± 63.0 (n = 15) | <.001b | |
| P value (overall) | .001 | .519 | ||
| Protein by dietary recall (g) | Baseline | 30.3 ± 12.0 (n = 30) | 23.2 ± 12.6 (n = 33) | .03b |
| 3-Month intervention | 45.2 ± 16.1 (n = 21) | 22.2 ± 14.4 (n = 18) | <.001b | |
| 6-Month intervention | 49.5 ± 16.9 (n = 17) | 23.2 ± 15.6 (n = 15) | <.001b | |
| P value (overall) | .001b | .593 | ||
| Fat by dietary recall (g) | Baseline | 28.1 ± 13.1 (n = 30) | 24.9 ± 14.9 (n = 33) | .375 |
| 3-Month intervention | 43.5 ± 21.0 (n = 21) | 21.7 ± 17.4 (n = 18) | .001b | |
| 6-Month intervention | 42.8 ± 19.2 (n = 17) | 25.0 ± 28.6 (n = 15) | .046b | |
| P value (overall) | .006b | .881 |
Data presented as mean ± SD.
P value ≤.05 was considered statistically significant at 95% CI.
Physical Activity Results
Physical activity recall (Table 5) showed significantly reduced activity from 30.7 ± 2.7 METs at baseline to 28.0 ± 2.5 METs at 6 months (P = .004) among the control group, whereas the intervention group of patients maintained their physical activity levels throughout the study from 33.6 ± 3.9 METs at baseline to 31.9 ± 2.7 METs at 6 months (P = .274).
Table 5.
Physical Activity Levels of Patients During Baseline, Follow-up at 3 Months, and Post intervention.a
| Physical Activity (METs) | Measurement Intervals | Intervention Group | Control Group | P Value |
|---|---|---|---|---|
| Baseline | 33.6 ± 3.9 (n = 30) | 30.7 ± 2.7 (n = 33) | .01b | |
| 3-Month intervention | 33.2 ± 4.1 (n = 21) | 28.4 ± 2.5 (n = 18) | .007b | |
| 6-Month intervention | 31.9 ± 2.7 (n = 17) | 28.0 ± 2.5 (n = 15) | <.001b | |
| P Value (overall) | .274 | .004b |
Data presented as mean ± SD.
P value ≤.05 was considered statistically significant at 95% CI.
Quality-of-Life Results
Patients consuming IAtta showed significant improvement at 6 months in certain domains of quality of life (Table 6), such as fatigue (P = .002) and appetite loss (P = .006). A significant decrease in quality of life domains of global health status (P = .018) and social functioning (P = .004) was observed among control group patients at 6 months. Both the groups reported a significant improvement in pain at the end of 6 months (P = .012 in the intervention group, and P = .029 in control group). At the end of 6 months of the study period, there were significant differences (P < .001) between the intervention and control group patients in global health status, social functioning, appetite, and fatigue domains. When global health status and fatigue score were adjusted at baseline, there was a significant difference in these parameters during the intervention at 3 and 6 months (P < .001).
Table 6.
Selected QoL Domain Scores of Patients During Baseline, Follow-up at 3 Months, and Post-intervention.a
| Domain | Measurement Intervals | Intervention Group | Control Group | P Value |
|---|---|---|---|---|
| Global health status | Baseline | 66.7 (16.7, 83.3), n = 30 | 50 (8.3, 100), n = 33 | .026b |
| 3-Month intervention | 66.6 (16.7, 83.3), n = 21 | 41.7 (0, 66.6), n = 18 | .001b | |
| 6-Month intervention | 66.7 (16.7, 83.3), n = 17 | 16.7 (0, 50), n = 15 | <.001b | |
| P Value (overall) | .985 | .018b | ||
| Social functioning | Baseline | 66.7 (0, 100), n = 30 | 50 (0, 100), n = 33 | .02b |
| 3-Month intervention | 66.6 (0, 100), n = 21 | 0 (0, 100), n = 18 | .002b | |
| 6-Month intervention | 66.7 (16.7, 100), n = 17 | 0 (0, 100), n = 15 | <.001b | |
| P value (overall) | 0.802 | 0.004b | ||
| Fatigue | Baseline | 88.9 (0, 100), n = 30 | 100 (0, 100), n = 33 | .05b |
| 3-Month intervention | 55.5 (0, 100), n = 21 | 100 (66.7, 100), n = 18 | <.001b | |
| 6-Month intervention | 66.7 (0, 100), n = 17 | 100 (66.7, 100), n = 15 | <.001b | |
| P value (overall) | .002b | .819 | ||
| Pain | Baseline | 75.0 (0, 100), n = 30 | 100 (16.67, 100), n = 33 | .017b |
| 3-Month intervention | 33.3 (0, 100), n = 21 | 100 (16.7, 100), n = 18 | <.001b | |
| 6-Month intervention | 16.7 (0, 100), n = 17 | 33.3 (0, 100), n = 15 | .129 | |
| P value (overall) | .012b | .029b | ||
| Appetite loss | Baseline | 66.7 (0, 100), n = 30 | 100 (0, 100), n = 33 | .047b |
| 3-Month intervention | 0 (0, 100), n = 21 | 100 (0, 100), n = 18 | <.001b | |
| 6-Month intervention | 0 (0, 100), n = 17 | 100 (0, 100), n = 15 | .001b | |
| P value (overall) | .006b | .676 |
Abbreviation: QoL, quality of life.
Data presented as median (range).
A P value ≤.05 was considered statistically significant at a 95% CI.
The mean consumption of IAtta flour (as chapatis) among the patients who finished the study was 45 ± 11.26 g/d, providing them 180 kcal/d, consisting of 20 g of carbohydrate, 11 g of protein, and 6 g of fat (see Table 4 for more details). None of the patients reported any side effects of consuming IAtta chapatis.
Discussion
In the current study, IAtta meal supplementation along with nutritional counseling in female patients with advanced cancer receiving palliative care improved their quality of life and stabilized body weight.
Patients consuming IAtta for the duration of 6 months showed clinically increased body weight (increase in body weight by 2.5%; P = .081) and body fat percentage (increased by 3.7%; P = .002) in contrast to the control group, who showed significantly reduced body weight (decreased by 8.71%; P = .003) and body fat percentage (decreased by 5.2%; P = .032). The increase in body fat would be desirable in cachexic patients. Also, in this study, patients in the control group had a reduction of 14.4% of MUAC (P = .002) at 6 months as compared with baseline. Low MUAC (between 22 and 24 cm) among adults has been associated with several adverse health outcomes,30 and all current study patients (in both groups) at baseline had MUAC less than 23 mm, which is associated with a higher health risk. A recent observational study has concluded that significant weight loss in patients with advanced cancer is associated with reduced survival.31 Weight-losing cancer patients have shown reduced mobility, immunity, and chemotherapy endurance.32,33 A similar pattern has been documented earlier in cancer patients when their diets were supplemented with ONS.34,35 However, a recent meta-analysis by Baldwin et al,9 which included 13 RCTs involving malnourished cancer patients, concluded that there was no statistically significant relationship between synthetic ONS intervention and body weight gain. The baseline characteristic of most of the anthropometric indicators (body weight and MUAC) was similar in both the patient groups (except body fat); therefore, we can argue that IAtta has a significant impact on patients’ health status (Table 3).
The energy intake of all study patients at baseline was lower than the Indian adult female RDA (<1900 kcal, Table 2).22 Research has shown that with disease progression, basal metabolic rate increases.36,37 Therefore, the energy intake of patients should be higher in order to maintain their nutritional status. A significant difference was observed in the baseline energy and protein intake of both groups of patients. Dietary intake was assessed using self-reported questionnaires. Data collected from these tools are subject to reporting errors.38 Whereas patients in the control group reported lower baseline energy (756.7 ± 364.2 kcal) and protein (23.2 ± 12.6 g) intake, their body fat was 25.4% ± 6.5 % higher compared with that of the intervention group (20.5% ± 5.2%). Also, the baseline body weight and MUAC were comparable between the 2 groups. The intervention patients reported a significant increase in their daily energy, protein, and fat intake at the end of the intervention, which was greater than 40 g of IAtta average consumption. The key reason could be a significant improvement in appetite, reduced fatigue (QoL domain assessed in Table 6), and maintenance of normal physical activity (Table 5) along with cumulative positive effect of IAtta natural ingredients. IAtta possibly had a positive impact on their health status and well-being (Table 6), despite progression of the neoplastic disease, which improved their appetite. There was no significant change in the PG-SGA score of the intervention group patients at the end of intervention, which is similar to the pattern observed earlier in advanced colorectal cancer patients receiving ONS supplementation.39
In a recent study on weight-losing advanced cancer patients, it was shown that along with weight loss and lower MUAC, these patients had reduced functional abilities.40 In advanced lung cancer patients, it has been suggested that an exercise and nutrition intervention may have a positive impact on unintentional weight loss and physical function.41 The current study results are in line with those of the above studies because patients consuming IAtta maintained their body weight as well as physical activity levels. Also, patients losing body weight (control group) showed reduced physical activity levels (baseline, 30.7 ± 2.7 METs; 6 months, 28.0 ± 2.5 METs) at the end of the study period. There is a statistically significant positive correlation between physical activity and quality of life.42 Though both the groups received physical activity counseling in the current study, the key factor for maintained physical activity in the intervention group could be consumption of nutrient-rich IAtta, compensating for the macronutrient and micronutrient deficits in their diets.
The global health status and emotional functioning domain under the functional scale and loss of appetite and dyspnea domains under the symptom scale showed association with ONS intake in malnourished cancer patients.9 Observations on malnourished cancer patients suggest a decline in quality of life with body weight loss.40,43 A similar trend was observed in this study: patients consuming IAtta exhibited improvement in fatigue and appetite loss domains, whereas weight-losing control group patients declined under the global health status (P = .018) and social functioning (P = .004) domains. Patients in the intervention group received counseling and IAtta, which could have helped in reducing fatigue and improving appetite levels.
Limitations
One weakness of the study was the patient drop-out rate: as result of progressive disease, 29% were unable to travel to the hospital, and 21% had an early death. Attrition rate as high as 45% has been reported in palliative oncology trials because of clinical deterioration and morbidity among patients.44,45 Patients belonging to all socioeconomic strata were included in the study, and therefore, our population was mixed. We were not able to observe a specific pattern in their food habits throughout the intervention. Therefore, dietary intake was significantly different between groups at baseline. This could not be a bias because concealment and randomization was practiced throughout the study. A homogeneous group of female cancer patients was recruited for the study because there were no existing data available to report impact of natural food supplementation on patient nutrition status in the palliative care setting. Research is needed to study the impact of IAtta supplementation in organ-specific cancer palliative care patients. Like other supplementation studies in the past on advanced cancer patients, the intervention group patients were unable to consume the advised amount of IAtta (compliance rate of 41%).39,46,47 The key reasons reported were anorexia, appetite loss, mouth sores, and constipation as a result of palliative chemoradiotherapy (for symptom management), toxicity complications, and medications. The patients recruited for this study were free-living and consuming the IAtta meal at home with their family. The subsequent body weight gain of 2.5% in the intervention group patients proves that they were consuming the meal themselves and not sharing it. Another weakness of this study was the inability to assess patients’ fat-free mass. Though a Tanita segmental body composition machine was used to determine muscle mass, it was a challenge to maintain patient hydration status and environmental conditions during each visit; therefore, the variable was excluded. The machine works on the principle of bioelectric impedance and values depend on patient hydration status.48 Total body water content was comparable between patient groups at baseline, mid-intervention, and post-intervention (P = .453, P = .234, and P = .727, respectively), as measured by the Tanita segmental body composition machine. Therefore, the change in SFT was attributed to nutritional intake and not to lymphadenopathy, ascites, and hydration status in the intervention group patients. The observed reduction in MUAC and bicep, tricep, suprailliac, and suprascapular SFT among control group patients is a clear indicator of loss of skeletal muscle mass in cachexic patients, implying poor prognosis.49
Conclusion
Nutrition is an essential component of a multimodal cachexia treatment, and it is not feasible to increase or maintain patients’ body weight if nutritional demands are neglected. Embedding nutrition supplementation within the palliative care therapy may improve quality of life and stabilize body weight in cancer cachexia patients. A large-scale intervention to further establish the effectiveness of IAtta on patients’ quality of life and their health status is highly desirable.
Acknowledgments
The research team gratefully acknowledges the assistance of doctors and hospital support staff at AIIMS, New Delhi, India. Special thanks to Dr R. M. Pandey and Vineet Kamal at the Department of Biostatistics, AIIMS, for their guidance throughout the project. We thank the administrative team at Indian Council of Medical Research for their guidance in obtaining ethical clearance from the Indian Health Ministry. A special thanks to all the study patients for their cooperation and time throughout the study.
Footnotes
Authors’ Note: This study is registered on http://www.clinicaltrials.gov vide, identifier no. NCT02350855.
Declaration of Conflicting Interests: The author(s) declared no potential conflicts of interest with respect to the research, authorship, and/or publication of this article.
Funding: The author(s) disclosed receipt of the following financial support for the research, authorship, and/or publication of this article: The study was self-funded by NK (study investigator).
References
- 1. Aapro M, Arends J, Bozzetti F, et al. Early recognition of malnutrition and cachexia in the cancer patient: a position paper of a European School of Oncology Task Force. Ann Oncol. 2014;25:1492-1499. [DOI] [PubMed] [Google Scholar]
- 2. von Haehling S, Anker SD. Cachexia as a major underestimated and unmet medical need: facts and numbers. J Cachexia Sarcopenia Muscle. 2010;1:1-5. [DOI] [PMC free article] [PubMed] [Google Scholar]
- 3. Fearon K, Strasser F, Anker SD, et al. Definition and classification of cancer cachexia: an international consensus. Lancet Oncol. 2011;12:489-495. [DOI] [PubMed] [Google Scholar]
- 4. Radbruch L, Elsner F, Trottenberg P, Strasser F, Fearon K. Clinical Practice Guidelines on Cancer Cachexia in Advanced Cancer Patients With a Focus on Refractory Cachexia. Aachen, Germany: Department of Palliative Medicinen/European Palliative Care Research Collaborative; http://www.epcrc.org/getpublication2.php?id=ternkkdsszelxevzgtkb. Accessed March 10, 2016. [Google Scholar]
- 5. Bauer JD, Ash S, Davidson WL, et al. Evidence based practice guidelines for the nutritional management of cancer cachexia. Nutr Diet. 2006;63(suppl 2):S3-S32. [Google Scholar]
- 6. Senesse P, Bachmann P, Bensadoun RJ, et al. Clinical nutrition guidelines of the French speaking society of clinical nutrition and metabolism (SFNEP): summary of recommendations for adults undergoing non-surgical anticancer treatment. Dig Liver Dis. 2014;46:667-674. [DOI] [PubMed] [Google Scholar]
- 7. Suhag V, Bs S, Singh A, et al. The oncology scenario in India: lots of gaps. Glob J Med Res. 2015;15(2). [Google Scholar]
- 8. Mallath MK, Taylor DG, Badwe RA, et al. The growing burden of cancer in India: epidemiology and social context. Lancet Oncol. 2014;15:e205-e212. [DOI] [PubMed] [Google Scholar]
- 9. Baldwin C, Spiro A, Ahern R, Emery PW. Oral nutritional interventions in malnourished patients with cancer: a systematic review and meta-analysis. J Natl Cancer Inst. 2012;104:371-385. [DOI] [PubMed] [Google Scholar]
- 10. Kapoor N, Naufahu J, Tewfik S, Bhatnagar S, Garg R, Tewfik I. A public health nutrition intervention to delay the progression of cachexia to refractory cachexia in indian female cancer patients: a conceptual framework. Int J Food Nutr Public Health. 2014;7:1-11. [Google Scholar]
- 11. Ravasco P, Monteiro-Grillo I, Camilo M. Individualized nutrition intervention is of major benefit to colorectal cancer patients: long-term follow-up of a randomized controlled trial of. Am J Clin Nutr. 2012;96:1346-1353. [DOI] [PubMed] [Google Scholar]
- 12. Kiss NK, Krishnasamy M, Isenring E. The effect of nutrition intervention in lung cancer patients undergoing chemotherapy and/or radiotherapy: a systematic review. Nutr Cancer. 2014;66:47-56. [DOI] [PubMed] [Google Scholar]
- 13. Balasubramaniyan N, Subramanian S, Sekar N, Bhuvarahamurthy V, Govindasamy S. Involvement of plasma copper, zinc and cadmium in human carcinoma of uterine cervix. Med Oncol. 1994;11:147-148. [DOI] [PubMed] [Google Scholar]
- 14. Goyal MM, Kalwar AK, Vyas RK, Bhati A. A study of serum zinc, selenium and copper levels in carcinoma of esophagus patients. Indian J Clin Biochem. 2006;21:208-210. [DOI] [PMC free article] [PubMed] [Google Scholar]
- 15. Naidu M, Suryakar A, Swami S, Katkam R, Kumbar K. Oxidative stress and antioxidant status in cervical cancer patients. Indian J Clin Biochem. 2007;22:140-144. [DOI] [PMC free article] [PubMed] [Google Scholar]
- 16. Singh P, Kapil U, Shukla N, Deo S, Dwivedi S. Association between breast cancer and vitamin C, vitamin E and selenium levels: results of a case-control study in India. Asian Pac J Cancer Prev. 2005;6:177-180. [PubMed] [Google Scholar]
- 17. Kumar NB, Kazi A, Smith T, et al. Cancer cachexia: traditional therapies and novel molecular mechanism-based approaches to treatment. Curr Treat Options Oncol. 2010;11:107-117. [DOI] [PMC free article] [PubMed] [Google Scholar]
- 18. Thoresen L, Fjeldstad I, Krogstad K, Kaasa S, Falkmer U. Nutritional status of patients with advanced cancer: the value of using the subjective global assessment of nutritional status as a screening tool. Palliat Med. 2002;16:33-42. [DOI] [PubMed] [Google Scholar]
- 19. Aloia CR, Gasevic D, Yusuf S, et al. Differences in perceptions and fast food eating behaviours between Indians living in high- and low-income neighbourhoods of Chandigarh, India. Nutr J. 2013;12:4. [DOI] [PMC free article] [PubMed] [Google Scholar]
- 20. Ruel MT, Alderman H. Nutrition-sensitive interventions and programmes: how can they help to accelerate progress in improving maternal and child nutrition? Lancet. 2013;382:536-551. [DOI] [PubMed] [Google Scholar]
- 21. Bansal D, Satija A, Khandpur N, et al. Effects of migration on food consumption patterns in a sample of Indian factory workers and their families. Public Health Nutr. 2010;13:1982-1989. [DOI] [PubMed] [Google Scholar]
- 22. Indian Council of Medical Research. Nutrient requirements and recommended dietary allowances for Indians. http://icmr.nic.in/final/RDA-2010.pdf. Accessed March 10, 2016. [DOI] [PMC free article] [PubMed]
- 23. Durnin J, Womersley J. Body fat assessed from total body density and its estimation from skinfold thickness: measurements on 481 men and women aged from 16 to 72 years. Br J Nutr. 1973;32:77-97. [DOI] [PubMed] [Google Scholar]
- 24. Satija A, Taylor F, Khurana S. Differences in consumption of food items between obese and normal-weight people in India. Natl Med J India. 2012;25:10-13. [PubMed] [Google Scholar]
- 25. Gopalan C, Rama Sastri BV, Balasubramanian SC. Nutritive Value of Indian Foods. Hyderabad, India: National Institute of Nutrition, Indian Council of Medical Research; 1989. [Google Scholar]
- 26. Ottery F. Patient-generated subjective global assessment. In: McCallum P, Polisena C, eds. The Clinical Guide to Oncology Nutrition. Chicago, IL: American Dietetic Association; 2000:11-23. [Google Scholar]
- 27. Sullivan R, Kinra S, Ekelund U, et al. Evaluation of the Indian Migration Study Physical Activity Questionnaire (IMS-PAQ): a cross-sectional study. Int J Behav Nutr Phys Act. 2012;9:13. [DOI] [PMC free article] [PubMed] [Google Scholar]
- 28. Ainsworth BE, Haskell WL, Herrmann SD, et al. 2011 Compendium of physical activities: a second update of codes and MET values. Med Sci Sports Exerc. 2011;43:1575-1581. [DOI] [PubMed] [Google Scholar]
- 29. Fayers P, Aaronson N, Bjordal K, Groenvold M, Curran D, Bottomley A. EORTC Quality of Life Group: The EORTC QLQ-C30 Scoring Manual. 3rd ed. Brussels, Belgium: European Organisation for Research and Treatment of Cancer; 2001. [Google Scholar]
- 30. Tang AM, Dong K, Deitchler M, et al. Use of Cutoffs for Mid-Upper Arm Circumference (MUAC) as an Indicator or Predictor of Nutritional and Health- Related Outcomes in Adolescents and Adults: A Systematic Review. Washington, DC: Food and Nutrition Technical Assistance; 2013. [Google Scholar]
- 31. Solheim TS, Blum D, Fayers PM, et al. Weight loss, appetite loss and food intake in cancer patients with cancer cachexia: three peas in a pod? Analysis from a multicenter cross sectional study. Acta Oncol. 2014;53:539-546. [DOI] [PubMed] [Google Scholar]
- 32. MacDonald N, Easson AM, Mazurak VC, Dunn GP, Baracos VE. Understanding and managing cancer cachexia. J Am Coll Surg. 2003;197:143-161. [DOI] [PubMed] [Google Scholar]
- 33. Theologides A. Cancer cachexia. Cancer. 1979;43(5, suppl):2004-2012. [DOI] [PubMed] [Google Scholar]
- 34. Paccagnella A, Morello M, Da Mosto MC, et al. Early nutritional intervention improves treatment tolerance and outcomes in head and neck cancer patients undergoing concurrent chemoradiotherapy. Support Care Cancer. 2010;18:837-845. [DOI] [PubMed] [Google Scholar]
- 35. Yeh K-Y, Wang H-M, Chang JW-C, et al. Omega-3 fatty acid-, micronutrient-, and probiotic-enriched nutrition helps body weight stabilization in head and neck cancer cachexia. Oral Surg Oral Med Oral Pathol Oral Radiol. 2013;116:41-48. [DOI] [PubMed] [Google Scholar]
- 36. Young VR. Energy metabolism and requirements in the cancer patient. Cancer Res. 1977;37:2336-2347. [PubMed] [Google Scholar]
- 37. Dhanapal R, Saraswathi T, Rajkumar N. Cancer cachexia. J Oral Maxillofac Pathol. 2011;15:257-260. [DOI] [PMC free article] [PubMed] [Google Scholar]
- 38. Thompson FE, Subar AF. Dietary assessment methodology. In: Coulston AM, Boushey CJ, Ferruzzi M, eds. Nutrition in the Prevention and Treatment of Disease. 3rd ed. San Diego, CA: Academic Press; 2013:3-40. [Google Scholar]
- 39. Read JA, Beale PJ, Volker DH, Smith N, Childs A, Clarke SJ. Nutrition intervention using an eicosapentaenoic acid (EPA)-containing supplement in patients with advanced colorectal cancer: effects on nutritional and inflammatory status: a phase II trial. Support Care Cancer. 2007;15:301-307. [DOI] [PubMed] [Google Scholar]
- 40. Wallengren O, Lundholm K, Bosaeus I. Diagnostic criteria of cancer cachexia: relation to quality of life, exercise capacity and survival in unselected palliative care patients. Support Care Cancer. 2013;21:1569-1577. [DOI] [PubMed] [Google Scholar]
- 41. Payne C, Larkin PJ, McIlfatrick S, Dunwoody L, Gracey JH. Exercise and nutrition interventions in advanced lung cancer: a systematic review. Curr Oncol. 2013;20:e321-e337. [DOI] [PMC free article] [PubMed] [Google Scholar]
- 42. Oechsle K, Jensen W, Schmidt T, et al. Physical activity, quality of life, and the interest in physical exercise programs in patients undergoing palliative chemotherapy. Support Care Cancer. 2011;19:613-619. [DOI] [PubMed] [Google Scholar]
- 43. Thoresen L, Frykholm G, Lydersen S, et al. The association of nutritional assessment criteria with health-related quality of life in patients with advanced colorectal carcinoma. Eur J Cancer Care (Engl). 2012;21:505-516. [DOI] [PubMed] [Google Scholar]
- 44. Hui D, Glitza I, Chisholm G, Yennu S, Bruera E. Attrition rates, reasons and predictive factors in supportive and palliative oncology clinical trials. Cancer. 2013;119:1098-1105. [DOI] [PMC free article] [PubMed] [Google Scholar]
- 45. Visser C, Hadley G, Wee B. Reality of evidence-based practice in palliative care. Cancer Biol Med. 2015;12:193-200. [DOI] [PMC free article] [PubMed] [Google Scholar]
- 46. Baldwin C, Spiro A, McGough C, et al. Simple nutritional intervention in patients with advanced cancers of the gastrointestinal tract, non-small cell lung cancers or mesothelioma and weight loss receiving chemotherapy: a randomised controlled trial. J Hum Nutr Diet. 2011;24:431-440. [DOI] [PubMed] [Google Scholar]
- 47. Trabal J, Leyes P, Forga M, Maurel J. Potential usefulness of an EPA-enriched nutritional supplement on chemotherapy tolerability in cancer patients without overt malnutrition. Nutr Hosp. 2010;25:736-740. [PubMed] [Google Scholar]
- 48. Dehghan M, Merchant AT. Is bioelectrical impedance accurate for use in large epidemiological studies? Nutr J. 2008;7:26. [DOI] [PMC free article] [PubMed] [Google Scholar]
- 49. Letilovic T, Vrhovac R. Influence of additional criteria from a definition of cachexia on its prevalence: good or bad thing? Eur J Clin Nutr. 2013;67:797-801. [DOI] [PubMed] [Google Scholar]
- 50. Jukanti AK, Gaur PM, Gowda CLL, Chibbar RN. Nutritional quality and health benefits of chickpea (Cicer arietinum L): a review. Br J Nutr. 2012;108(suppl 1):11-26. [DOI] [PubMed] [Google Scholar]
- 51. Arena MP, Caggianiello G, Fiocco D, et al. Barley β-glucans-containing food enhances probiotic performances of beneficial bacteria. Int J Mol Sci. 2014;15:3025-3039. [DOI] [PMC free article] [PubMed] [Google Scholar]
- 52. Kumar V, Rani A, Dixit AK, Bhatnagar D, Chauhan GS. Relative changes in tocopherols, isoflavones, total phenolic content, and antioxidative activity in soybean seeds at different reproductive stages. J Agric Food Chem. 2009;57:2705-2710. [DOI] [PubMed] [Google Scholar]
- 53. Tanmoy G, Arijit M, Tanushree S, Jagadish S, Kumar MT. Pharmacological actions and phytoconstituents of Amaranthus spinosus Linn: a review. Int J Pharmacogn Phytochem Res. 2014;6:405-413. [Google Scholar]
- 54. Kumar BSA, Lakshman K, Jayaveera KN, Shekar DS, Kumar AA, Manoj B. Antioxidant and antipyretic properties of methanolic extract of Amaranthus spinosus leaves. Asian Pac J Trop Med. 2010;3:702-706. [Google Scholar]
- 55. Goyal A, Sharma V, Upadhyay N, Gill S, Sihag M. Flax and flaxseed oil: an ancient medicine and modern functional food. J Food Sci Technol. 2014;51:1633-1653. [DOI] [PMC free article] [PubMed] [Google Scholar]
- 56. Morris DH. Food Sources of Alpha-Linolenic Acid. Winnipeg, MB, Canada: Flax Council of Canada; http://flaxcouncil.ca/wp-content/uploads/2015/03/Flax_FSht_FoodSourc08_R2.pdf. Accessed March 9, 2016. [Google Scholar]
- 57. Rodriguez-Leyva D, Dupasquier CMC, McCullough R, Pierce GN. The cardiovascular effects of flaxseed and its omega-3 fatty acid, alpha-linolenic acid. Can J Cardiol. 2010;26:489-496. [DOI] [PMC free article] [PubMed] [Google Scholar]
- 58. United States Department of Agriculture. National nutrient database for Standard Reference Release 28. https://ndb.nal.usda.gov/ndb/foods?qlookup=&fgcd=&manu=&SYNCHRONIZER_TOKEN=04b6b08d-427c-4b9d-b1db-aee78e72ae75&SYNCHRONIZER_URI=%2Fndb%2Ffoods. Accessed March 9, 2016.