Abstract
Background:
Circadian regulation of sleep, cognition, and metabolic state is driven by a central clock, which is in turn entrained by environmental signals. Understanding the circadian regulation of mood, which is vital for coping with day-to-day needs, requires large datasets and has classically utilised subjective reporting.
Methods:
In this study, we use a massive dataset of over 800 million Twitter messages collected over 4 years in the United Kingdom. We extract robust signals of the changes that happened during the course of the day in the collective expression of emotions and fatigue. We use methods of statistical analysis and Fourier analysis to identify periodic structures, extrema, change-points, and compare the stability of these events across seasons and weekends.
Results:
We reveal strong, but different, circadian patterns for positive and negative moods. The cycles of fatigue and anger appear remarkably stable across seasons and weekend/weekday boundaries. Positive mood and sadness interact more in response to these changing conditions. Anger and, to a lower extent, fatigue show a pattern that inversely mirrors the known circadian variation of plasma cortisol concentrations. Most quantities show a strong inflexion in the morning.
Conclusion:
Since circadian rhythm and sleep disorders have been reported across the whole spectrum of mood disorders, we suggest that analysis of social media could provide a valuable resource to the understanding of mental disorder.
Keywords: Circadian rhythms and sleep, emotion, computational neuroscience, human behaviour
Introduction
The predictable rhythm of the 24-h solar cycle has, over the last three billion years of life on this planet, allowed living things as diverse as bacteria, plants, and animals to adapt their internal chemistry and physiology to enable them to anticipate the daily changes in their environment. They have achieved this by the development of internal clocks which are synchronised by external time signals. Mammals have evolved a master pacemaker in the suprachiasmatic nucleus (SCN) of the hypothalamus (Welsh et al., 1995), with weaker local clocks in individual tissues (Kyriacou and Hastings, 2010). The major environmental synchronisation of the SCN is the light change at dawn and dusk, which is detected by melanopsin containing ganglion cells in the retina which project to the SCN (Hughes et al., 2013). Understanding the interactions between photic signals, seasons, and mood is an important task as light has powerful effects on multiple brain areas involved in attention and cognitive function, regulates melatonin secretion, and entrains circadian rhythmicity (Lucas et al., 1999). Indeed manipulation of these responses by the use of light therapy can alter mood in seasonal affective disorder (Wirz-Justice et al., 1993).
One of the important aspects of human psychology that is regulated in a circadian manner is mood. This affective state is critically important for achieving the goals that determine the success of day-to-day existence and shows a complex hierarchy of positive and negative mood ratings which appear to remain independent across a wide range of conditions (Watson and Clark, 1997). One of the factors that seems to modulate this circadian variation is different chronotypes (Miller et al., 2015). Assessment of affect has classically been performed by the use of retrospective questionnaires with all their associated problems including self-reporting and recall bias (Broome et al., 2015). The difficulty when studies are performed on a large scale and over long periods of time resides in the data collection and the sampling frequency. They do however suggest that positive affect (PA) has an endogenous circadian rhythm (Boivin et al., 1997; Murray et al., 2009) which is probably a net result of the interaction between circadian phase and duration of prior wakefulness. However, there have been inconsistent results for negative affect (Miller et al., 2015), possibly related to inadequate sample size.
Previous studies have proposed to extract indicators of mood from Twitter data (Golder and Macy, 2011; Lampos et al., 2013) to overcome the sampling frequency, sampling size, and recall bias of the questionnaire-based studies. They have consistently detected periodic behaviour in the 24-h cycle, in particular, they both found that the general mood starts good in the morning and gradually declines during the day. Golder and Macy (2011) also noted two important resurgences in the positive mood during the 24-h cycle and found seasonal volume variation in positive mood that correlate with increased day length.
In this study, we expand upon those previous works, using a larger dataset, collected over a longer time interval from a narrower geographic area. We also use refined methods of analysis and robust mood indicators. We find circadian patterns that are compatible with previous observations, confirming that positive and negative emotions are periodic quantities independent of each other (Golder and Macy, 2011), details are discussed in section ‘Conclusion’. We believe this study is the first to decompose the spectrum of negative emotions into anger and sadness and to compare with fatigue. We show that the circadian variations in anger and fatigue are stable across seasons and weekend boundaries, while the variations in positive emotions and sadness are more variable in response to these changing environmental conditions.
Materials and methods
The time series we analyse are produced by computing mood indicators on text collected from Twitter in the United Kingdom over the course of 4 years. The methods of data collection and of computation of the indicators are described below.
Data
Twitter contents from the 54 largest towns and cities in the United Kingdom were sampled every 10 min, each time retrieving the 100 most recent tweets and then removing any duplicates from the previous iterations. The tweets were then aggregated by hour, so to have 24 data points per day in each city. Due to collection problems, we have removed from our collection the year 2012 and the months of November and December 2014. For this study, we have aggregated the contents of all locations. As a result, we have 800 million individual tweets and 33,576 time points, covering the time intervals between 01 January 2010 and 31 October 2014. The data being anonymised at the time of collection, one drawback of studying mood variations in a large and anonymised set of Twitter users is that we cannot distinguish users by chronotypes or count the number of individual users. This is required from our user privacy policy but implies that we cannot account for the likely changes in population that occur between night and day as suggested by the total word volume variation within the 24 h (Figure 1) or separate the variation due to population changes from that due to mood changes in the same individuals. This was instead attempted in Golder and Macy (2011), which distinguished between ‘night owls’, users mostly active at nights, and other chronotypes. This study also reported an apparent change of population from more ‘technically oriented’ to more mainstream users. In this study, we expect our samples collected in latter stages of development of the platform to be representative of a more general population, and our samples of hourly expressions were collected under the same conditions in each season and in each day of the week.
Figure 1.
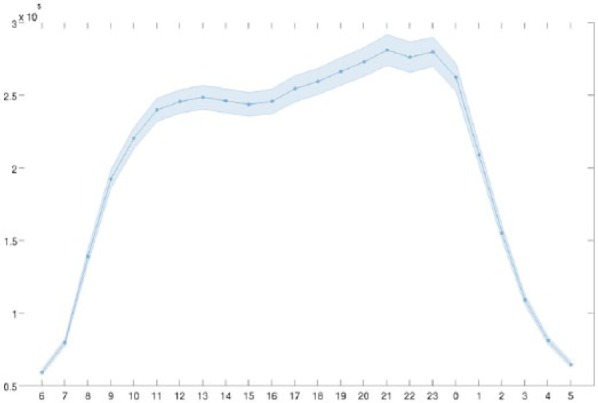
Word volume variation within the 24-h cycle, with 99% confidence interval. The y-axis represents the average volume per hour in the top 20,000 most frequent words across the 4 years.
Greeting messages
The signal about mood could be skewed by the presence of large amounts of standardised greeting messages in specific seasons, which make use of mood-related words, while not expressing the mood of the writer. We automatically removed messages containing standard holiday greetings as follows: we ignored any post containing the word happy, merry, good, lovely, nice, great, or wonderful followed by christmas, halloween, valentine, easter, new year, motherday, fatherday, and their variants (e.g. starting with a leading # or separated by a dash, a space or ending with ’s when applicable). We verified that posts matching this pattern were indeed concentrated in very specific days, the expected ones for each holiday.
Time series preprocessing
We compute the time series of relative frequency of individual words in each hour of the 4 years under study. We first improve our estimates of the frequency at each time point by smoothing it with the corresponding estimates at seven days distance, preceding and following. This ensures that we do not introduce any artefacts in our analysis of hourly or day-of-week comparisons, while still keeping the hourly differences. We then express this frequency relatively to the total volume of the top 100 k most frequent words occurring on the social platform at these times. Now, since the frequency can be very different and incomparable across words, word-count-based scores cannot provide absolute measures to quantify the strength of an emotion in a given corpus. Therefore, to facilitate comparisons, in this study, we only perform relative measures: each time series reflecting an emotion or fatigue is always rescaled and compared to its average value. Here, we standardise the time series of each word individually so that each day receives zero mean and unit standard deviation. This standardisation procedure incorporates our observation, directly rescaling the time series of a word in terms of its intraday z-scores. The procedure also accounts for the seasonal change in the baseline volume of mood words in Twitter (Dzogang et al., 2016) and leaves for each word the signal of relative changes in the relative frequency within the 24-h cycle.
Mood indicators
Each of our indicators of emotions and fatigue is the average time series across the words in a given list. The Linguistic Inquiry and Word Count (LIWC) lists of words are widely used in social psychology in order to measure various types of emotions in a text (Pennebaker et al., 2001; Tausczik and Pennebaker, 2010). We have used these lists to create indicators of the mood in Twitter: from LIWC, 2043 words were extracted for the positive emotions (posemo), 414 for sadness, and 956 for anger. We have also created an indicator of fatigue based on the positive and negative affect schedule (PANAS) self-report questionnaire (Watson and Clark, 1999), formed by just four words. Again, since the frequency of these words in any natural language corpus is determined by the Zipf’s law (Piantadosi, 2014), two problems arise: a sum of the raw counts of all words in a list would reflect just changes in the top most frequent words, while at the same time, an estimation of relative frequency for the long tail of low-frequency words would be affected by a high estimation error. Our standardisation strategy (see section ‘Time series preprocessing’) copes with the former issue and ensures that changes in our indicators can only emerge from the coordinated change of several words, across several days. We addressed the second issue by selecting the 50% most frequent words in each list after observing that their total word occurrences accounted for 99% of all word occurrences in each case. Formed that way our indicators are robust signals of the changes that happened during the course of the day, in the collective expression of emotions and fatigue, sampled from millions of tweets.
Data availability
The raw data necessary for repeating this analysis will be made freely available, in the form of the hourly raw-count time series of the frequency for each of the words included in the LIWC and PANAS lists and total number of word occurrences for each hour of the time interval.
Data analysis plan
Given a numeric time series, we want to analyse various aspects of its temporal structure. We demonstrate these methods on single words (e.g. breakfast or sunrise) and then we apply the approach to the complex signals generated by the emotions. One key data analysis tool is the heatmap, which we use to visualise how the daily profiles change across the year. The heatmap is a table of size 12 × 24, each cell representing the average value of a quantity at a given hour of the day and month of the year, which allows the comparison of the daily cycles through the year. On the heatmap, we also visualise daily events such as sunrise and see how the circadian structure changes across the year. We make use of various statistical tests, in particular, to detect (1) periodic structure in a time series, (2) extrema (peaks or troughs), (3) change-points in a time series, or (4) the stability of these events across seasons and weekends.
More specifically, we use the following testing procedure. We first compute the Fourier decomposition of the 33,576 time point series of averages across the words in a given list, each standardised in the 4 years, and we extract the largest frequency response that corresponds with a sine wave of period under a year. The significance of the percentage of variance explained by the sine oscillation is then tested in a Monte Carlo setting using 100,000 permutations of the original series. To quantify the periodicity of a signal, we calculate its correlation with a periodic signal formed by repeating the 24-h profile of time points averages, this profile being characterised as a single period of the periodic times series (with period 24 h) that minimises the residual sum of square with the indicator. In that sense, the squared correlation between the 24-h profile and the indicator is interpreted as the percentage of the variance in the indicator that is explained by the profile. The 24-h periodicity of the indicator is again tested in a Monte Carlo setting by calculating the probability that similar or higher levels of percentage of variance explained can be obtained on 100,000 random permutations of the indicator. In this study, we report robust levels by extracting the profile of intraday variations separately for the weekends and for the weekdays, forming their average, and comparing to the fluctuations in the 4 years signal.
Extrema (hourly peaks or troughs) are measured on the 24-h profiles by comparing the value of a time series at a given hour of the day with the average value in a surrounding 2-h window across months and repeating this with a sliding window. The reported time of peak or trough indicates the closing hour of the sampled interval. Significance is then tested by applying a Welch’s t-test, with a Bonferroni correction to account for the 24 positions of the sliding window. Change-points are measured in a similar way, this time assessing the difference in means between the pixel values sampled in a 3-h interval immediately before and immediately after a boundary, for different positions of the boundary within the 24-h interval. To compare seasonal variation in the circadian structure during the year, we first compute the variance across the 12 months, either aligning the 24 h profile of each given month to its average sunrise time or by aligning it with the midnight. We then compare whether posemo, sadness, anger, or fatigue presents more variance in the 24 readings when aligned by midnight or by sunrise, and we compare the size of the effect in each case. The stability of circadian variations across weekend boundaries is measured by assessing the squared correlation between the 24-h average expression profiles computed on the weekdays and on the weekends. We test for significant association by computing a p-value for the significance of the correlation coefficient. The independence across emotions is tested by performing the same test as described above, either on the weekdays or on the weekends, this time between the 24-h average expression profiles of pairs of emotions. The significance threshold for all tests was set to 1%.
Results
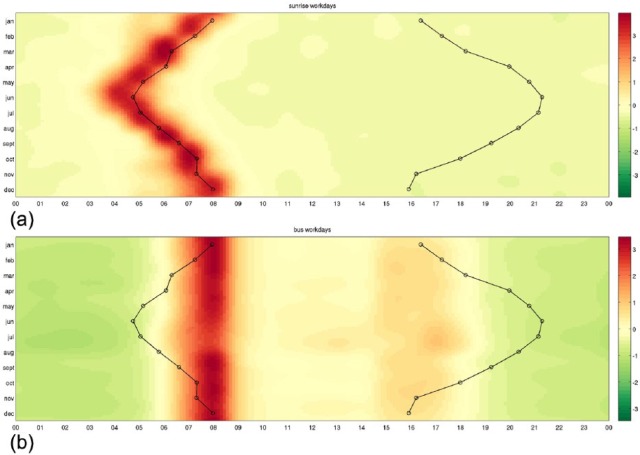
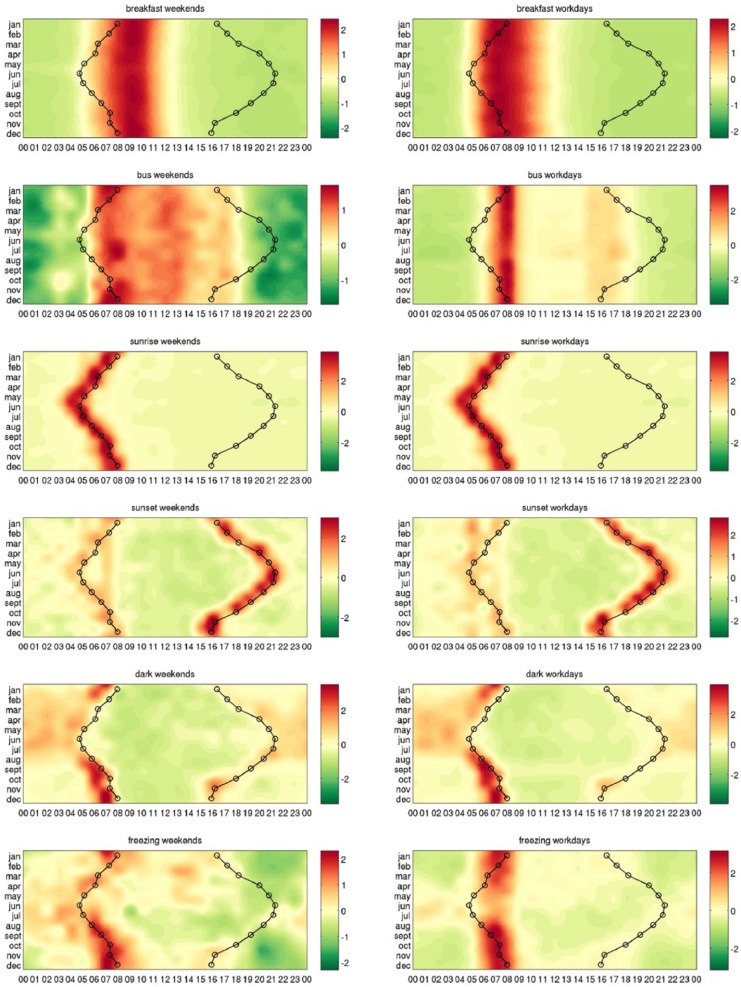
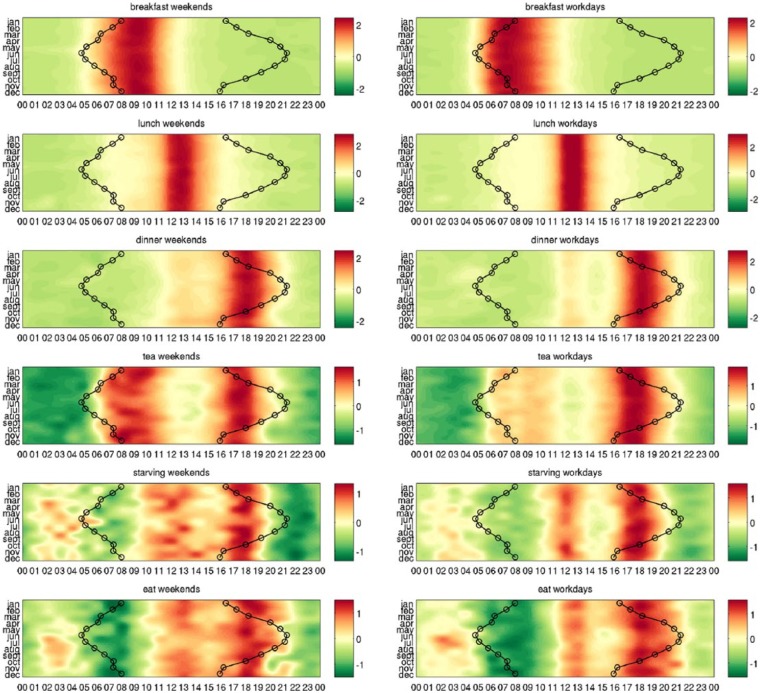
We first demonstrate our methods on a group of example words that describe environmental clues such as ‘sunrise’, ‘sunset’, meals, or sleep patterns, showing that they are over-expressed and under-expressed at the expected times. To this aim, we use the heatmaps that show in each row the relative expression of a word in different months and in each column its relative expression during the 24 h. In Figure 2, we compare the expression profiles of the words ‘sunrise’ and ‘bus’ with the actual time of sunrise and sunset across the year. We see how the word ‘sunrise’ is over-expressed at different times of the day in each month (Figure 2(a)), while the word ‘bus’ is over-expressed at the same time in all seasons (Figure 2(b)). Their shapes suggest that the former is influenced by the actual time of sunrise and the latter by some other mechanism. In Figure 3, we repeat the study separately for the weekends and for the weekdays for a series of example words for which the driving mechanisms are straightforward: ‘breakfast’, ‘bus’, ‘sunrise’, ‘sunset’, ‘dark’, and ‘freezing’. These environmental clues are put in contrast with other words representing potential zeitgebers such as meals, shown in Figure 4.
Figure 2.
Heatmaps indicating higher and lower expression in the words ‘sunrise’ (a) and ‘bus’ (b). Shades of red denote when the word is over-expressed and shades of green correspond to times when the word is under-expressed. Each row of the heatmaps represents a 24-h time series in a given month. The heatmaps of size 12 × 24 are smoothed using cubic interpolation with seven interpolated points between each sampled value. Contours indicate sunrise and sunset in local time in London, United Kingdom. Expressions of ‘sunrise’ are driven by the actual sunrise, while expressions of ‘bus’ are driven by the 24-h clock.
Figure 3.
Heatmaps indicating higher and lower expression in example keywords. Shades of red denote when the word is over-expressed and shades of green correspond to times when the word is under-expressed. Each row of the heatmaps represents a 24-h time series in a given month. The heatmaps of size 12 × 24 are smoothed using cubic interpolation with seven interpolated points between each sampled value. Contours indicate sunrise and sunset in local time in London, United Kingdom. The driving mechanisms behind these example words are straightforward.
Figure 4.
Heatmaps indicating higher and lower expression in examples words representing potential zeitgebers. Shades of red denote when the word is over-expressed and shades of green correspond to times when the word is under-expressed. Each row of the heatmaps represents a 24-h time series in a given month. The heatmaps of size 12 × 24 are smoothed using cubic interpolation with seven interpolated points between each sampled value. Contours indicate sunrise and sunset in local time in London, United Kingdom. The driving mechanisms behind these example words are straightforward.
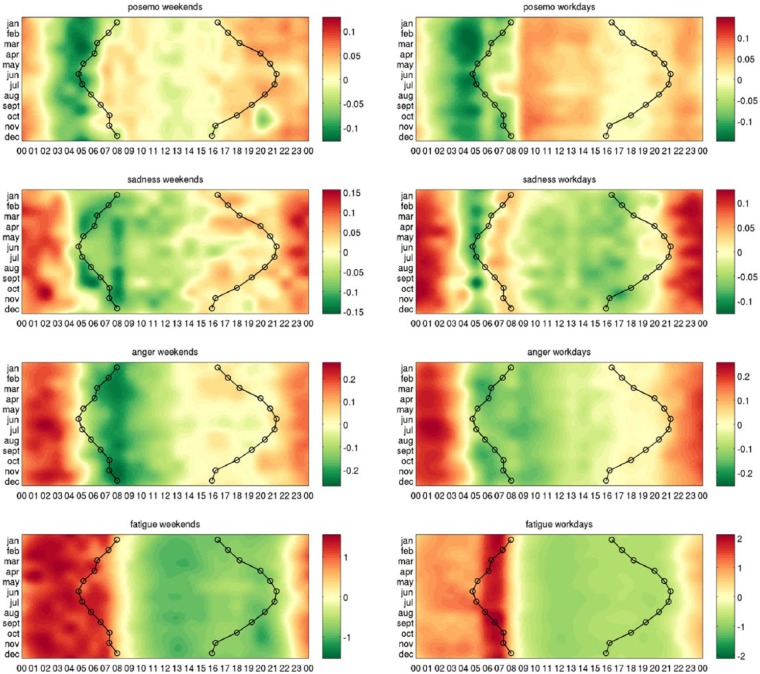
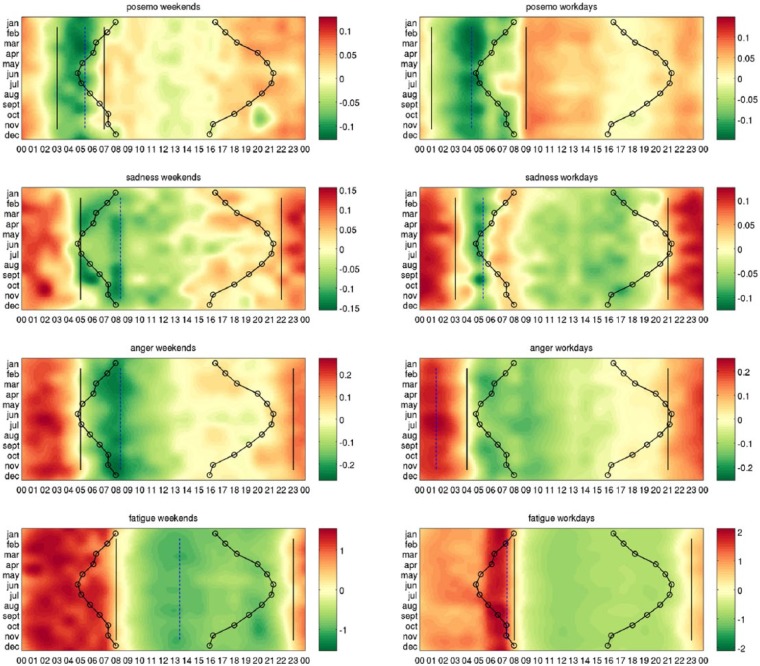
Our main results are the heatmaps of circadian variations in each of the three indicators of mood and fatigue, presented separately for the weekdays and for the weekends in Figure 5. The variations that correspond with the month of March are zoomed in Figure 6.
Figure 5.
Heatmaps indicating higher and lower expression in each emotion and fatigue. Shades of red denote when the emotion is over-expressed and shades of green correspond to times when the emotion is under-expressed. Each row of the heatmaps represents a 24-h time series in a given month. The heatmaps of size 12 × 24 are smoothed using cubic interpolation with seven interpolated points between each sampled value. Contours indicate sunrise and sunset in local time in London, United Kingdom.
Figure 6.

March variations in each emotion, with 99% confidence intervals. Variations shown separately on the weekends (top) and on the weekdays (bottom) for posemo (blue), anger (red), and sadness (green).
We see that each of posemo, sadness, anger, and fatigue show a clear circadian structure. Performing a statistical test, we found a significant 24-h sine oscillation in their 4 year series (p < 1.0e−05). The oscillation was also found as the dominant cycle in each of them, except in posemo where instead a 12 h sine oscillation explained the most of the fluctuations in the four years series. We quantify the strength of oscillation of the 24 h profile of time points average across weekends and weekdays, revealing again a significant circadian structure in each signal (p < 1.0e−05). In details, the 24-h profile explains 29% of the variance in the time series of anger, 52% in fatigue, and 4% in posemo and in sadness. The variability of the circadian structure in posemo and sadness is further discussed below (see section ‘Stability across seasons and weekends’).
Comparing the 24-h profiles between each emotion separately for the weekends and for the weekdays, we found that posemo was not correlated with sadness (ρ = 0.04/p = 8.63e−01 on weekdays and ρ = 0.41/p = 4.40e−02 on weekends) or anger (ρ = -0.07/p = 7.46e−01 on weekdays and ρ = 0.07/p = 7.51e−01 on weekends), whereas these two measures of negative affect were correlated with each other both on weekdays (ρ = 0.76/p = 1.89e−05) and on weekends (ρ = 0.93; p = 1.02e−10). If we use the combined measure for all negative emotions in LIWC, we find again that this has no correlation with posemo (weekdays ρ = −0.04/p = 5.21e−01 and weekends ρ = 0.30/p = 1.52e−01). This result was also observed in a previous study (Golder and Macy, 2011) and indicates that positively and negatively valenced moods are not just the opposite of each other, but are separate processes. Furthermore, both aspects of negative mood – sadness and anger – are strongly correlated in time and neither of them shows significant correlation with positive mood – posemo. Two patterns emerge clearly from Figure 5: anger shows a circadian nadir in the morning, then gradually increases throughout the day to reach a peak in the evening through to early morning. This pattern is the inverse mirror image of the classical pattern of cortisol secretion – a hormone well known for its effect on mood (Pariante and Lightman, 2008). Posemo, however, exhibits a biphasic behaviour, it rises rapidly in the morning with bimodal peaks between 08.00 and 10.00 h and 20.00 and 24.00 h with a plateau between and then falling to low levels overnight.
Morning inflexion (Welch’s t-test)
Our other finding of note was the remarkably sharp inflexion occurring in the morning in most emotions and in fatigue. Although, in each signal, these events can be of different type, with some quantities showing a minimum, others a maximum, others a change-point at that time. Statistical testing shows that in seven cases out of eight the largest extremum or the largest change-point is identified across the seasons between 5 a.m. and 9 a.m. Because of the difference in daily routines expected along the 12 months between weekends and weekdays, this regularity could presumably be related to an entrained clock response.
In detail, fatigue shows a very sharp decrease after 8 a.m. across the year in both the weekends (t(53) = −18.88; p = 8.75e−24) and the weekdays (t(68) = −17.29; p = 2.84e−25) suggesting possible interaction with cortisol changes. The largest extremum in fatigue during the weekdays is the maximum reached in the morning at 8 a.m. (t(58) = 8.68; p = 1.17e−10), during the weekends it is the minimum reached in the afternoon at 2 p.m. (t(25) = −4.92; p = 1.09e−03).
In the weekdays, sadness reaches the minimum in the morning at 6 a.m. (t(25) = −10.18; p = 5.70e−09) followed by a local maximum at 8 a.m. (t(46) = 6.75; p = 5.34e−07). Anger experiences two local minima in the morning, the first at 7 a.m. (t(53) = −5.86; p = 7.19e−06) and the second at 10 a.m. (t(27) = −5.73; p = 1.07e−04), but reaches the maximum late in the night at 2 a.m. (t(26) = 5.91; p = 6.96e−05). Posemo reaches the minimum at 5 a.m. (t(36) = −7.45; p = 2.18e−07) followed by a remarkable increase after 9 a.m. (t(42) = 18.91; p = 1.06e−20). In the weekends, sadness reaches the minimum at 9 a.m. (t(18) = −4.50; p = 7.07e−03), anger reaches the minimum at 9 a.m. as well (t(31) = 8.78; p = 1.50e−08). Posemo reaches low levels at 5 a.m. (t(47) = −5.14; p = 1.25e−04), the minimum is attained at 6 a.m. (t(32) = −5.53; p = 1.03e−04), and it is followed by a remarkable increase after 7 a.m. (t(59) = 14.57; p = 8.81e−20).
Figure 7 shows the largest extremum (dashed line) and the two largest change-points (solid lines) identified in each of the eight heatmaps, as reported above other events that occurred in the morning between 5 a.m. and 9 a.m. were found to be significant at 1% level, after applying the Bonferroni correction to all tests to account for the 24 multiple tests.
Figure 7.
Extrema and change-points in each emotion and in fatigue – the heatmaps show times of higher and lower expression in posemo, sadness, anger, and fatigue. Each row of the heatmaps represents a 24-h time series in a given month. Solid lines indicate the two largest change-points across months, dashed lines indicates the largest extremum across months between the maximum and the minimum, and other significant extrema are found at 1% level. The heatmaps of size 12 × 24 are smoothed using cubic interpolation with seven interpolated points between each sampled value. Contours indicate sunrise and sunset in local time in London, United Kingdom. Both sadness and anger show strong morning minima occurring at the same time in the weekends.
Stability across seasons and weekends
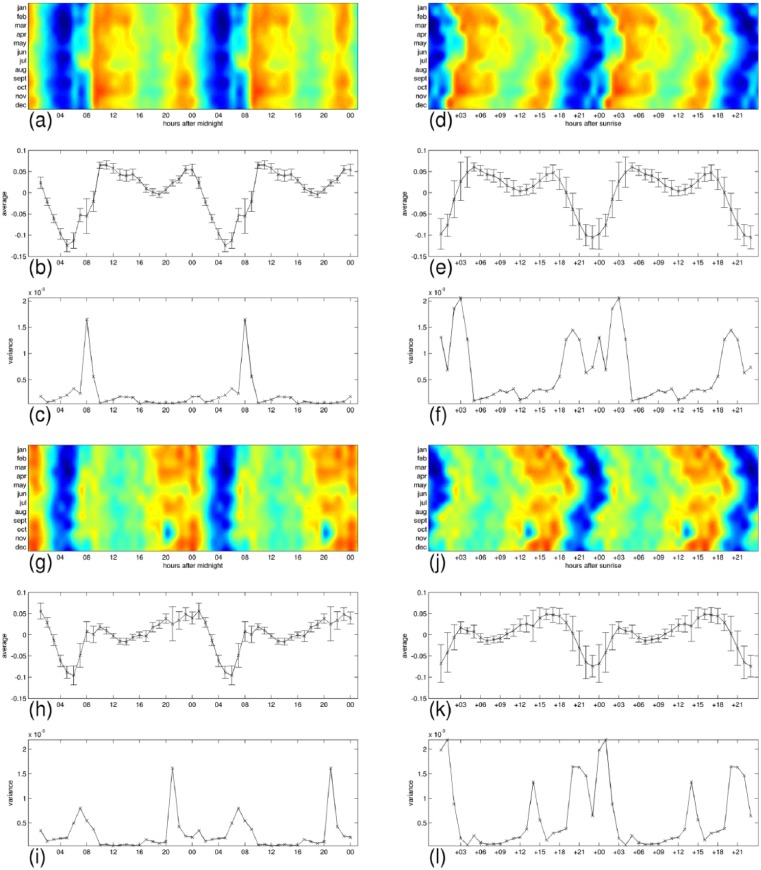
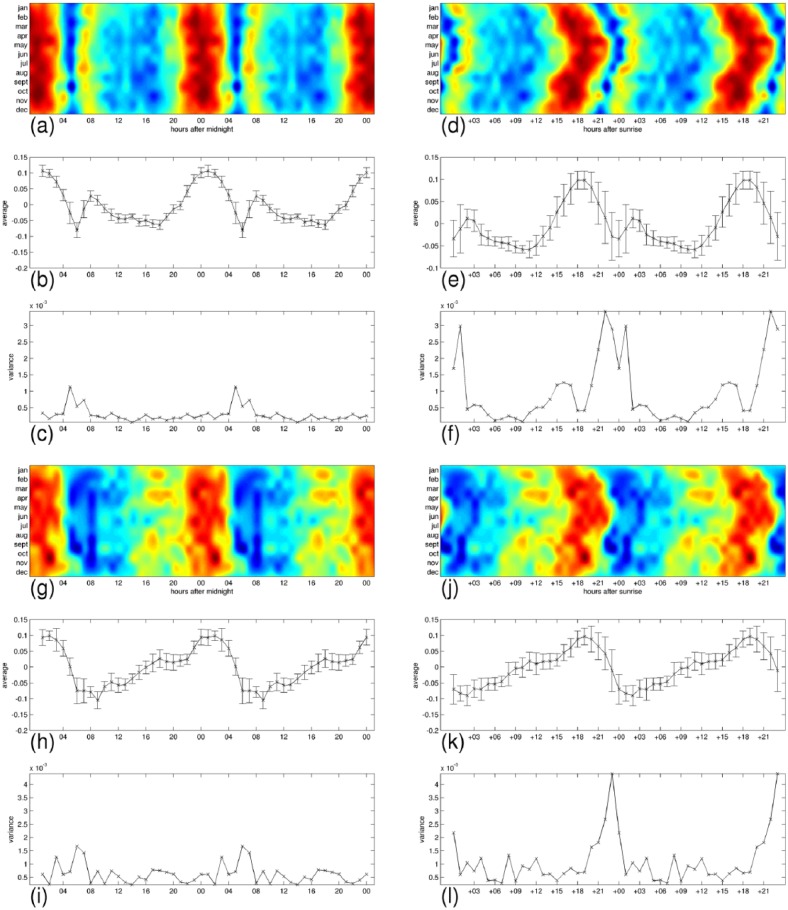
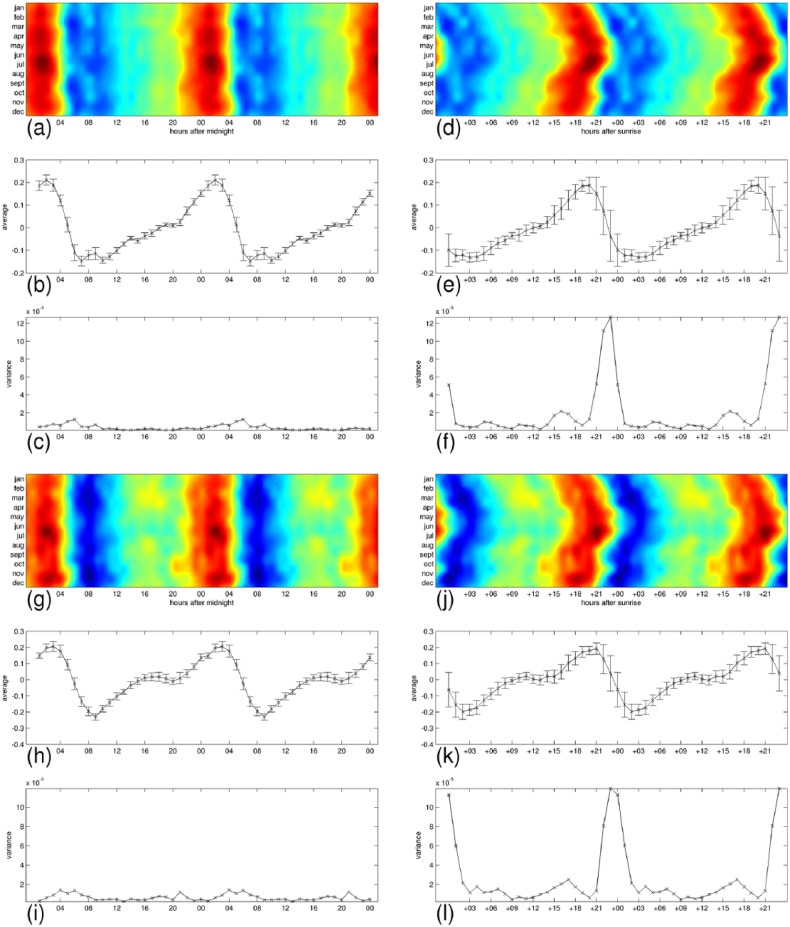
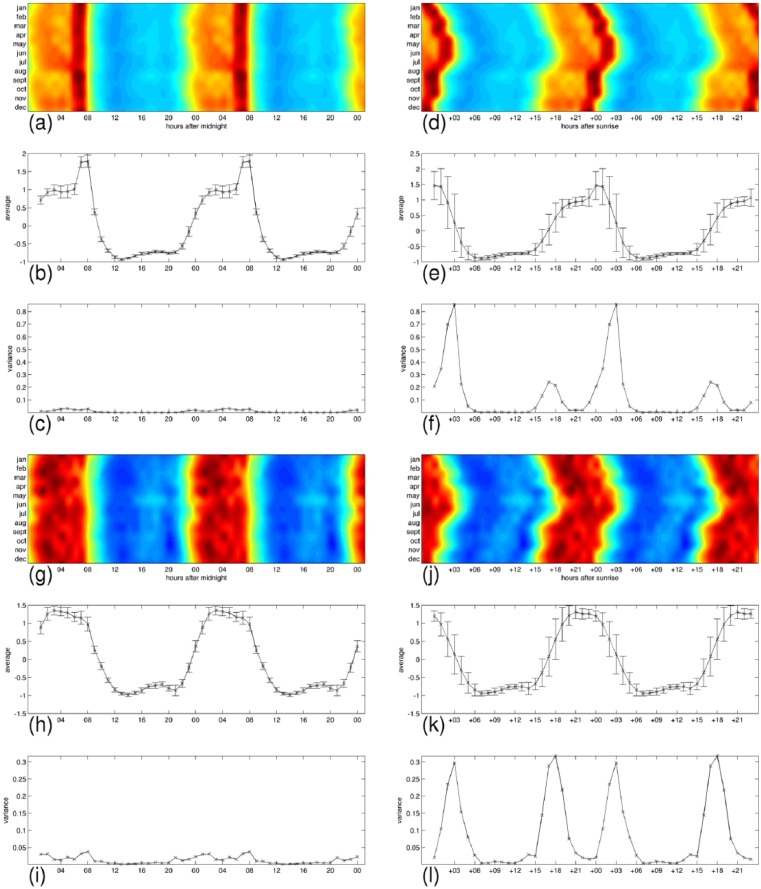
The daily profiles appear to be generally stable across the 12 months and we wanted to test whether the levels of expression during the day could be affected by seasonal changes such as the onset of sunlight exposure as would suggest a visual inspection of Figure 5. While all emotions and fatigue are better predicted by the 24-h clock than by the hours passed since sunrise, posemo and sadness are more predictable than anger and fatigue in this second time system.
Given an emotion or fatigue, we compute the variance across months at any time of the day, measuring time either as hours from midnight or as hours passed since sunrise. This variance captures how much we could predict of the levels of expression if we knew the time but not the month since a low value at a given time would designate this time of day as a strong factor in determining the levels. Using the ratio of total variance across months in midnight alignment to total variance across months in sunrise alignment, we observe that all signals are better predicted in the 24-h cycle when measuring time of day as hours passed since midnight, either on weekdays (fatigue 7.3%, anger 18%, sadness 30%, and posemo 31%) or on weekends (fatigue 15%, anger 27%, posemo 44%, and sadness 59%). However, we notice that the weekend variations are better predicted than the weekdays variations by the hours passed since sunrise, and we observe the exception of posemo and sadness that are always better predicted than anger and fatigue in this way of measuring time. This result indicates higher levels of interaction between these two emotions and the onset of sunlight exposure.
In Figures 8–11, we have detailed the mean expression levels and the variance across months per each hour of the day, for posemo, sadness, anger, and fatigue, respectively. Panels (a–c) and panels (g–i) correspond with their expression in the 24-h clock on the weekdays and on the weekends, respectively. They show in order, the heatmap repeated in a 48-h interval to ease readability of the patterns, the mean expression levels, and the variance across months per each hour of the day. Panels (d–f) and panels (j–l) correspond with their expression by the hours passed since sunrise, on the weekdays and on the weekends, respectively. Using the sunrise clock we can see important exceptions in the levels of variance of anger and fatigue compared to the levels of variance in the midnight clock, in particular in their morning variation. We observe closer levels between the two time systems for posemo and sadness, and we notice the exception of fatigue in the weekends that shows similarly low levels of variance in the sunrise clock at the onset of sunlight exposure. A visual inspection of the figures suggests further seasonal interactions that deserve more investigations.
Figure 8.
Detailed average expressions and variance across months for posemo. The 24-h pattern is repeated to form a 48-h pattern and ease readability. (a–c) weekdays expressions, and (g–i) weekends expression in the 24-h clock. (d–f) weekdays expressions, and (j–l) weekends expressions by the hours passed since sunrise. Each group shows, from top to bottom, the heatmap repeated in a 48 h interval to ease readability of the patterns, the mean expression levels with bars indicating the standard deviation, and the variance across months per each hour of the day.
Figure 9.
Detailed average expression and variance across months for sadness. The 24-h pattern is repeated to form a 48-h pattern and ease readability. (a–c) weekdays expressions, and (g–i) weekends expression in the 24-h clock. (d–f) weekdays expressions, and (j–l) weekends expressions by the hours passed since sunrise. Each group shows, from top to bottom, the heatmap repeated in a 48-h interval to ease readability of the patterns, the mean expression levels with bars indicating the standard deviation, and the variance across months per each hour of the day.
Figure 10.
Detailed average expression and variance across months for anger. The 24-h pattern is repeated to form a 48-h pattern and ease readability. (a–c) weekdays expressions, and (g–i) weekends expression in the 24-h clock. (d–f) weekdays expressions, and (j–l) weekends expressions by the hours passed since sunrise. Each group shows, from top to bottom, the heatmap repeated in a 48-h interval to ease readability of the patterns, the mean expression levels with bars indicating the standard deviation, and the variance across months per each hour of the day.
Figure 11.
Detailed average expression and variance across months for fatigue. The 24-h pattern is repeated to form a 48-h pattern and ease readability. (a–c) weekdays expressions, and (g–i) weekends expression in the 24-h clock. (d–f) weekdays expressions, and (j–l) weekends expressions by the hours passed since sunrise. Each group shows, from top to bottom, the heatmap repeated in a 48-h interval to ease readability of the patterns, the mean expression levels with bars indicating the standard deviation, and the variance across months per each hour of the day.
Furthermore, we examine the differences of the profiles across the weekend boundary, finding that the weekdays 24-h time series of posemo has a squared correlation coefficient of 0.54 with the corresponding weekend signal (p = 3.84e−05). For sadness, this quantity is 0.44 (p = 4.54e−04); for fatigue, 0.91 (p = 4.06e−13); and for anger, 0.86 (p = 7.15e−11). These results show that the circadian structure in posemo and in sadness is more affected by the weekend transition than the circadian structure in fatigue and anger.
Conclusion
Subjective mood is influenced by a complex interaction of circadian phase and homeostatic sleep pressure (Boivin et al., 1997; Murray et al., 2009). The largest ecological momentary assessment (EMA) sample published studied 408 subjects with hourly affect measures and did indeed provide evidence for a circadian pattern of positive emotion and weaker pattern of negative emotion. The peak of PA was around midday with some variations in different chronotypes. This is in keeping with our data, although the sharp morning rise in PA we find was not apparent in their data. This may result from a combination of the hourly sampling schedule and bias involved in self-reporting.
Circadian mood patterns in Twitter have also been reported in Golder and Macy (2011) and Lampos et al. (2013), and our observations are in agreement with the finding that the general mood starts good in the morning and deteriorates through the day, despite being obtained with different procedures and samples. While we are in general agreement with previous results reported across cultures (Golder and Macy, 2011), we also find additional details that had not been observed before.
Our data confirm that the positive and the negative moods fluctuate independently in the 24-h cycle (Golder and Macy, 2011). We also observe a biphasic behaviour in positive mood also noted in Golder and Macy (2011) and in Lampos et al. (2013). We add to this result by reporting a dominant 12-h oscillation pattern in the 4 years samples. Our data did not reveal a 2-h delay in the morning rise of the positive emotions on the weekends (Golder and Macy, 2011); however, we found significant differences in positive mood fluctuations between weekdays and weekends. We believe this study of circadian variations is the first to decompose the spectrum of the negative emotions into anger and sadness and to compare with fatigue. We find that the circadian structure in anger and fatigue are largely unaffected across the year and across the change in activities that occurs in the weekends. In addition, we show that the 24-h profiles of posemo and sadness exhibit more variability in response to these changing conditions, and higher levels of interaction with the onset of sunlight exposure. This suggests an endogenous non-photic signal is involved in anger and fatigue-perhaps related to sleep and HPA activity (Pilorz, 2016). The circadian variations that our data reveal for anger match the observations made in Golder and Macy (2011) for the negative emotions, but not those reported in Lampos et al. (2013). In this latter study, a smaller sample of the data collected and analysed in this study was used in combination with a different method to extract mood scores. Overall, we find an important morning inflexion in all three emotions and in fatigue that occurs in every season, possibly suggesting an underlying biological mechanism. There is certainly evidence that emotionality may be closely associated with cortisol levels (Pariante and Lightman, 2008) and even to circadian cortisol release (Miller et al., 2016). In the light of this, the relationship we find for anger and to a lower extent fatigue that inversely mirror the known circadian variation of plasma cortisol concentrations is quite striking. This association must of course be treated with caution as we have no evidence for causality.
From a technical point of view, this study differs from previous works using a larger time interval (4 years) and a larger corpus (800 million messages), by only targeting Twitter content generated in the United Kingdom and by developing more robust indicators of mood in text that are less affected by the effects of individual words or individual days. Indeed, the signals we have extracted were designed to reflect coordinated change in many words used at the same time by a large population, and our analysis methods are designed to highlight subtle patterns in phase changes due to seasons. All this increases the statistical resolution of the analysis and enables the observation of subtler effects. This study has also revealed strong periodicities in daily activities, including meals, sleep times, or work patterns, as a way to demonstrate our techniques. We believe they will provide powerful tools for future research programmes.
These data point to the importance of understanding dynamic changes in mood both across the day and across the year. This is difficult to measure using retrospective questionnaires, and recent efforts have been made to overcome this with techniques of momentary assessment (Bonsall et al., 2012) and remote sensors (Glenn and Monteith, 2014). We believe that utilisation of additional aspects of social media will help provide better understanding of these important characteristics and correlates of mood changes and especially their interaction with circadian and other cues.
Future studies will be designed to reveal even finer structure in this data, unravelling the various factors that might regulate our circadian patterns of mood. Since circadian rhythm and sleep disorders have been reported across the whole spectrum of mood disorders, we expect that further analysis of social media content could provide a valuable resource to the understanding of mental disorder.
Acknowledgments
F.D. and N.C. designed the empirical and statistical study. F.D., N.C., and S.L. interpreted the results and prepared the manuscript.
Footnotes
Declaration of conflicting interests: The author(s) declared no potential conflicts of interest with respect to the research, authorship, and/or publication of this article.
Funding: N.C. and F.D. were supported by the ERC Advanced Grant ThinkBIG.
References
- Boivin DB, Czeisler CA, Dijk DJ, et al. (1997) Complex interaction of the sleep-wake cycle and circadian phase modulates mood in healthy subjects. Archives of General Psychiatry 54(2): 145–152. [DOI] [PubMed] [Google Scholar]
- Bonsall MB, Wallace-Hadrill SM, Geddes JR, et al. (2012) Nonlinear time-series approaches in characterizing mood stability and mood instability in bipolar disorder. Proceedings of the Royal Society B: Biological Sciences 279(1730): 916–924. [DOI] [PMC free article] [PubMed] [Google Scholar]
- Broome MR, Saunders KEA, Harrison PJ, et al. (2015) Mood instability: Significance, definition and measurement. The British Journal of Psychiatry 207(4): 283–285. [DOI] [PMC free article] [PubMed] [Google Scholar]
- Dzogang F, Lansdall-Welfare T, Cristianini N. (2016) Seasonal fluctuations in collective mood revealed by Wikipedia searches and Twitter posts. In: Proceedings of the 2016 IEEE international conference on data mining workshop (SENTIRE), Barcelona, 12–15 December. [Google Scholar]
- Glenn T, Monteith S. (2014) New measures of mental state and behavior based on data collected from sensors, smartphones, and the Internet. Current Psychiatry Reports 16(12): 523. [DOI] [PubMed] [Google Scholar]
- Golder SA, Macy MW. (2011) Diurnal and seasonal mood vary with work, sleep, and daylength across diverse cultures. Science 333(6051): 1878–1881. [DOI] [PubMed] [Google Scholar]
- Hughes S, Watson TS, Foster RG, et al. (2013) Nonuniform distribution and spectral tuning of photosensitive retinal ganglion cells of the mouse retina. Current Biology 23(17): 1696–1701. [DOI] [PMC free article] [PubMed] [Google Scholar]
- Kyriacou CP, Hastings MH. (2010) Circadian clocks: Genes, sleep, and cognition. Trends in Cognitive Sciences 14(6): 259–267. [DOI] [PubMed] [Google Scholar]
- Lampos V, Lansdall-Welfare T, Araya R, et al. (2013) Analysing mood patterns in the United Kingdom through Twitter content. Available at: https://arxiv.org/abs/1304.5507
- Lucas RJ, Freedman MS, Munoz M, et al. (1999) Regulation of the mammalian pineal by non-rod, non-cone, ocular photoreceptors. Science 284(5413): 505–507. [DOI] [PubMed] [Google Scholar]
- Miller KG, Wright AG, Peterson LM, et al. (2016) Trait positive and negative emotionality differentially associate with diurnal cortisol activity. Psychoneuroendocrinology 68: 177–185. [DOI] [PMC free article] [PubMed] [Google Scholar]
- Miller MA, Rothenberger SD, Hasler BP, et al. (2015) Chronotype predicts positive affect rhythms measured by ecological momentary assessment. Chronobiology International 32(3): 376–384. [DOI] [PMC free article] [PubMed] [Google Scholar]
- Murray G, Nicholas CL, Kleiman J, et al. (2009) Nature’s clocks and human mood: The circadian system modulates reward motivation. Emotion 9(5): 705–716. [DOI] [PubMed] [Google Scholar]
- Pariante CM, Lightman SL. (2008) The HPA axis in major depression: Classical theories and new developments. Trends in Neurosciences 31(9): 464–468. [DOI] [PubMed] [Google Scholar]
- Pennebaker JW, Francis ME, Booth RJ. (2001) Linguistic Inquiry and Word Count (LIWC 2001), vol. 71 Mahwah, NJ: Lawrence Erlbaum Associates. [Google Scholar]
- Piantadosi ST. (2014) Zipf’s word frequency law in natural language: A critical review and future directions. Psychonomic Bulletin & Review 21(5): 1112–1130. [DOI] [PMC free article] [PubMed] [Google Scholar]
- Pilorz V, Tam SK, Hughes S, et al. (2016) Melanopsin regulates both sleep-promoting and arousal-promoting responses to light. PLoS Biology 14(6): e1002482. [DOI] [PMC free article] [PubMed] [Google Scholar]
- Tausczik YR, Pennebaker JW. (2010) The psychological meaning of words: LIWC and computerized text analysis methods. Journal of Language and Social Psychology 29(1): 24–54. [Google Scholar]
- Watson D, Clark LA. (1997) Measurement and mismeasurement of mood: Recurrent and emergent issues. Journal of Personality Assessment 68(2): 267–296. [DOI] [PubMed] [Google Scholar]
- Watson D, Clark LA. (1999) The PANAS-X: Manual for the Positive and Negative Affect Schedule-Expanded Form. Ames, IA: The University of Iowa. [Google Scholar]
- Welsh DK, Logothetis DE, Meister M, et al. (1995) Individual neurons dissociated from rat suprachiasmatic nucleus express independently phased circadian firing rhythms. Neuron 14(4): 697–706. [DOI] [PubMed] [Google Scholar]
- Wirz-Justice A, Graw P, Kräuchi K, et al. (1993) Light therapy in seasonal affective disorder is independent of time of day or circadian phase. Archives of General Psychiatry 50(12): 929–937. [DOI] [PubMed] [Google Scholar]
Associated Data
This section collects any data citations, data availability statements, or supplementary materials included in this article.
Data Availability Statement
The raw data necessary for repeating this analysis will be made freely available, in the form of the hourly raw-count time series of the frequency for each of the words included in the LIWC and PANAS lists and total number of word occurrences for each hour of the time interval.


