Abstract
The main concern pertaining to the safety of Gadolinium(III) Based Contrast Agents (GBCAs) is the toxicity caused by the unchelated ion, which may be inadvertently present in the solution due most commonly, to excess unreacted starting material or dissociation of the complexes. Detecting the aqueous free ion during the synthesis and preparation of GBCA solutions is therefore instrumental in ensuring the safety of the agents. This paper reports the development of a sensitive fluorogenic sensor for aqueous unchelated Gadolinium(III) (Gd(III)). Our design utilizes single-stranded oligodeoxynucleotides with a specific sequence of 44 bases as the targeting moiety. The fluorescence-based assay may be run at ambient pH with very small amount of samples in 384-well plates. The sensor is able to detect nanoMolar concentration of Gd(III), and is relatively unresponsive toward a range of biologically relevant ions and the chelated Gd(III). Although some cross-reactivity with other trivalent lanthanide ions, such as Europium(III) and Terbium(III) is observed, these are not commonly found in biological systems and contrast agents. This convenient and rapid method may be useful in ascertaining a high purity of GBCA solutions.
Keywords: Fluorogenic sensor, aqueous Gd(III) ions, chemical sensor, lanthanide ion sensor
Introduction
Within the last few decades, the increasing importance of magnetic resonance imaging (MRI) in medical diagnosis has spurred the commensurate growth of MRI contrast agents (CAs) development for all stages of applications from research to clinical. Among the many classes of CAs, Gadolinium(III) Based Contrast Agents (GBCAs) represent the largest group currently in clinical use. All GBCAs have the general chemical structure of a polydentate organic ligand coordinated to a trivalent gadolinium ion, Gd(III), through typically a nitrogen, or an oxygen atom [1]. The chelation of Gd(III) is a fundamental criteria for GBCAs as the free aqueous Gd(III) ion is highly toxic in vivo. Putative mechanisms include its ability to compete with Calcium(II) in the biological system (due to their comparable ionic radii) [1], and involvement in the pathogenesis of nephrogenic systemic fibrosis in patients with impaired kidney function [2]. Complexing the ion with an organic ligand can drastically improve the LD50 values [3]. Nevertheless, free Gd(III) ions may still be inadvertently present in GBCA solutions through either dissociation of the complex, or as impurity during the synthesis (for example, an incomplete reaction between the ligand and Gd(III) ion). There are two major immediate concerns with Gd(III) ion toxicity, the first is the direct effect on the patients undergoing MRI tests. The second is the indirect consequence on the environment following GBCAs disposal from hospitals and excretion from patients who have been administered the compounds. With regard to the latter, in Germany alone, the environmental contribution of GBCAs from clinical radiology has been estimated to be more than 100 kg/year [4]. While most of the environmental output of GBCAs consist of Gd(III) ion in the chelated form, one detailed study showed that the most widely used Gd(III) complexes accounted only for ~74–89% of the total Gd(III) ion found in nature reserve water samples in Münster [5]. This study infers the presence of other types of Gd(III) species [5], some of which may possibly be the toxic free ion. Gd(III) has an LD50 value of 0.5 mmol/kg in rats [3], and much lower bioactive concentrations, e.g. 10 mg/kg in rats (~ 40 µM/kg) [6,7] for altering enzyme activity, and 20 µM to induce impairment in neuron-astrocyte co-cultures [8]. It is imperative that we can detect the presence of low concentrations of free Gd(III) ion in aqueous environment, starting even from the early stages during the synthesis of the GBCAs.
There are currently a few methods available for detecting the ion in aqueous solutions. One elegant design is to use chromatographic and/or mass spectrometric-based technology for detecting different types of Gd(III) complexes. This technique has been employed in a variety of sample matrices including blood plasma [9], contrast agent formulation [10], environmental water samples [11], and plants [12] (for a more complete list of the different techniques and application, please see a recent comprehensive review [13] on the subject). It is a highly sensitive and accurate method, with the added advantage of simultaneous detection of the different species of Gd(III) complexes. It has only one slight drawback; it requires expensive instrumentation. A more cost effective strategy would be to measure the fluorescence quenching of calcein blue [14], or another that is commonly employed at present in research laboratories is to use xylenol orange as a complexometric indicator for the ions [15]. The color change resulting from the chelation of xylenol orange to free Gd(III) ion allows for quantification by UV-VIS spectroscopy. This method is rapid, convenient and accurate, but less sensitive (limit of detection in the low microMolar range) and is not selective (xylenol orange is a complexometric indicator for various metal ions). Nevertheless, due to its advantages, the xylenol orange assay has found a wide application and is currently used in numerous studies as a means for detecting residual free Gd(III) following the synthesis and purification of novel GBCAs [16–19].1
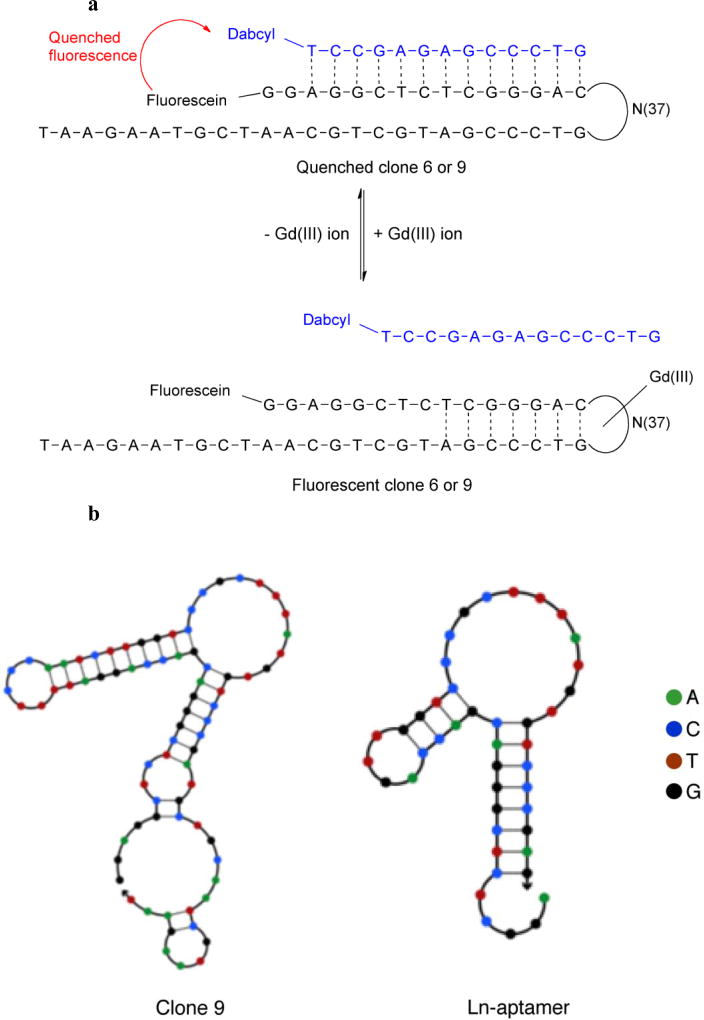
It is apparent that the availability of a technique that can serve as a simple and rapid tool for detecting free Gd(III) ion will be valuable for a variety of purposes. Encouraged by an earlier published work on the development of single stranded DNA molecule (aptamer) that can bind to Zinc(II) [20], we decided to focus our attention on developing an aptamer-based assay for detecting Gd(III) ion. Through a well-established selection and amplification protocol of modified SELEX (Systematic Evolution of Ligands by EXponential enrichment) [20–22], a 44-base long aptamer was isolated. Although the strand is not specific for Gd(III) over other lanthanides, it does not react with many biologically relevant metal ions and its low detection limit allows for its use to detect Gd(III) in GBCA solutions, where no other lanthanides are present. The strand (Ln-aptamer) was subsequently developed into a fluorescent sensor for the Gd(III) ion using the strategy depicted in Fig. 1a [20,22]. The selectivity of Ln-aptamer was tested against several metal ions, ligands and complexes. To further validate this aptamer as a selective indicator for aqueous Gd(III) ion, some of our results are compared with those obtained using xylenol orange [15]. We find that Ln-aptamer has a high sensitivity and selectivity for aqueous unchelated Gd(III) ions (thus ensuring a greater purity of the GBCAs to be tested). In addition, the assay requires only a small amount of material (in 384-well plates) with minimal sample preparation, and can be run at ambient pH.
Fig. 1.
a Design adopted to measure the binding between the selected clones (clone 6 and 9) and Gd(III) ion. Clone 6 and 9 is tagged with a fluorophore (fluorescein) and hybridized with a 13-base long QS bearing a quencher (dabcyl). In the absence of Gd(III), the clone-QS hybrid is quenched. Adding Gd(III) leads to displacement of QS and the formation of clone-Gd(III) complex, which results in fluorescence growth. b Structures of clone 9 and the truncated Ln-aptamer as predicted using NUPACK [23]. The ‘loop’ region of clone 9 is conserved in Ln-aptamer, and the latter is subsequently adapted into a sensor for detecting the presence of free Gd(III) ion following the strategy depicted in a
Experimental
Reagents
Unless otherwise stated, all reagents were used without further purification. Xylenol orange, meglumine, L-(+)-lactic acid, sodium acetate, oxidized (GSSG) and reduced (GSH) glutathione, GdCl3 and DTPA were purchased from Sigma Aldrich. DOTA, and Gd-DOTA were purchased from Macrocyclics. All oligonucleotides were purchased from IDTDNA. Modified oligonucleotides (biotinylated, fluorescein and dabcyl tagged) are ordered purified via reverse-phase HPLC. D-glucose monohydrate, HEPES, Na2HPO4, NaH2PO4, NaHCO3, NaCl, KCl, HCl, NaOH, MnCl2.4H2O, CaCl2, NiCl2.6H2O were obtained from Fisher Chemical. FeCl2.4H2O, CuCl, CuCl2.2H2O, FeCl3, MgCl2, ZnCl2, CrCl3 from Acros Organics, CoCl2.6H2O from Spectrum Chemicals, Na2CO3.H2O from JT Baker, and NaHSO4.H2O from Alfa Aesar. Magnevist® (Bayer) and Ablavar® (Lantheus Medical Imaging) were kindly donated by the University of California San Francisco Department of Radiology and Biomedical Imaging.
Preparation of SELEX buffer and target solution
The SELEX buffer composition is as follows: 20 mM HEPES, 2 mM MgCl2, 150 mM NaCl, 5 mM KCl, adjusted to pH 7.4 with NaOH and HCl. All buffers are prepared using molecular biology grade water (Hyclone, GE Healthcare Life Sciences) and filtered (0.2 µm, PES membrane, Nalgene, Thermo Scientific). The GdCl3 target solution was prepared fresh before each round of SELEX by dissolving GdCl3 in SELEX buffer at the desired concentration.
Reagent stock solutions
All oligonucleotides were dissolved separately in molecular biology grade water to prepare 100 µM stock solution of each and stored at −4 °C. The solutions are stable for thus far, up to 2 years. Small aliquots of the stock solutions were prepared that were sufficient for a few experiments to minimize the thaw-freeze cycles.
Gd-aptamer isolation through SELEX
The in vitro selection process [22] was largely followed with slight modification to the strand sequences. In brief, the oligonucleotides used for SELEX are as follows:
a random library with 22N bases: 5’-GGAGGCTCTCGGGACGAC- N2-GGATTTTCC-N20-GTGTCCCGATGCTGCAATCGTAAGAAT-3’
biotinylated immobilizing strand: 5’-GTCGTCCCGAGAGCCATA-BioTEG-3’
forward primer: 5’-GGAGGCTCTCGGGACGAC-3’
reverse primer: 5’-ATTCTTACGATTGCAGCATC-3’
biotinylated reverse primer: 5’-biotin-ATTCTTACGATTGCAGCATC-3’
Throughout all rounds of SELEX, the mole ratio of library to immobilizing strand was kept constant at 1:5, respectively. All SELEX experiments were performed in SELEX buffer with the composition listed above. The progress of enrichment was monitored by PCR amplification and electrophoresis on 3% agarose gel. For the first round, 0.3 nanomoles of random library and 1.5 nanomoles of immobilizing strand were used. The mixture was dissolved in 250 µL SELEX buffer, incubated at 95 °C for 5 minutes, and allowed to slowly cool to room temperature. A streptavidin agarose column was prepared by adding 250 µL of streptavidin agarose (1–3 mg biotinylated BSA/mL resin, Thermo Scientific) into a disposable gravity column (Thermo Scientific), and washed 5 times with the same volume of SELEX buffer each time. The oligonucleotide mixture was then added to a streptavidin agarose column, incubated for 3 minutes, the eluent collected and equilibriated with the column 2 more times. The column was washed with 250 µL of SELEX buffer 10 times, the eluent of each wash was collected into a separate microcentrifuge tube. 250 µL of 100 µM of GdCl3 solution in SELEX buffer was then added to the column, the mixture incubated for 3 minutes and the eluent collected. This was repeated for a total of 3 times, all the target elutions were combined, concentrated (using Amicon Ultra 0.5 centrifugal Filter, MWCO 10kDa, EMD Millipore), and used as the template for PCR (Polymerase Chain Reaction).
PCR (Polymerase Chain Reaction) protocol
The template from the SELEX round was added into a total of 1 mL of PCR mixture containing 1 µM each of the forward and biotinylated reverse primers, 200 µM dNTP (Promega Corporation), 1.5 mM MgCl2, and 10 µL of 5u/µL GoTaq® DNA Polymerase (Promega Corporation). The reaction was carried out under the following conditions: 1 cycle at 95 °C (2 min), N cycle of (15 sec at 95 °C, 30 sec at 62 °C, 45 sec at 72 °C) and 1 cycle at 72 °C (3 min). N typically ranged between 10–18 cycles.
Strand separation of PCR product
Following PCR amplification, the product was concentrated (using Amicon Ultra 0.5 centrifugal Filter, MWCO 30kDa, EMD Millipore) and the double stranded amplicon was separated on a streptavidin agarose column using 250 µL of 0.5 M NaOH solution. The eluent was collected and neutralized with HCl to pH 7.3–7.4. For the subsequent rounds, ~0.15 nanomoles of the single-stranded product from the previous round was used as the library, while keeping the immobilizing strand constant at 5× mole ratio. Once pool enrichment was observed, the concentration of the target was lowered to increase the selection pressure. At 10 nM target concentration, when the pool was already enriched, counter selection against DOTA, DTPA, Gd-DOTA and Gd-DTPA were performed. Gd-DTPA was prepared by mixing 1:1 ratio of DTPA and GdCl3 in SELEX buffer and mixing it for ~20 min. Subsequently, the pool was cloned on chemically competent TOP10 E. coli (Invitrogen) following manufacturer’s protocol and sequenced. Out of 22 complete sequences obtained, 2 clones (clones 6 and 9) were selected based on the redundancy of clone copies, and the one with higher affinity was chosen for the remainder of the analysis.
Initial binding affinity study of clones 6 and 9
Clones 6 and 9 were mixed with QS in SELEX buffer (concentration of 100 nM of the clone and 200 nM of QS), incubated at 95 °C for 5 minutes and slowly cooled to room temperature. GdCl3 solution in SELEX buffer was prepared by serial dilution at double the final desired assay concentration. 50 µL of the clone-QS mixture was then added to 50 µL of GdCl3 solution to give the final assay concentration of 50 nM of the clone, 100 nM of QS and varying concentrations of Gd(III). The mixture was mixed thoroughly, incubated for 10 minutes and transferred to 384-well plates (Corning 3575, Fisher Scientific, Inc) with a total volume 40–45 µL on a plate reader (BioTek Synergy™ H1, excitation wavelength of 485 nm and the emission monitored at 528 nm). The graph is plotted as the average raw fluorescence readings (arbitrary unit, a.u.) with standard deviation as the y-error bars.
-
Clone 6 for binding affinity study:
5’–56-FAM-GGAGGCTCTCGGGACGACGGGGGATTTTCCTGATAGCCCGTCCCGCGGTAGTGTCCCGATGCTGCAATCGTAAGAAT-3’
-
Clone 9 for binding affinity study:
5’–56-FAM-GGAGGCTCTCGGGACGACCAGGATTTTCCCAATCTTGGTCCCGCTTTATGTGTCCCGATGCTGCAATCGTAAGAAT-3’
-
Sequence of Ln-aptamer:
5’–56-FAM-AGGCTCTCGGGACGACCAGTTGGTCCCGCTTTATGTGTCCCGAG-3’
-
Sequence of QS:
5’-GTCCCGAGAGCCT-Dab-3’
-
Sequence of random strand:
5’–56-FAM-AGGCTCTCGGGACGAC-(N20)- GTCCCGAG-3’
The sensor solution is a combination of 1:2 mole ratio of the Ln-aptamer and QS, respectively in SELEX buffer. Final assay concentration after the analytes are added is 100 nM of Ln-aptamer and 200 nM of QS.
Analyte detection with aptamers
All fluorescence measurements were performed in 384-well plates (Corning 3575, Fisher Scientific, Inc) with a total volume 40–45 µL on a plate reader (BioTek Synergy™ H1, excitation wavelength of 485 nm and the emission monitored at 528 nm). All analytes tested (GdCl3, metal ions, anions, other small molecules, DOTA, DTPA, Gd-DTPA and Gd-DOTA) were dissolved in the SELEX buffer and prepared by serial dilution to obtain the final desired concentrations. The Ln-sensor solution was prepared fresh every time and prior to adding the analytes, the solution was heated at 95 °C for 5 minutes to denature the oligonucleotide strands, followed by slow cooling to room temperature (over 20 minutes) for optimal hybridization between Ln-aptamer and QS. Solutions containing the analytes in SELEX buffer were then added to the sensor and mixed thoroughly by pipetting the solution several times and incubated for ~10 minutes before fluorescence reading was taken (although we found that the fluorescence reading stabilized in less than 5 minutes). The final assay concentration of Ln-aptamer is 100 nM and QS is 200 nM (1:2 mole ratio). All graphs are plotted either as the average raw fluorescence reading of all assays (arbitrary units, a.u.) or the fluorescence fold change, with standard deviation as the y-error bars.
Xylenol orange assay
Studies were performed following the previously published procedure [15]. Briefly, the assay was carried out in acetate buffer (50 mM, pH 5.8) and the absorption of xylenol orange was measured at 433 nm and 573 nm in the presence of varying concentrations of analytes. The ratio of 573/433 nm absorbance is proportional to the concentration of Gd(III) ions.
Data plotting and Kd calculations
All 2D plots of fluorescence increase or quenching versus analyte concentrations were drawn on Prism 5.0 (GraphPad Software) and the value of analyte concentrations that bind to half of the aptamer for each experiment is obtained using the non-linear regression of saturation binding on one site. The overall Kd for the binding between Ln-aptamer and Gd(III) is derived following the equation Kd = ([Ln-aptamer][Gd(III)])/[Ln-aptamer-Gd(III)] [22]. This in turn, is calculated by Kd, eff1/Kd, eff2 where Kd, eff1 = ([Ln-aptamer][QS])/[Ln-aptamer-QS] and Kd, eff2 = ([Ln-aptamer-Gd(III)][QS])/([Ln-aptamer-QS][Gd(III)]).
Predicted aptamer structure
The stem-loop structures of the oligonucleotides are predicted using NUPACK [23] with the concentrations of metal ions in the buffer (Na+ and Mg2+) included in the parameters.
Results and Discussion
In vitro selection, cloning and sequencing
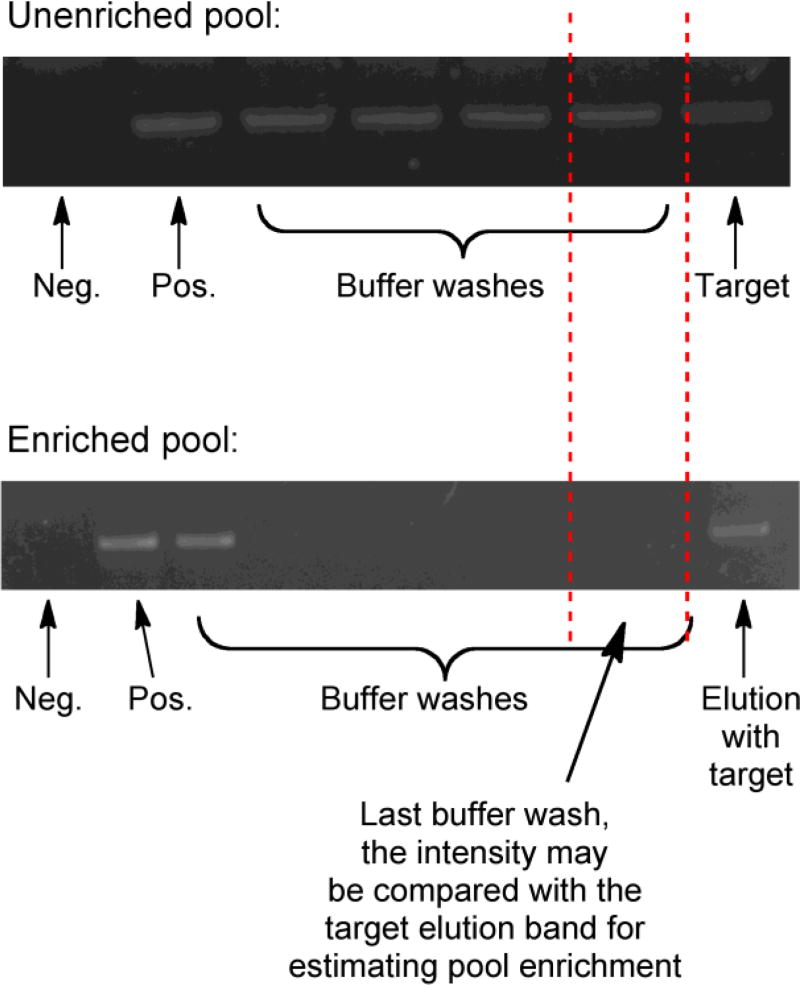
The progress of enrichment was monitored qualitatively by PCR amplification followed by gel electrophoresis. The selection condition was varied as shown below (Table 1). The oligonucleotide strands were initially incubated with 100 µM of target, a concentration that was ~3–4 orders of magnitude higher than the final desired target binding affinity. Each time pool enrichment was observed (indicated by the presence of relatively higher amount of amplifiable oligonucleotide strands in the target elution compared to the buffer washes, see Fig. 2), the target concentration was reduced by ~50 to 90%. In the final few rounds of selection, when the target concentration had been sufficiently lowered, counter selection against DOTA, DTPA, Gd-DOTA and Gd-DTPA was introduced to remove the strands that displayed affinity toward these potential interferents. The concentration of these negative selection targets was progressively increased to improve the selectivity of the isolated pool.
Table 1.
Selection conditions for the aptamers
| SELEX round no. | Target (GdCl3) concentration |
Counter selection |
|---|---|---|
| 1 | 100 µM | None |
| 2 – 4 | 50 µM | None |
| 5 – 6 | 25 µM | None |
| 7 – 10 | 10 µM | None |
| 11 – 13 | 1 µM | None |
| 14 – 16 | 100 nM | None |
| 17 – 21 | 10 nM | DOTA, DTPA, Gd-DOTA and Gd-DTPA (at 1 µM initially and up to 1 mM) |
Fig. 2.
Examples of raw images of PCR amplification of eluents collected during the SELEX process for monitoring pool enrichment. Top panel: before pool enrichment, both buffer and target elutions contain roughly similar amounts of amplifiable oligonucleotide as noted by the last buffer wash and the target elution bands which displayed almost equal intensity in the images. Bottom panel: when the pool is enriched, relative amounts of amplifiable oligonucleotides in the buffer washes and target elutions differed considerably, with a higher amount in the latter. Neg. = negative control (PCR reaction without the template) and Pos. = positive control with the pool used for the selection as the template in PCR
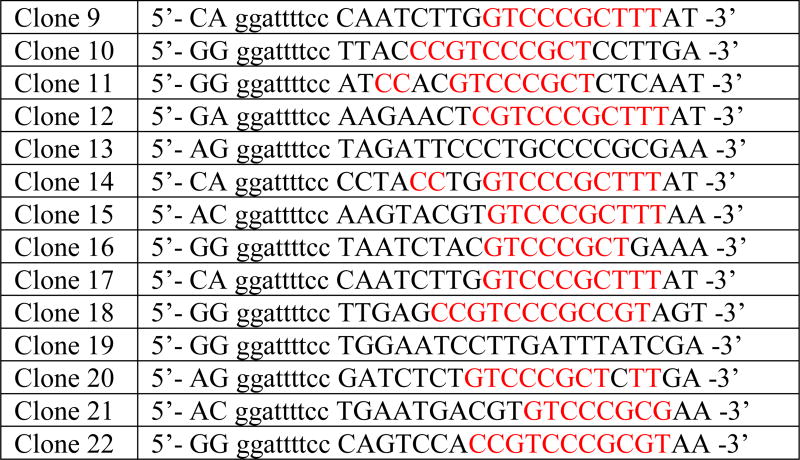
24 clones were randomly picked for sequencing and 22 full complete sequences were obtained (the other two yielded some unresolved base identities). The redundancy of copy numbers was analyzed (Table 2). All the clones have the conserved region at the beginning and at the end of the sequence (see Experimental section above), the lower case letters indicate the conserved region in the middle of the strand, and the capital letters show sequences from the random region (N2 and N20, see experimental section above), with the red letters indicating the consensus regions found across multiple clones. Out of 24 clones, we found 3 duplicate pairs (clones 4/15 and clones 5/22 and clones 9/17) and high consensus across most of them (highlighted in red).
Table 2.
Complete sequences of the 22 clones. The capital letters represent the randomized regions N2 and N20. The red letters indicate consensus sequences within the randomized regions
Binding studies
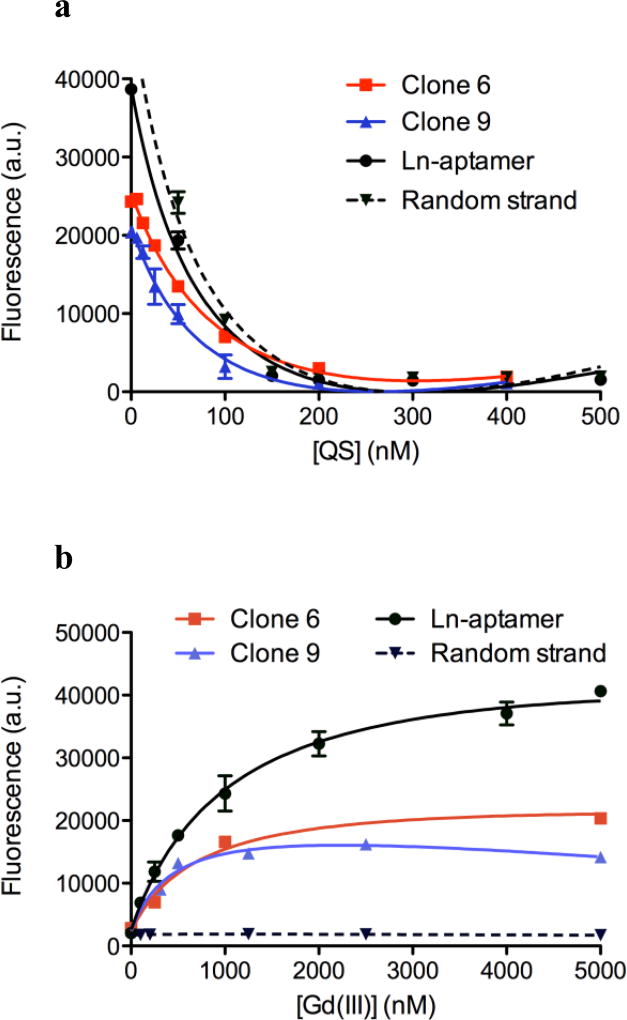
Due to the high frequency of the consensus regions, only two clones (6 and 9) were tested for their binding affinity toward Gd(III) ions. The study was carried out using the strategy [20,22] depicted in Fig. 1a, where the clone is tagged with a fluorescein molecule on the 5’ terminus. The quenching strand (QS) is 13-bases long, and is complementary to the 5’-end of the clone. It is modified with a quencher molecule (dabcyl) at the 3’-terminus. In the absence of the target (Gd(III) ion), the clone and the QS will hybridize, resulting in quenched fluorescence (a ‘dark’ sensor). The extent of quenching for all the oligonucleotide strands used in this study is shown in Fig. 3a Addition of Gd(III) ion will result in displacement of the QS, thus relieving the interaction between the fluorophore and the quencher molecules. This results in a fluorescence increase that is dependent on the concentration of aqueous Gd(III) ion (‘lighting up’ of the sensor, Fig. 3b). Clone 9 was found to have a slightly higher affinity than clone 6 (Kd of ~450 nM and ~700 nM, respectively) and the former was subsequently used as the basis for our sensor design.
Fig. 3.
Fluorescence is plotted as average raw fluorescence reading in a.u. (arbitrary units) ± standard deviation, n = 4 – 8 for each data point. All curves are fitted on Prism 5.0 (GraphPad Software) using the non-linear regression of one-site saturation binding. a Quenching of fluorescein on the oligonucleotide by dabcyl on QS. The concentration of the oligonucleotide is 50 nM for clones 6 and 9, and 100 nM for Ln-aptamer and random strand. At 200 nM of QS, > 95% of fluorescence is quenched. R2 > 0.9914 and P < 0.0003 for all four strands. b A plot showing fluorescence increase for clone 6, clone 9, and Ln-aptamer accompanying the displacement of QS by the target, which is proportional to the concentration of added aqueous Gd(III) ion. When a random strand is used (also 44 bases long and tagged with fluorescein, but the bases are randomized), no fluorescence change is observed (dashed line). Concentrations of clones 6 and 9 = 50 nM and for Ln-aptamer and random strand, 100 nM of each was used with 200 nM of QS. R2 = 0.9855 – 0.9988 and P < 0.0001 for all four strands
Sensor design
Based on the NUPACK prediction of clone 9 structure, a shortened clone (Ln-aptamer, Fig. 1b, with a conserved ‘loop’ region) was analyzed. To detect and quantify the amount of Gd(III) ions present in solution, the same strategy as the one for clones 6 and 9 above was used.
Detection and quantification of free Gd(III) ions in aqueous solution
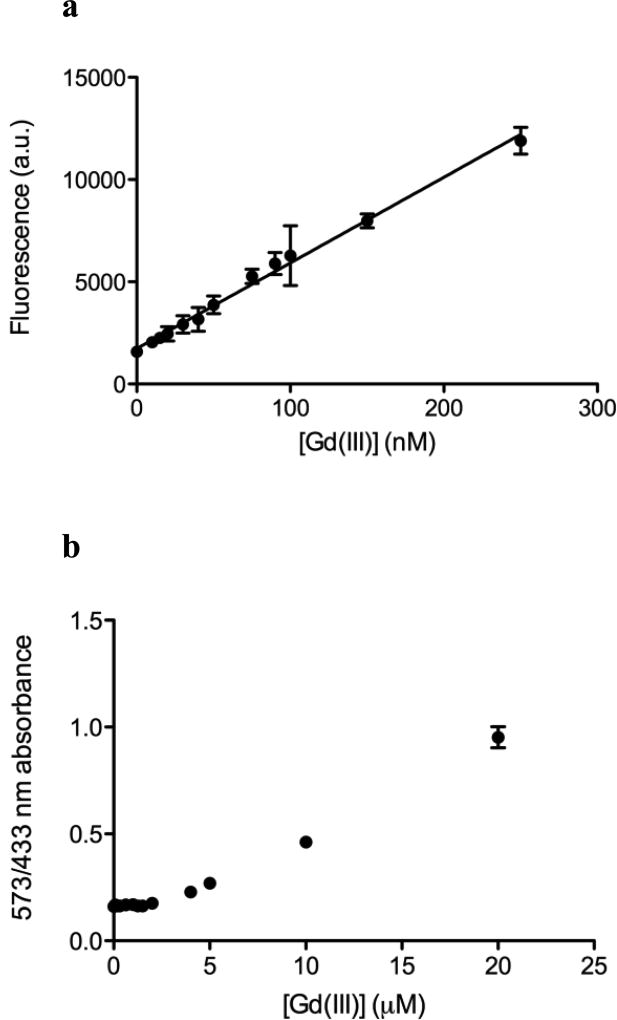
The shortened strand (Ln-aptamer) displays an affinity for the target (Fig. 3b, black circle marker) with Kd = ~330 nM, where Kd, eff1 = ~44 nM and Kd, eff2 = ~0.13. Using 100 nM of our sensor, a linear response is observed between 0 to 250 nM of [Gd(III)] (Fig. 4a), with a limit of detection of as low as ~80 nM (S/N = 3). At higher concentrations of Gd(III) (> ~10 µM), gradual quenching of fluorescence is observed with complete quenching at 100 µM; this result is to be expected as fluorescence loss in the presence of lanthanide ions is well established [24]. While this may limit the utility of our method for high concentrations of free Gd(III) ion, our main objective is to develop a sensor that can detect small amounts of impurity in MRI contrast agent solutions. As a comparison, the limit of detection of xylenol orange for free Gd(III) ion is found to be ~10 – 15 µM for S/N of ~3 (Fig. 4b).
Fig. 4.
a Fluorescence change of Ln-aptamer with increasing concentration of aqueous Gd(III) ion. The response is linear from 0 to 250 nM of Gd(III). R2 = 0.9935, P < 0.0001 (linear regression on Prism 5.0, Graphpad Software). The limit of detection (S/N = ~3) is at ~80 nM of Gd(III). All data are plotted as average raw fluorescence reading in arbitrary units (a.u.) ± standard deviation, n = 6. b Detection of aqueous Gd(III) ion using xylenol orange. The limit of detection is found to be ~10 – 15 µM (S/N = ~3) based on the change in ratio of absorbance at 573 and 433 nm
Selectivity of Ln-aptamer toward Gd(III) ion
There are two selectivity issues to be resolved. First is that Gd(III) should display a high affinity only toward the strand that has the sequence of nucleotides found in Ln-aptamer and second, that this strand is selective only for Gd(III) and not other metal ions. To address the former, we obtained a fluorescein-tagged aptamer strand that has equal number of bases as Ln-aptamer, but with a randomized sequence in the loop region (random strand). This strand has the same initial 5’ sequence to allow hybridization with QS. We observed no fluorescence increase with Gd(III) ions and the randomized sequence strand (Fig. 3b, dashed line), demonstrating the selectivity of Gd(III) ion for the Ln-aptamer.
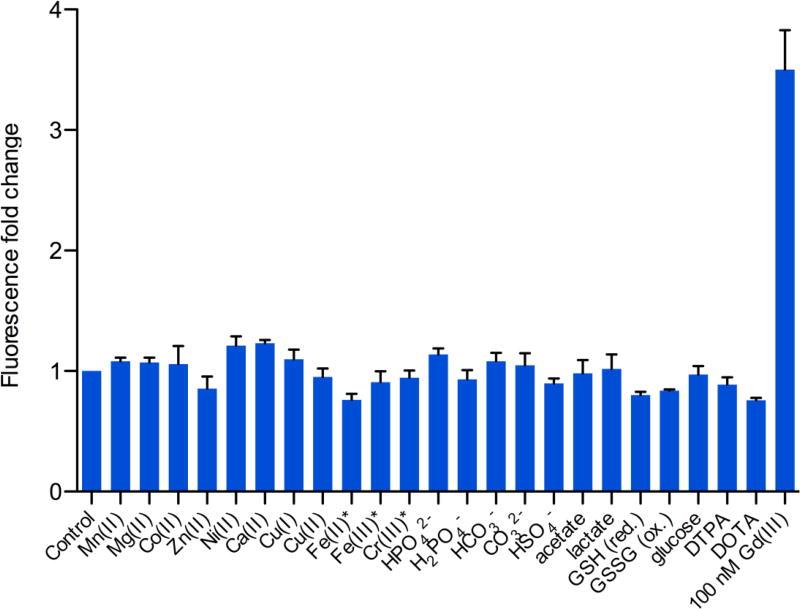
Subsequently, Ln-aptamer was tested against several biologically important metal ions: Mn(II), Mg(II), Co(III), Zn(II), Ni(II), Ca(II), Cu(I), Cu(II), Fe(II), Fe(III) and Cr(III) ions. There was no change in fluorescence between 0 – 400 µM (except for Cr(III), Fe(II) and Fe(III)) of these metal ions (Fig. 5). With Cr(III), Fe(II) and Fe(III), the fluorescence fold change shown is for 50 µM, as at higher concentrations, fluorescence quenching was observed. The fold change is calculated as the ratio over the background fluorescence in the absence of Gd(III). However, not surprisingly, Ln-aptamer displays a similar affinity toward other lanthanide ions (for example Tb(III) and Eu(III)), which have very similar ionic radii, coordination chemistry, and comparable binding constants toward many ligands [25]. The Ln-aptamer is therefore, selective for unchelated Ln(III) ions, while not exclusively specific for Gd(III). Nevertheless, since these Ln(III) ions are not naturally occurring biologically, or during the synthesis of GBCAs, our sensor may still be used to conveniently determine the presence of low concentrations of unchelated Gd(III) impurity in solutions containing contrast agents. To further demonstrate the selectivity, the potential interference from other small molecules commonly found in buffer solutions and biological fluids was investigated. Fig. 5 shows the absence of response of Ln-aptamer to a variety of common biological anions and neutral molecules (a range of concentrations from 0 up to 1 mM of H2PO4−, HPO42−, HSO4−, HCO3−, CO32−, lactate, acetate, reduced and oxidized glutathione, and 5 mM of glucose). While this list of anions is not exhaustive, it encompasses a wide range of chemical and structural variations, demonstrating the marked preference of Ln-aptamer for Ln(III) ions over other analytes.
Fig. 5.
Fluorescence fold change of Ln-aptamer with different metal ions, anions, DTPA, DOTA and glucose. Fold change is calculated by normalizing the fluorescence reading to the control (Ln-aptamer-QS mixture in buffer). In all cases, the fluorescence unit readings range only from ~2000 – ~4000 a.u. No significant change is observed with any of the tested analytes. As a comparison, the change with 100 nM of aqueous Gd(III) is ~3.5 fold. Concentration of the analytes used: 400 µM of the metal ions, *: 50 µM for Fe(III), Cr(III) and Fe(II), 1 mM of all the anions, 5 mM of glucose, and 1 mM of DTPA and DOTA ligands. Data is plotted as average fold change ± standard deviation, n = 4 – 6
Detection of free Gd(III) ions in solutions containing Gd(III) chelates
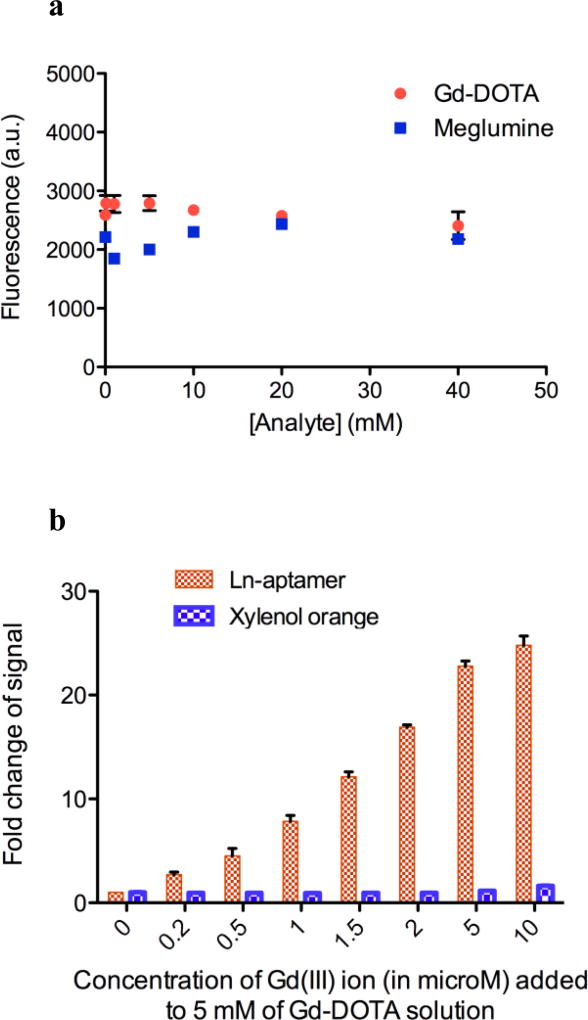
Two commonly used complexes in MRI are Gd-DTPA (gadopentate dimeglumine, Magnevist®) and Gd-DOTA (gadoterate meglumine, Dotarem®). To verify the utility of the aptamer in detecting small amounts of free Gd(III) in solutions containing these MRI complexes, the affinity of the aptamer for the free ligands (DOTA and DTPA molecules) was first determined (Fig. 5). Next, the aptamer was tested with commercially purchased Gd-DOTA solid and meglumine. At concentrations of 0 – 40 mM of both analytes, no change in Ln-aptamer fluorescence was observed (Fig. 6a).
Fig. 6.
a Ln-aptamer does not significantly bind to meglumine and Gd-DOTA, as evidenced by the absence of fluorescence in the presence of these analytes. Data is plotted as average fluorescence reading (a.u.) ± standard deviation, n = 6. b Fold change of fluorescence (for Ln-aptamer) and 573/433 nm absorbance ratio (for xylenol orange) of 5 mM Gd-DOTA solutions spiked with GdCl3. Data is plotted as average fold change ± standard deviation, n = 6
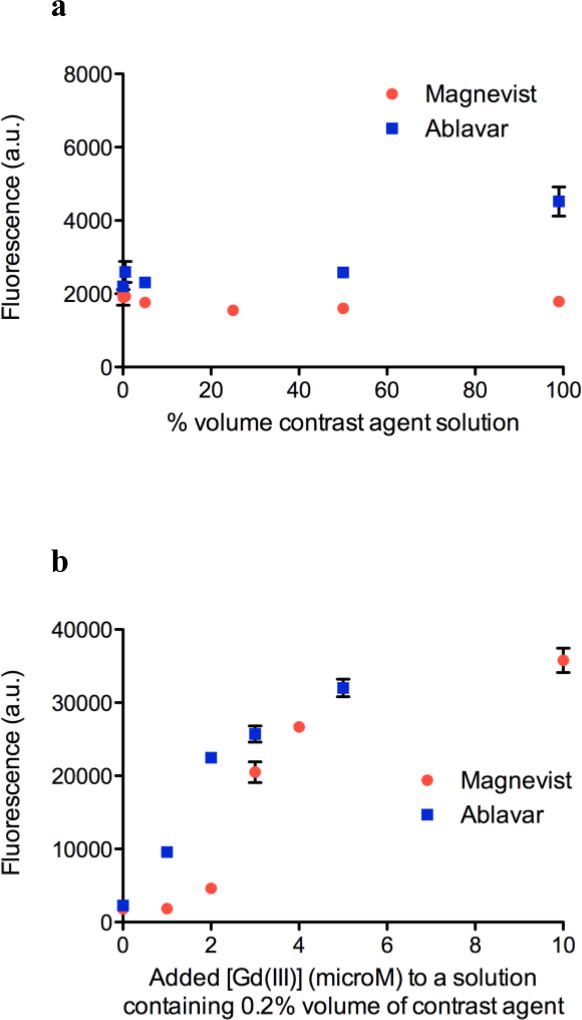
Consequently, we decided to spike 5 mM Gd-DOTA solution with varying concentrations of GdCl3 to mimic the presence of Gd(III) ion impurity. The choice of 5 mM is semi-arbitrary; it is high enough to demonstrate the ability of Ln-aptamer to detect low concentrations of Gd(III) ion in the presence of large excess of the chelated ion, and yet is still within the limit of the assay buffer capacity. As expected, the emission at 528 nm increased, with a change that is noticeable with as low as 200 nM of the added Gd(III) (S/N = ~3, Fig. 6b). To further validate our method, a comparison with the xylenol orange test was carried out; similar results were obtained with the change in the 573/433 nm absorbance ratios becoming noticeable between at around 10 µM (S/N = ~1.7) of added GdCl3. Finally, the sensor was tested using commercial Magnevist® (Bayer) and Ablavar® (Lantheus Medical Imaging) solutions. Magnevist contains 500 mM Gd-DTPA dimeglumine, and excess meglumine (~5 mM) and DTPA ligand (~1 mM). Ablavar’s formulation consists of 250 mM gadofosveset trisodium and ~0.36 mM of fosveset. There was minute interference from the matrix (Fig. 7a), and only a slight increase in fluorescence (~2-fold) with 99% v/v Ablavar. While further studies need to be carried out to determine the exact nature of this phenomenon, one postulation is the presence of a π-π stacking interaction between the two aromatic rings in the free ligand (fosveset) and the nucleobases. We subsequently spiked a 0.2% volume of each contrast agent solution with aqueous Gd(III) ion to determine if Ln-aptamer may be used to directly detect the presence of impurities in clinical formulations. Magnevist and Ablavar solutions contain excess DTPA and fosveset ligands, respectively, and these will chelate the aqueous Gd(III) ion used to spike the samples. In order to avoid working with high [Gd(III)] (this may potentially quench the fluorescence), we used 0.2% volume, which translated to ~2 µM and ~720 nM of excess DTPA and fosveset. As expected, no fluorescence change was seen up until > ~1 – 2 µM of added Gd(III), since below this concentration, the ion would immediately react with the ligands, and the resulting complex would not bind to Ln-aptamer (Fig. 7b). We have thus, demonstrated the applicability of the aptamer for detecting free Gd(III) ion in aqueous solutions containing GBCAs and other components in the formulation.
Fig. 7.
All data points are plotted as average fluorescence reading (a.u.) ± standard deviation, n = 4 – 6. a Constant fluorescence reading (< 2-fold change) of Ln-aptamer in solutions containing different vol % of Magnevist® and Ablavar®, indicating the lack of reactivity between Ln-aptamer and the compounds found in the formulation of the contrast agent. b Increase in fluorescence of Ln-aptamer is observed when excess aqueous Gd(III) ion is added to a solution containing Magnevist® and Ablavar®, demonstrating the response of the sensor to free Gd(III) in a GBCA solution
Conclusion
The advent of more advanced technology such as higher magnetic field equipment and multimodal instrumentation (e.g. CT-MRI) has inevitably led to the growth of MRI in clinical diagnosis. This in turn, will benefit greatly from research studies into the development of safer and more efficacious MRI contrast agents. The first criterion for ensuring the safety of these compounds is to achieve a very high level of purity. This paper presents a convenient and sensitive method for measuring and detecting free Gd(III) impurity in GBCA solutions. In order to design a sensor that possesses a desirable balance of selectivity, sensitivity, ease of use and cost, we explored aptamers (single-stranded DNA molecules) as a possible targeting moiety for the lanthanide ions. Aptamers have been known to exhibit high selectivity and binding affinity for the target that they have been selected for, well into the nanoMolar range [26]. Through a modified SELEX procedure, a 44-base long Ln-aptamer was isolated, which was subsequently adapted into a fluorogenic sensor (conferring higher sensitivity due to extremely low background signal) for aqueous Gd(III) ion (Figs 1a and b) [20, 22]. This assay can be carried out in 384-well plate format, and in cases where a fluorescent plate reader is not available, a cuvette-based fluorometer measurement may be carried out. Table 3 shows a summary of our data, along with those for two other optical spectroscopy-based techniques (xylenol orange and calcein blue). Compared to chromatography and mass spectrometric based methods, our Ln-aptamer has the major disadvantage of being unable to simultaneously detect the presence of Gd(III) complexes of different structures (e.g. Gd-DOTA and Gd-DTPA), thus limiting its utility for exhaustive quantification of the different species in a matrix. However, it may aid in identifying if free Gd(III) or other trivalent lanthanide ion is present in the matrix. In the context of novel GBCA synthesis for research application, the low detection limit of Ln-aptamer (~80 nM) will help ensure a high level of purity of the material. Furthermore, the Ln-aptamer assay requires minimal sample preparation and more affordable instrumentation, and will be valuable to the community involved especially in the early stages of GBCAs development. Due to its relative unreactivity toward many other metal ions, this assay may be used with a variety of buffer solutions and even to determine the extent of transmetallation of Gd complexes, which is a frequently raised issue with GBCAs [1,27].
Table 3.
Summary of optical spectroscopy based methods for detecting aqueous Ln(III) ions
| Gd-sensor | Xylenol orange [15] | Calcein blue [14] | |
|---|---|---|---|
| Desired limit of detection | As low as possible to ensure higher purity of synthesized GBCAs | ||
| Limit of detection of Gd(III) (S/N = ~3) | ~80 nM | ~10 – 15 µM | ~100 nM |
| Reactivity toward other common metal cations, anions and neutral small molecules | Significantly less reactive than toward the Ln(III) ions | Not tested in this study. However, it is a commonly used complexometric agent for metal cations | React with various metal cations including Ca(II), Mg(II), Fe(II), Mn(II) and Ni(II) |
| Method of detection and quantification | Increase in fluorescence signal intensity | Change in absorbance ratio at two different wavelengths | Quenching of fluorescence |
Acknowledgments
We would like to gratefully acknowledge Dr. Milan N Stojanovic from Columbia University, New York, NY 10032 for valuable and inspiring scientific advice and discussion, and Dr. David Saloner and Dr. Bonnie Joe from the University of California San Francisco, Department of Radiology and Biomedical Imaging for the kind and generous donation of all the clinical contrast agents used. This work is supported by funding from the National Institute of Health (R21EB013347), California State University East Bay (CSUEB) and CSUEB Faculty Support Grant-Mentoring Student Researcher. O.E. was supported by the CSUEB Center for Student Research (CSR) Fellowship.
Footnotes
We find no less than 4 recent examples of different research groups working on the development of novel MRI contrast agents, in which the xylenol orange assay was used to determine the purity of the synthesized agents. This list is by no means comprehensive and updated, as we did not look for all publications on Gd-based MRI CAs. For examples of articles published by these groups, please see references 16–19.
Conflict of interest
The authors declare that they have no conflict of interest.
References
- 1.Sherry AD, Caravan P, Lenkinski RE. A primer on gadolinium chemistry. J Magn Reson Imaging. 2009;30:1240–8. doi: 10.1002/jmri.21966. [DOI] [PMC free article] [PubMed] [Google Scholar]
- 2.Cheong Benjamin YC, Muthupillai R. Nephrogenic Systemic Fibrosis A Concise Review for Cardiologists. Tex Heart Inst J. 2010;37:508–15. [PMC free article] [PubMed] [Google Scholar]
- 3.Aime S, Caravan PJ. Biodistribution of gadolinium-based contrast agents, including gadolinium deposition. Magn Reson Imaging. 2009;30:1259–67. doi: 10.1002/jmri.21969. [DOI] [PMC free article] [PubMed] [Google Scholar]
- 4.Kümmerer K, Helmers E. Hospital Effluents as a Source of Gadolinium in the Aquatic Environment. Environ Sci Technol. 2000;34:573–577. [Google Scholar]
- 5.Birka M, Wehe CA, Telgmann L, Sperling M, Karst U. Sensitive quantification of gadolinium-based magnetic resonance imaging contrast agents in surface waters using hydrophilic interaction liquid chromatography and inductively coupled plasma sector field mass spectrometry. J Chromatogr A. 2013;1308:125–31. doi: 10.1016/j.chroma.2013.08.017. [DOI] [PubMed] [Google Scholar]
- 6.Badger DA, Kuester RK, Sauer JM, Sipes IG. Gadolinium chloride reduces cytochrome P450: relevance to chemical-induced hepatotoxicity. Toxicology. 1997;121(2):143–53. doi: 10.1016/s0300-483x(97)00065-6. [DOI] [PubMed] [Google Scholar]
- 7.Koop DR, Klopfenstein B, Iimuro Y, Thurman RG. Gadolinium chloride blocks alcohol-dependent liver toxicity in rats treated chronically with intragastric alcohol despite the induction of CYP2E1. Mol Pharm. 1997;51:944–50. doi: 10.1124/mol.51.6.944. [DOI] [PubMed] [Google Scholar]
- 8.Xia Q, Feng XD, Yuan L, Wang K, Yang XD. Brain-derived neurotrophic factor protects neurons from GdCl3-induced impairment in neuron-astrocyte co-cultures. Sci China Chem. 2010;53:2193–9. [Google Scholar]
- 9.Künnemeyer J, Terborg L, Nowak S, Scheffer A, Telgmann L, Tokmak F, Günsel A, Wiesmüller G, Reichelt S, Karst U. Speciation analysis of gadolinium-based MRI contrast agents in blood plasma by hydrophilic interaction chromatography/electrospray mass spectrometry. Anal Chem. 2008;80:8163–70. doi: 10.1021/ac801264j. [DOI] [PubMed] [Google Scholar]
- 10.Cleveland D, Long SE, Sander LC, Davis WC, Murphy KE, Case RJ, Rimmer CA, Francini L, Patri AK. Chromatographic methods for the quantification of free and chelated gadolinium species in MRI contrast agent formulations. Anal Bioanal Chem. 2010;398:2987–95. doi: 10.1007/s00216-010-4226-2. [DOI] [PubMed] [Google Scholar]
- 11.Raju CSK, Cossmer A, Scharf H, Panne U, Lück D. Speciation of gadolinium based MRI contrast agents in environmental water samples using hydrophilic interaction chromatography hyphenated with inductively coupled plasma mass spectrometry. J Anal At Spectrom. 2010;25:55–61. [Google Scholar]
- 12.Lindner U, Lingott J, Richter S, Jakubowski N, Panne U. Speciation of gadolinium in surface water samples and plants by hydrophilic interaction chromatography hyphenated with inductively coupled plasma mass spectrometry. Anal Bioanal Chem. 2013;405:1865–73. doi: 10.1007/s00216-012-6643-x. [DOI] [PubMed] [Google Scholar]
- 13.Telgmann L, Sperling M, Kasrt U. Determination of gadolinium-based MRI contrast agents in biological and environmental samples: a review. Anal Chim Acta. 2013;746:1–16. doi: 10.1016/j.aca.2012.12.007. [DOI] [PubMed] [Google Scholar]
- 14.Brittain HG. Submicrogram determination of lanthanides through quenching of calcein blue fluorescence. Anal Chem. 1987;59:1122–4. [Google Scholar]
- 15.Barge A, Cravotto G, Gianolio E, Fedeli F. How to determine free Gd and free ligand in solution of Gd chelates. A technical note. Contrast Media Mol Imaging. 2006;1:184–8. doi: 10.1002/cmmi.110. [DOI] [PubMed] [Google Scholar]
- 16.Ye Z, Wu X, Tan M, Jesberger J, Griswold M, Lu ZR. Synthesis and evaluation of a polydisulfide with Gd-DOTA monoamide side chains as a biodegradable macromolecular contrast agent for MR blood pool imaging. Contrast Media Mol Imaging. 2013;8:220–8. doi: 10.1002/cmmi.1520. [DOI] [PMC free article] [PubMed] [Google Scholar]
- 17.Goswami LN, Ma L, Kueffer PJ, Jalisatgi SS, Hawthorne MF. Synthesis and relaxivity studies of a DOTA-based nanomolecular chelator assembly supported by an icosahedral closo-B122− core for MRI: a click chemistry approach. Molecules. 2013;18:9034–48. doi: 10.3390/molecules18089034. [DOI] [PMC free article] [PubMed] [Google Scholar]
- 18.Abada S, Lecointre A, Eihabiri M, Esteban-Gómez D, Platas-Iglesias C, Tallec G, Mazzanti M, Charbonnière LJ. Highly relaxing gadolinium based MRI contrast agents responsive to Mg2+ sensing. Chem Commun. 2012;48:4085–7. doi: 10.1039/c2cc30757j. [DOI] [PubMed] [Google Scholar]
- 19.Bernard ED, Beking MA, Rajamanickam K, Tsai EC, DeRosa MC. Target binding improves relaxivity in aptamer-gadolinium conjugates. J Biol Inorg Chem. 2012;17:1159–75. doi: 10.1007/s00775-012-0930-z. [DOI] [PubMed] [Google Scholar]
- 20.Rajendran M, Ellington AD. Selection of fluorescent aptamer beacons that light up in the presence of zinc. Anal Bioanal Chem. 2008;390:1067–75. doi: 10.1007/s00216-007-1735-8. [DOI] [PubMed] [Google Scholar]
- 21.Nutiu R, Li Y. In vitro selection of structure-switching signaling aptamer. Angew Chem Int Ed. 2005;44:1061–5. doi: 10.1002/anie.200461848. [DOI] [PubMed] [Google Scholar]
- 22.Yang KY, Barbu M, Halim M, Pallavi P, Kim B, Kolpashchikov D, Pecic S, Taylor S, Worgall T, Stojanovic MN. Recognition and sensing of low-epitope targets via ternary complexes with oligonucleotides and synthetic receptors. Nat Chem. 2014;6:1003–8. doi: 10.1038/nchem.2058. [DOI] [PMC free article] [PubMed] [Google Scholar]
- 23.Zadeh JN, Steenberg CD, Bois JS, Wolfe BR, Pierce MB, Khan AR, Dirks RM, Pierce NA. NUPACK: analysis and design of nucleic acid systems. J Comput Chem. 2011;32:170–3. doi: 10.1002/jcc.21596. [DOI] [PubMed] [Google Scholar]
- 24.Shakhverdov TA. A cross-relaxation mechanism of fluorescence quenching in complexes of lanthanide ions with organic ligands. Opt Spectrosc. 2003;95:571–80. [Google Scholar]
- 25.Bunzli J-CG. Review: Lanthanide coordination chemistry: from old concepts to coordination polymers. J Coord Chem. 2014;67:3706–33. [Google Scholar]
- 26.McKeague M, DeRosa MC. Challenges and opportunities for small molecular aptamer development. J Nucleic Acids. 2012;2012:748913. doi: 10.1155/2012/748913. [DOI] [PMC free article] [PubMed] [Google Scholar]
- 27.Hao D, Ai T, Goerner F, Hu X, Runge VM, Tweedle M. MRI contrast agents: basic chemistry and safety. J Magn Reson Imaging. 2012;36:1060–71. doi: 10.1002/jmri.23725. [DOI] [PubMed] [Google Scholar]


