Abstract
Purpose
Treatment of oropharyngeal squamous cell carcinoma (OPSCC) is evolving toward risk-based modification of therapeutic intensity, which requires patient-specific estimates of overall survival (OS) and progression-free survival (PFS).
Methods
To develop and validate nomograms for OS and PFS, we used a derivation cohort of 493 patients with OPSCC with known p16 tumor status (surrogate of human papillomavirus) and cigarette smoking history (pack-years) randomly assigned to clinical trials using platinum-based chemoradiotherapy (NRG Oncology Radiation Therapy Oncology Group [RTOG] 0129 and 0522). Nomograms were created from Cox models and internally validated by use of bootstrap and cross-validation. Model discrimination was measured by calibration plots and the concordance index. Nomograms were externally validated in a cohort of 153 patients with OPSCC randomly assigned to a third trial, NRG Oncology RTOG 9003.
Results
Both models included age, Zubrod performance status, pack-years, education, p16 status, and T and N stage; the OS model also included anemia and age × pack-years interaction; and the PFS model also included marital status, weight loss, and p16 × Zubrod interaction. Predictions correlated well with observed 2-year and 5-year outcomes. The uncorrected concordance index was 0.76 (95% CI, 0.72 to 0.80) for OS and 0.70 (95% CI, 0.66 to 0.74) for PFS, and bias-corrected indices were similar. In the validation set, OS and PFS models were well calibrated, and OS and PFS were significantly different across tertiles of nomogram scores (log-rank P = .003;< .001).
Conclusion
The validated nomograms provided useful prediction of OS and PFS for patients with OPSCC treated with primary radiation-based therapy.
INTRODUCTION
Tumor human papillomavirus (HPV) status is an independent predictor of survival for patients with oropharyngeal squamous cell carcinoma (OPSCC).1 Indeed, the combination of tumor HPV status, lifetime tobacco cigarette smoking (in pack-years), and tumor and nodal stage can be used to stratify patients into groups at high, intermediate, or low risk of death.2,3 This NRG Oncology Radiation Therapy Oncology Group (RTOG) 0129 risk model is the basis of two divergent pathways for risk-based clinical trials in OPSCC, including therapeutic de-intensification for the low-risk group versus therapeutic intensification for the intermediate- and high-risk groups.
Although the NRG Oncology RTOG 0129 risk model includes factors most influential for survival, it does not account for several known prognostic factors (eg, age, performance status). Consequently, the survival probabilities in the three risk groups have limited ability to predict survival for an individual patient. Nomograms are graphic depictions of models that can be used to estimate a numeric probability of an event (eg, death or progression) for an individual patient. An additional advantage of a nomogram relative to the RTOG 0129 risk model is the ability to provide a visual interface to aid in communication with patients.4 We developed and validated a nomogram for prediction of overall survival (OS) and progression-free survival (PFS) for patients with local-regionally advanced OPSCC treated with primary radiotherapy with or without concurrent chemotherapy, inclusive of data from NRG Oncology RTOG 0129.
METHODS
Study Populations
The derivation cohort consisted of patients with OPSCC with known tumor p16 status and smoking history (measured in pack-years) who were randomly assigned to two clinical trials conducted by the NRG Oncology RTOG, 0129 and 0522.2,5,6 NRG Oncology RTOG 0129 was a phase III trial that evaluated standard fractionation versus accelerated fractionation (AFX) radiotherapy concurrent with cisplatin. NRG Oncology RTOG 0522 was a phase III trial that evaluated the addition of cetuximab to AFX radiotherapy concurrent with cisplatin. Eligible patients had untreated, pathologically confirmed, American Joint Committee on Cancer (AJCC) 5th edition (RTOG 0129) or 6th edition (RTOG 0522) stage III to IV7 head and neck squamous cell carcinoma, Zubrod performance status of 0 to 1, age ≥ 18 years, and adequate bone marrow, hepatic, and renal function.
The validation cohort consisted of patients with OPSCC with known tumor p16 status and smoking history who were randomly assigned to NRG Oncology RTOG 9003, a phase III trial that evaluated standard fractionation versus concomitant boost versus split-course AFX versus hyperfractionation.8 Eligible patients had untreated, pathologically confirmed, stage II to IV7 head and neck squamous cell carcinoma, Zubrod performance status of 0 to 2, and age ≥ 18 years.
History of cigarette smoking in pack-years was obtained at enrollment by an interviewer-administered questionnaire. Patients were followed prospectively to assess disease status with physical examination and imaging studies performed quarterly for 2 years, biannually through year 5, and then annually.
Tumor p16 expression was evaluated by immunohistochemistry using a mouse monoclonal antibody (MTM Laboratories, Heidelberg, Germany), visualized with the Ventana XT autostainer using the one-view secondary detection kit (Ventana Medical Systems, Tucson, AZ).9 Tumor p16 expression was scored as positive if strong and diffuse nuclear and cytoplasmic staining was present in ≥ 70% of the tumor cells.10,11 Testing and interpretation were centralized. P16 tumor status is a reliable surrogate for HPV tumor detection in the oropharynx.10 Protocol approval was received from the institutional review board at each study site, and informed consent was obtained from each patient before participation.
Statistical Analysis
The demographic and clinical characteristics of patients in NRG Oncology RTOG 0129 and 0522 included and excluded from the analysis were compared by Fisher’s exact test. The principal outcomes of interest included the predicted probability of 2-year or 5-year overall OS or PFS on the basis of baseline characteristics. OS and PFS were defined, respectively, as time from date of randomization to death from any cause and to local, regional, or distant progression or death from any cause. The distributions of OS and PFS were estimated by the Kaplan-Meier method12 and compared by log-rank test stratified by trial.13 Cox proportional hazards models14 (stratified by trial) were used to estimate hazard ratios and 95% CIs. Baseline prognostic factors of interest included age, gender, race, marital status, education, Zubrod performance status, anemia, tobacco pack-years, primary tumor subsite, T stage, N stage, comorbidity score, weight loss, gastric tube placement, and tumor p16 status. Categorical variables were included in our analysis to align with the prior literature. Given the significant influence of the RTOG 0129 recursive partitioning analysis, cigarette smoking was categorized consistent with that model.2 In addition, data regarding weight loss was collected as a categorical variable, and anemia was defined as a hemoglobin level ≤ 13.5 g/dL for men and ≤ 12.5 g/dL for women per RTOG 9903.15 All two-way interactions were evaluated, and final models for OS and PFS were selected based on clinical judgment and by comparison of Akaike information criterion. The final OS and PFS models were internally validated by use of bootstrap with 200 or 400 resamples and cross-validation methods leaving 10 or 20 samples out at each iteration and served as the basis for creation of the nomograms.16 As is standard, points assigned to each variable included in the nomogram were assigned proportional to the effect size.
The accuracy of predictions was evaluated by estimating the model’s calibration, and discrimination was measured by the concordance index (C-index).16 The C-index is the probability that for two randomly selected patients, the patient who experienced the event first had a higher probability of having the event according to the model. A C-index of 0.5 represents agreement by chance alone, and a C-index of 1 means perfect discrimination.
A validation cohort from NRG Oncology RTOG 9003 was used to externally validate the models. A total risk score was calculated for each patient in the combined cohort of NRG Oncology RTOG 0129 and 0522. Tertiles of the total risk scores were then used to classify patients from NRG Oncology RTOG 9003 into three groups. The Cox model was used to compare whether the survival distributions differed among the three risk groups. All analyses were performed using SAS (SAS Institute, Cary, NC) and R 3.2.3. All P are two-sided and multiple comparisons are adjusted based on the Westfall method.17
RESULTS
Derivation Cohort
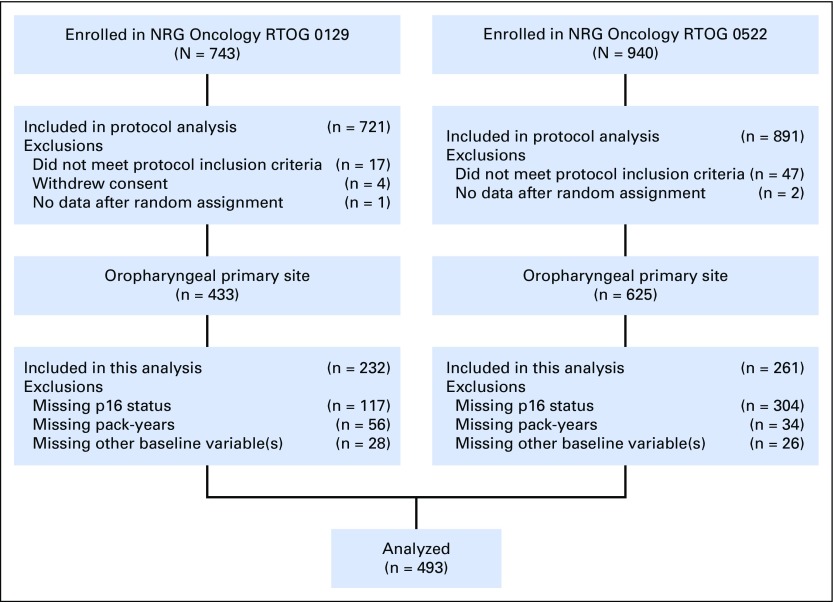
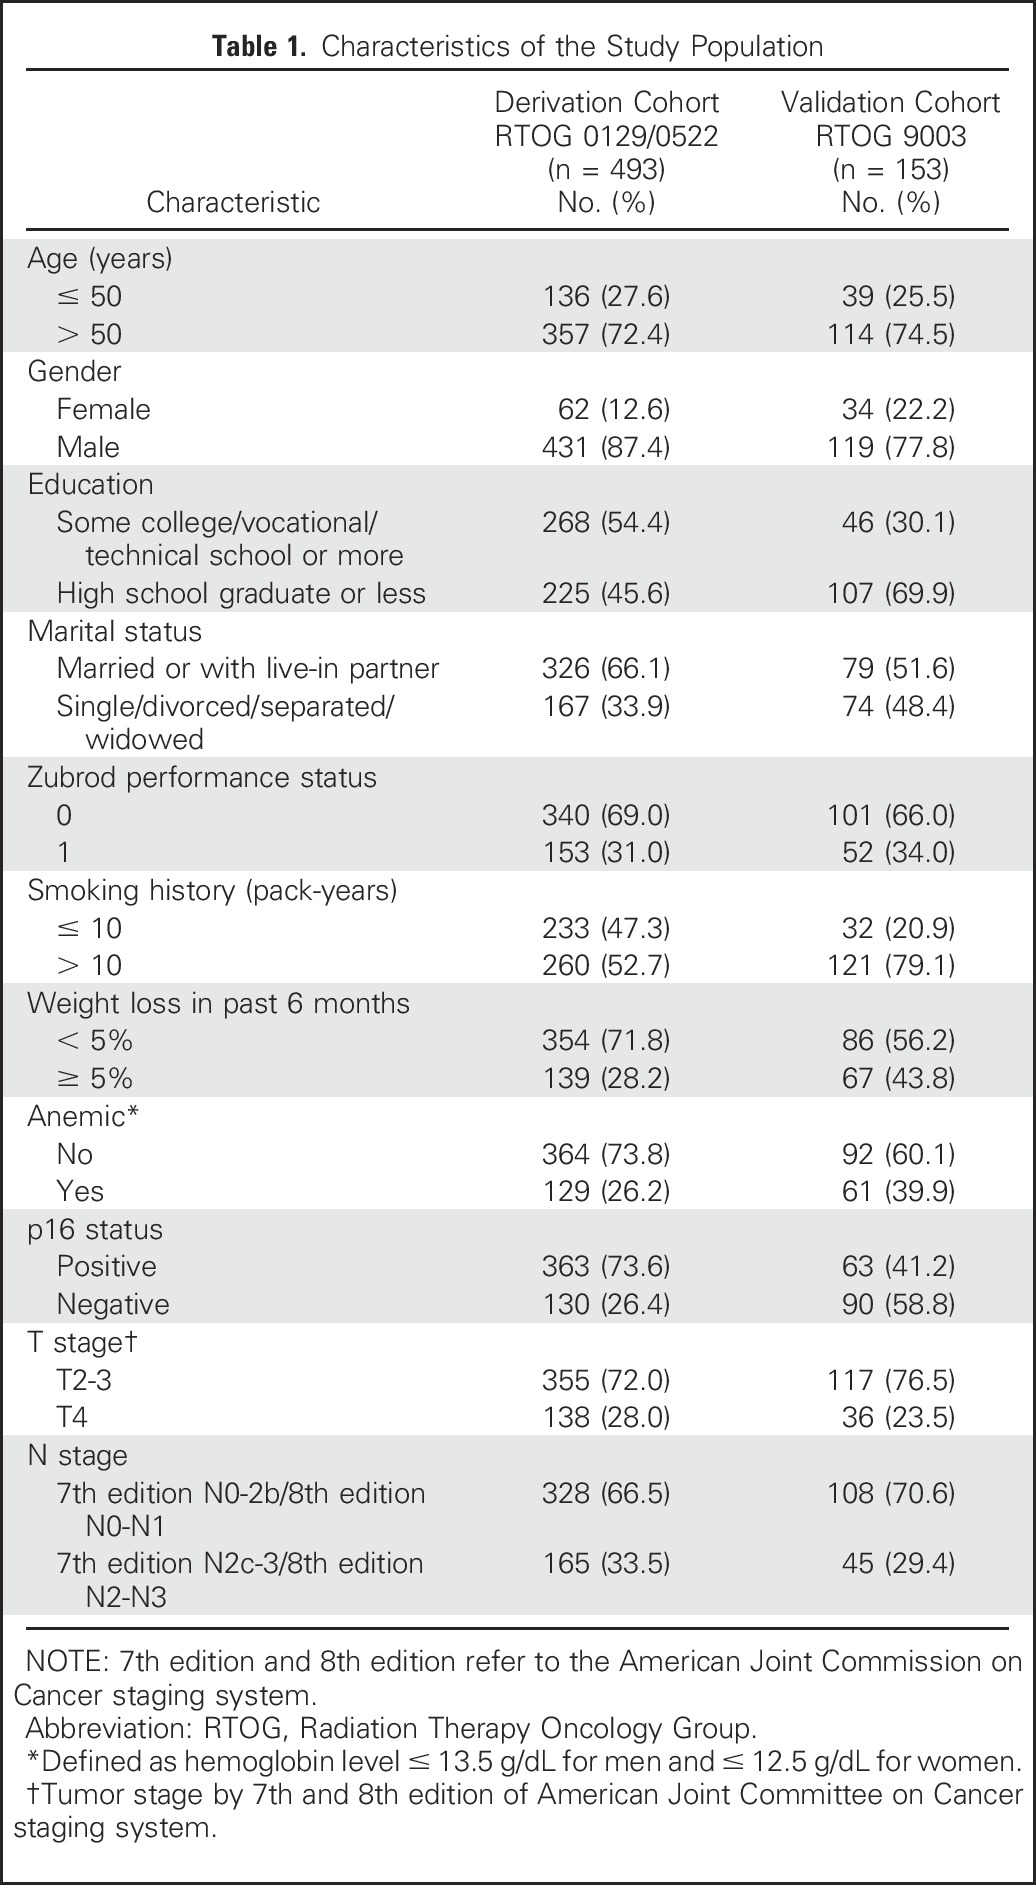
A total of 493 of 1,058 patients with OPSCC treated in NRG Oncology RTOG 0129 and NRG Oncology RTOG 0522 had known tumor p16 tumor status and pack-years of cigarette smoking and therefore comprised the derivation cohort (Appendix Fig A1, online only). Patients included were similar to patients excluded from the analysis, with the exception that in RTOG 0129, they were significantly less likely to have p16-negative tumors (Data Supplement). The baseline characteristics of the derivation and validation cohorts are listed in Table 1.
Table 1.
Characteristics of the Study Population
Overall Survival
Median follow-up was 8.0 years (95% CI, 7.9 to 8.1 years) in NRG Oncology RTOG 0129, 4.8 years (95% CI, 4.5 to 5.0 years) in NRG Oncology RTOG 0522, and 5.7 years (95% CI, 5.2 to 6.0 years) for the derivation cohort. A total of 151 deaths occurred during follow-up. Estimated 2-year and 5-year OS were 83.6% (95% CI, 80.0% to 86.6%) and 72.0% (95% CI, 67.6% to 75.8%), respectively.
The final model for OS is listed in Table 2. In multivariable analysis, factors found to be significantly associated with OS included age, cigarette smoking pack-years, Zubrod performance status, education, anemia, tumor p16 tumor status, T stage, and N stage. A significant interaction was observed between age and tobacco pack-years (P-interaction = .02). Age older than 50 years significantly increased the risk of death for individuals with ≤ 10 pack-years (hazard ratio [HR], 5.94; 95% CI, 2.11 to 16.70; P < .001), but not > 10 pack-years (HR, 1.55; 95% CI, 0.96 to 2.51; P = .07) of tobacco exposure. Moreover, > 10 pack-years of tobacco exposure significantly increased the risk of death for individuals ≤ 50 years of age (HR, 4.81; 95% CI, 1.64 to 14.11; P = .004), but not > 50 years (HR, 1.26; 95% CI, 0.84 to 1.89; P = .27).
Table 2.
Overall and Progression-Free Survival Models for Nomograms
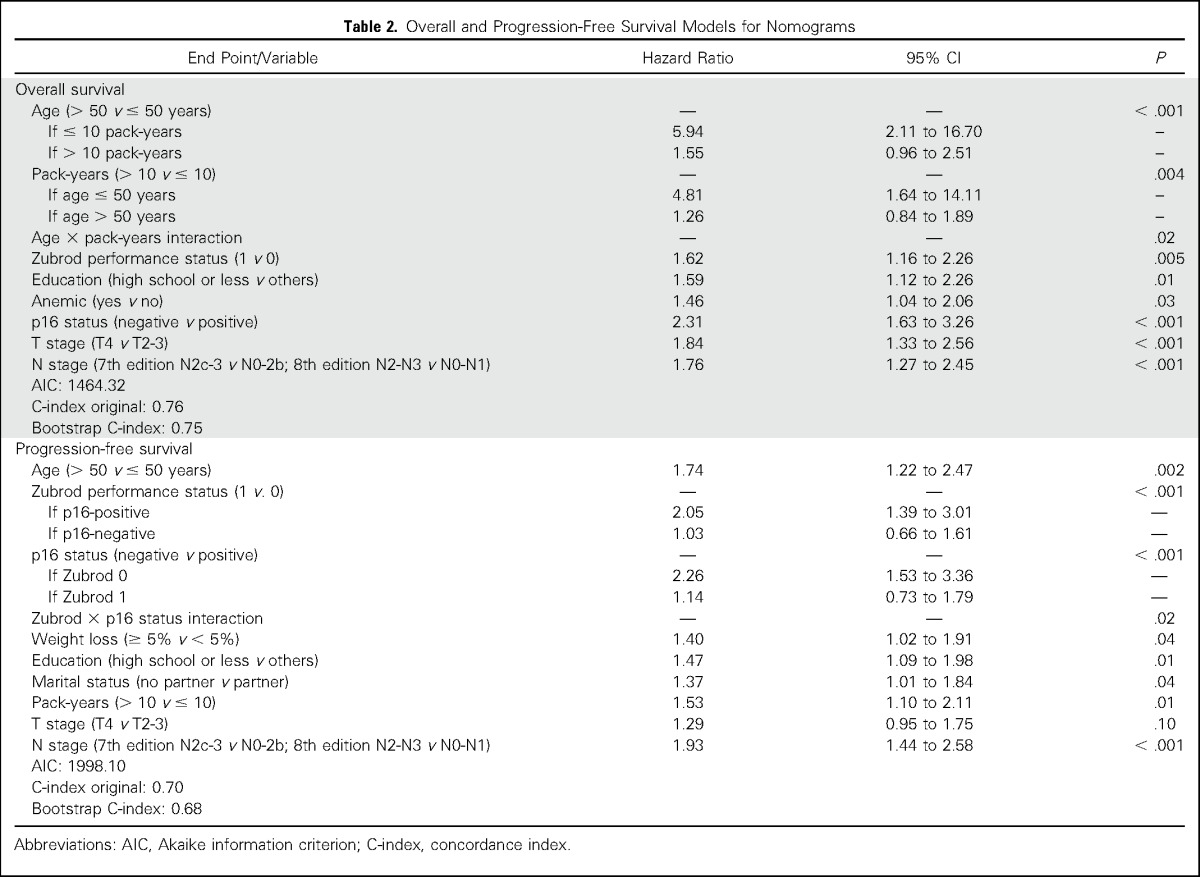
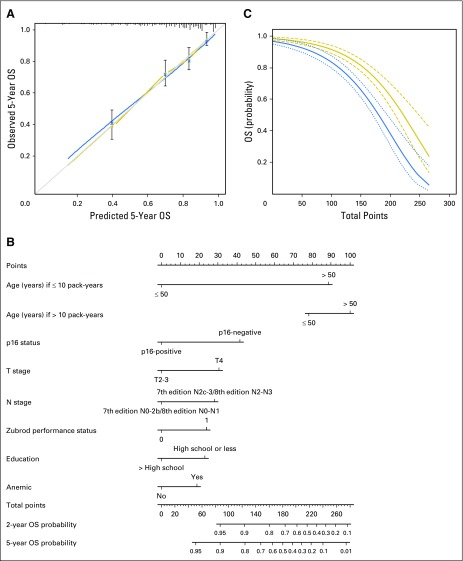
Figure 1A shows the calibration plot for the OS model, in which the predicted probability of 5-year OS is plotted against the observed data. Modeled 5-year estimates of OS closely approximated the observed estimates, but deviated slightly among individuals with poor survival. Model discrimination was evaluated with the C-index, which quantifies the level of concordance between the predicted and observed OS (Data Supplement). The C-index for the final OS model was 0.76 (95% CI, 0.72 to 0.80). The bias corrected C-indices generated by bootstrap validations were 0.74 (95% CI, 0.70 to 0.78) and 0.75 (95% CI, 0.71 to 0.79), with 20-fold internal cross-validation similar to that of 10-fold internal cross-validation, arguing against an overfit model.
Fig 1.
Overall survival (OS). (A) Calibration plot of OS at 5 years. Nomogram-predicted OS is plotted on the x-axis, with observed OS on the y-axis. Dashed lines along the 45-degree line through the origin point represent the perfect calibration models in which the predicted probabilities are identical to the actual probabilities. (B) Nomogram for predicting probability of OS at 2 and 5 years. The presence or absence of each clinical characteristic indicates a certain number of points. Number of points for each clinical characteristic is on the top row. For each characteristic, the absence is assigned zero points. The presence of characteristics is associated with number of points. The points for each characteristic are summed together to generate a total-points score. The total points correspond to respective 2-year and 5-year OS probabilities. (C) Predicted 2-year (thick dark line with short dashed 95% CIs) and 5-year (thin dark line with long dashed 95% CIs) OS probability on the basis of nomogram total points.
The internally validated model was used to create a nomogram to estimate the predicted probability of 2-year or 5-year OS (Fig 1B). The nomogram is a graphic depiction of the model, in which points are assigned based on the rank order of the effect estimates. Factors assigned the highest number of points included age, smoking, and tumor p16 status. For example, a 45-year-old male smoker (12 pack-years) with a Zubrod performance status of 0, no high school education, and no anemia, diagnosed with p16-positive, AJCC 7th edition stage T2N2bM0 OPSCC would have a total of 101 points and an estimated 2-year and 5-year OS of 94% (95% CI, 0.90% to 0.97%) and 87% (95% CI, 0.81% to 0.94%), respectively. As shown in Figure 1C, the predicted probability of 2-year and 5-year OS declined as a function of the total number of points generated by use of the nomogram. The predictive accuracy of the OS nomogram was compared with the original NRG Oncology RTOG 0129 risk stratification model, which had a C-index for OS of 0.71 (95% CI, 0.66 to 0.76), indicating modestly improved accuracy in predicting survival with the nomogram.
Progression-Free Survival
Estimated 2-year and 5-year PFS rates were 69.7% (95% CI, 65.4% to 73.6%) and 61.1% (95% CI, 56.6% to 65.3%), respectively. A total of 201 events occurred during follow-up.
Factors independently associated with PFS in multivariable analysis included age, Zubrod performance status, p16 status, weight loss, education, marital status, pack-years, T stage, and N stage (Table 2). A significant interaction was observed between performance status and tumor p16 status (P = .02). A performance status of 1 significantly increased the risk of progression/death for patients with p16-positive tumors (HR, 2.05; 95% CI, 1.39 to 3.01; P < .001), but not p16-negative tumors (HR, 1.03; 95% CI, 0.66 to 1.61; P = .89). Moreover, patients with p16-negative tumors had a significantly increased risk of progression/death if their performance status was 0 (HR, 2.26; 95% CI, 1.53 to 3.36; P < .001), but not if their performance status was 1 (HR, 1.14; 95% CI, 0.73 to 1.79; P = .57).
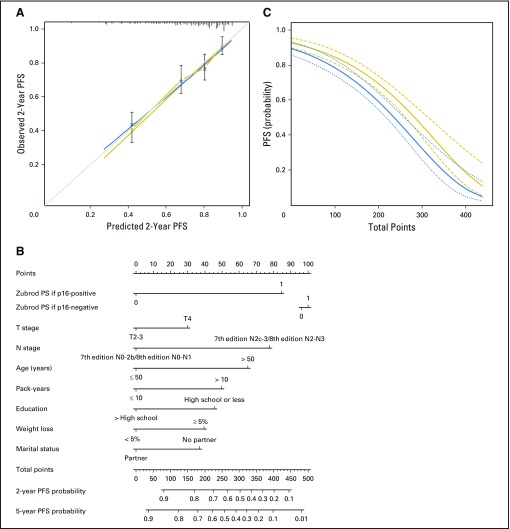
The PFS model was well calibrated (Fig 2A) and had an uncorrected C-index of 0.70 (95% CI, 0.66 to 0.74). The bootstrap-corrected C-index was 0.68 (95% CI, 0.64 to 0.72) and was similar after bias correction, with 10-fold (0.68; 95% CI, 0.64 to 0.72) and 20-fold (0.69; 95% CI, 0.65 to 0.73) cross-validation (Data Supplement). The nomogram for PFS built on this final, internally validated model is shown in Fig 2B. As for OS, PFS decreased with increasing number of total points (Fig 2C).
Fig 2.
Progression-free survival (PFS). (A) Calibration plot of PFS at 5 years. Nomogram-predicted PFS is plotted on the x-axis, with observed PFS on the y-axis. Dashed lines along the 45-degree line through the origin point represent the perfect calibration models in which the predicted probabilities are identical to the actual probabilities. (B) Nomogram for predicting probability of PFS at 2 and 5 years. The presence or absence of each clinical characteristic indicates a certain number of points. Number of points for each clinical characteristic is on the top row. For each characteristic, the absence is assigned zero points. The presence of characteristics is associated with number of points. The points for each characteristic are summed together to generate a total-points score. The total points correspond to respective 2-year and 5-year PFS probabilities. (C) Predicted 2-year (thick dark line with short dashed 95% CIs) and 5-year (thin dark line with long dashed 95% CIs) PFS probability on the basis of nomogram total points. PS, performance status.
External Validation
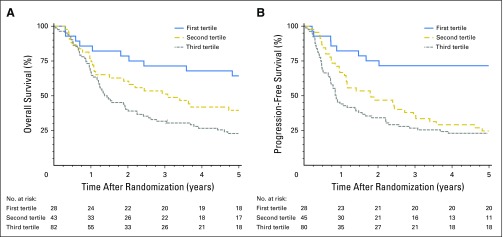
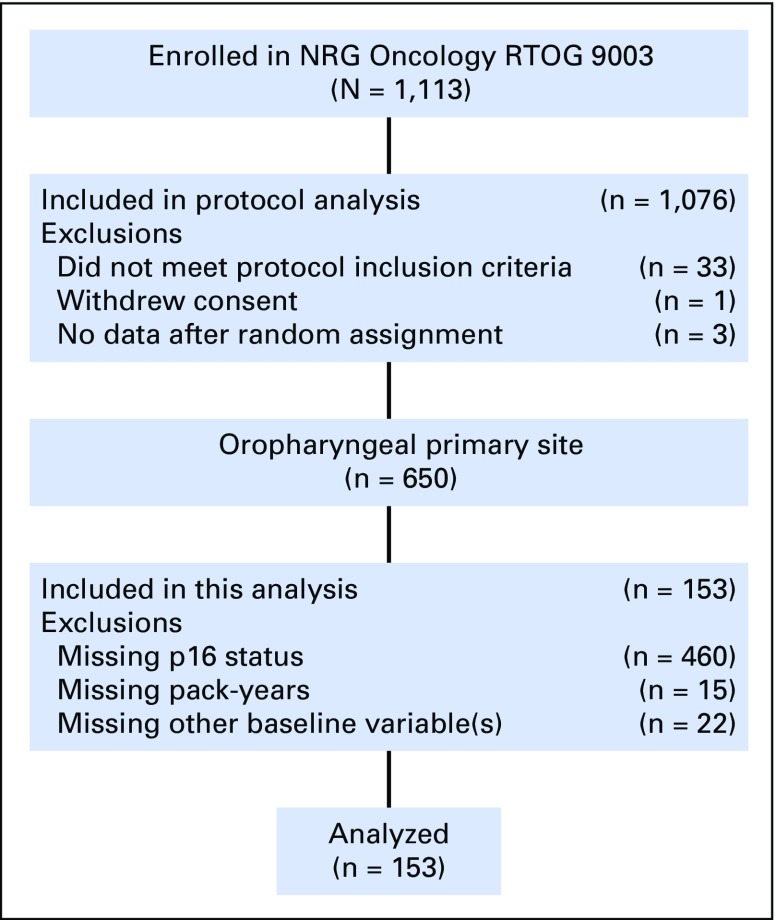
To evaluate the OS and PFS nomograms generated in the derivation cohort, the models were applied to a validation cohort of 153 patients with OPSCC in NRG Oncology RTOG 9003 (CONSORT diagram; Appendix Fig A2, online only). The median follow-up time was 16.1 years (95% CI, 15.1 to 17.7 years), with 136 and 140 OS and PFS events, respectively. The characteristics of the validation cohort are listed in Table 1. The OS model as applied to the validation cohort had an uncorrected C-index of 0.68 (95% CI, 0.63 to 0.73) and a bootstrap-corrected C-index of 0.64 (95% CI, 0.59 to 0.69) with 400 resamples. A total risk score was calculated for each patient in the combined cohort of RTOG 0129 and 0522. Tertiles of the total risk scores were then used to classify patients from RTOG 9003 into three groups. OS was significantly different across tertiles of nomogram scores (Fig 3A; log-rank P = .003; P < .001 for the combined cohort). Median OS times for patients in the lower, middle, and upper tertiles were 7.33 years (95% CI, 4.8 to 14.9 years), 3.24 years (95% CI, 1.88 to 5.84 years), and 1.37 years (95% CI, 1.20 to 2.24 years), respectively.
Fig 3.
Survival curves for validation cohort. (A) Overall survival (OS) curves for the validation cohort for the three groups defined by tertiles of the total points from the derivation cohort (P values: first tertile versus second tertile, .05; second tertile versus third tertile, .04). (B) Progression-free survival curves for the validation cohort for the three groups defined by tertiles of the total points from the derivation cohort (P values: first tertile versus second tertile, < .001; second tertile versus third tertile, .3).
The PFS model in the validation cohort had an uncorrected C-index of 0.68 (95% CI, 0.64 to 0.72) and a bootstrap-corrected C-index of 0.64 (95% CI, 0.60 to 0.68). Median PFS times for patients in the lower, middle, and upper tertiles were 12.8 years (95% CI, 5.08 years to not available), 1.81 years (95% CI, 1.13 to 3.40 years) and 0.85 years (95% CI, 0.72 to 1.5 years), respectively (Fig 3B; log-rank P < .001; P < .001 for the combined cohort).
DISCUSSION
We developed and validated nomograms to predict 2-year and 5-year OS and PFS for patients with locoregionally advanced OPSCC treated with primary radiation-based therapy. Notably, the nomograms permit integration of clinical, pathologic, and social risk factors and their interactions that affect survival. Most importantly, the nomograms provide personalized, patient-specific estimates of OS and PFS that can be used for risk-stratification and discussions of prognosis with patients.
Our internally and externally validated nomograms have some similarities with and potential advantages over two previously published nomograms for OPSCC.18,19 Several predictive factors in our nomogram were common with the well-validated nomogram published by Rios Velasquez et al18 (anemia, smoking, T stage, N stage, HPV status), but our larger sample size, longer follow-up time, and prospective data collection allowed us to evaluate the contribution of additional factors as well as to create separate nomograms for 2-year and 5-year OS and PFS outcomes.2,18-20 We were unable to evaluate the relative performance of the Rios Velasquez model in our derivation cohort because of the absence of data for the Adult Comorbidity Evaluation-27. Shoultz-Henley et al19 developed a nomogram that included thrombocytosis as an independent factor for 5-year OS (in addition to HPV status, stage, and anemia), but the model was neither internally nor externally validated. Unfortunately, platelet counts were not collected at baseline in our derivation cohort.
We acknowledge that the new prognostic nomograms provide only modest improvements in discrimination over the RTOG 0129 risk model, as indicated by a comparison of the C-index for both models. Although the RTOG 0129 recursive partitioning analysis–based risk model is more parsimonious, nomograms nevertheless offer some relative benefits.21 The former model provides average survival estimates for a heterogeneous patient population, which may reduce the predictive accuracy of prognostication for an individual patient. For example, the intermediate-risk group included both p16-positive and p16-negative patients. For individuals with survival approaching the mean, a nomogram may not offer improvement in prognostication. However, for certain individuals with specific combinations of characteristics (such as those provided in the following example) whose survival deviates substantially from the mean, the nomogram offers improved prognostication. In such cases, the nomogram may provide a more tailored risk prediction. Further studies are needed to determine whether the inclusion of continuous variables to the model could enhance personalization. A strength of this article over the original RTOG 0129 model is the internal and external validation of the model. Moreover, the nomograms permit the inclusion of additional prognostic variables that can alter survival estimates when tailored to an individual patient’s characteristics. For example, a 60-year-old nonsmoker diagnosed with HPV-positive, AJCC 7th edition stage T4N2b OPSCC would have a 2-year OS of 95% on the basis of the RTOG 0129 risk model. Knowledge that he or she is also an unmarried high school graduate who presents with a Zubrod performance status of 1, > 5% weight loss, and anemia results in an estimated 2-year OS of 70% per the nomogram. This example highlights some limitations of the more parsimonious RTOG 0129 model. The differences in the estimates for OS in this case may alter a patient’s and physician’s perceptions regarding the appropriateness of treatment de-intensification. Additional research will be required to determine potential thresholds for total nomogram points and associated predicted probabilities of OS and PFS that are appropriate for use as eligibility criteria for clinical trials of treatment de-intensification versus intensification.
Nomograms for breast, prostate, and other malignancies have been shown to assist patients with the complex discussions regarding the risks and benefits of treatment options.4,22-25 Illustrations have been shown to significantly augment physician-patient communication, and nomograms provide a visual image of prognostic factors as well as their relative influence. This facilitates active participation by patients in their treatment decisions.26 Patients can access nomogram calculators online (eg, the Web site of the National Cancer Institute) and, more recently, on smartphone applications.23 Online nomogram risk calculators based upon our data are available (https://www.nrgoncology.org/Nomograms/Oropharynx-Cancer-Overall-Survival-Calculator; https://www.nrgoncology.org/Nomograms/Oropharynx-Cancer-Progression-Free-Survival-Calculator). These estimates might allow patients to determine desired treatment intensity in the context of a personal PFS or OS estimate.
We acknowledge several limitations. We cannot exclude the potential for bias in our model because of exclusion of a proportion of enrolled patients as a result of missing data for key variables (eg, smoking and p16 status). In addition, we cannot exclude the possibility of residual confounding after internal validation as a result of possible overfitting from variable and threshold selection for these models. However, internal validation with bootstrapping and external validation were used to address these concerns. Radiotherapy fractionation schedules in the derivation cohort were not associated with OS or PFS and were distinct from those included in the validation cohort, and therefore could not be included in the model. Of note, we have included both AJCC 7th and 8th edition T stage and N stage categories for OPSCC in our model labels to assist in interpretation.
Strengths of this study include external validation of the nomograms in a patient cohort with important differences when compared with the derivation cohort. Relative to the derivation cohort, the validation cohort predominantly comprised smokers with HPV-negative OPSCC (Table 1) who were treated earlier in calendar time with radiation alone. Validation of the nomogram in such a different cohort highlights that the nomogram is robust because the predicted survival estimates of the nomogram were upheld in a distinct patient cohort. Additional important differences in RTOG 9003 include radiotherapy alone without chemotherapy and staging before positron emission tomography scans. Validation of the nomogram when applied to a distinct patient population and treatment paradigm is a strength of this analysis. However, additional validation will be required to evaluate the nomograms’ utility among patients treated with primary surgical resection and in other heterogeneously treated patient populations.
Appendix
Fig A1.
CONSORT diagram for Radiation Therapy Oncology Group (RTOG) 0129 and RTOG 0522.
Fig A2.
CONSORT diagram for Radiation Therapy Oncology Group (RTOG) 9003.
Footnotes
Supported by Grants No. U10CA180868 (NRG Oncology Operations), U10CA180822 (NRG Oncology Statistics and Data Management Center), and U10CA37422 (Community Clinical Oncology Program) from the National Cancer Institute and Eli Lilly Oral Cancer Foundation.
Poster presented at the 2016 Annual Meeting of the American Society of Clinical Oncology, Chicago, IL, June 3-7, 2016.
Clinical trial information: NCT00047008, NCT00265941, NCT00771641.
AUTHOR CONTRIBUTIONS
Conception and design: Carole Fakhry, Qiang Zhang, Quynh-Thu Le, Maura Gillison
Provision of study materials: Phuc Felix Nguyen-Tân, Sue S. Yom, John A. Ridge
Collection and assembly of data: Qiang Zhang, David I. Rosenthal, Louise Lambert, William L. Barrett, Wade L. Thorstad, Christopher U. Jones, Sue S. Yom, John A. Ridge, Eric Vigneault, Jonathan Harris, Maura Gillison
Data analysis and interpretation: Carole Fakhry, Qiang Zhang, Phuc Felix Nguyen-Tân, Randal S. Weber, Andy M. Trotti III, Stuart J. Wong, John A. Ridge, Shyam S.D. Rao, James A. Bonner, David Raben, Mahesh R. Kudrimoti, Jonathan Harris, Maura Gillison
Manuscript writing: All authors
Final approval of manuscript: All authors
Accountable for all aspects of the work: All authors
AUTHORS' DISCLOSURES OF POTENTIAL CONFLICTS OF INTEREST
Development and Validation of Nomograms Predictive of Overall and Progression-Free Survival in Patients With Oropharyngeal Cancer
The following represents disclosure information provided by authors of this manuscript. All relationships are considered compensated. Relationships are self-held unless noted. I = Immediate Family Member, Inst = My Institution. Relationships may not relate to the subject matter of this manuscript. For more information about ASCO's conflict of interest policy, please refer to www.asco.org/rwc or ascopubs.org/jco/site/ifc.
Carole Fakhry
No relationship to disclose
Qiang Zhang
Employment: Pfizer (I)
Stock or Other Ownership: Pfizer (I)
Phuc Felix Nguyen-Tân
No relationship to disclose
David I. Rosenthal
Stock or Other Ownership: Concordia Pharmaceuticals
Honoraria: Merck Serono
Consulting or Advisory Role: Merck Serono
Research Funding: Merck Serono
Travel, Accommodations, Expenses: Merck Serono
Randal S. Weber
No relationship to disclose
Louise Lambert
No relationship to disclose
Andy M. Trotti III
No relationship to disclose
William L. Barrett
No relationship to disclose
Wade L. Thorstad
Employment: Elekta (I)
Travel, Accommodations, Expenses: Elekta (I)
Christopher U. Jones
Speakers' Bureau: Eli Lilly
Sue S. Yom
Consulting or Advisory Role: Eli Lilly
Research Funding: Genentech, BioMimetix
Patents, Royalties, Other Intellectual Property: UpToDate, Springer
Travel, Accommodations, Expenses: Merck
Stuart J. Wong
Research Funding: Novartis
John A. Ridge
No relationship to disclose
Shyam S.D. Rao
Consulting or Advisory Role: UpToDate
James A. Bonner
Honoraria: Bristol-Myers Squibb, Eli Lilly, Merck Serono, Cel-Sci
Consulting or Advisory Role: Bristol-Myers Squibb, Eli Lilly, Merck Serono, Cel-Sci
Research Funding: Bristol-Myers Squibb Company
Travel, Accommodations, Expenses: Merck Serono
Eric Vigneault
Honoraria: Sanofi, Abbvie, Janssen
Consulting or Advisory Role: Sanofi, Abbvie
Travel, Accommodations, Expenses: Sanofi
David Raben
Employment: AstraZeneca
Honoraria: Merck, Oncology Analytics
Consulting or Advisory Role: AstraZeneca
Travel, Accommodations, Expenses: AstraZeneca
Mahesh R. Kudrimoti
Stock or Other Ownership: Pfizer, Pfizer (I), Merck, Merck (I), Stryker
Jonathan Harris
No relationship to disclose
Quynh-Thu Le
Consulting or Advisory Role: Bristol-Myers Squibb, Pfizer
Research Funding: Amgen (Inst), RedHill Biopharma (Inst), Varian Medical Systems (Inst)
Maura Gillison
Honoraria: Bristol-Myers Squibb, Celgene, Eli Lilly, Amgen, Merck, GlaxoSmithKline, AstraZeneca, i3 Health
Consulting or Advisory Role: Eli Lilly, Celgene, Bristol-Myers Squibb, Amgen, Merck, GlaxoSmithKline, AstraZeneca, i3 Health
REFERENCES
- 1.Fakhry C, Westra WH, Li S, et al. : Improved survival of patients with human papillomavirus-positive head and neck squamous cell carcinoma in a prospective clinical trial. J Natl Cancer Inst 100:261-269, 2008 [DOI] [PubMed] [Google Scholar]
- 2.Ang KK, Harris J, Wheeler R, et al. : Human papillomavirus and survival of patients with oropharyngeal cancer. N Engl J Med 363:24-35, 2010 [DOI] [PMC free article] [PubMed] [Google Scholar]
- 3.O’Sullivan B, Huang SH, Siu LL, et al. : Deintensification candidate subgroups in human papillomavirus-related oropharyngeal cancer according to minimal risk of distant metastasis. J Clin Oncol 31:543-550, 2013 [DOI] [PubMed] [Google Scholar]
- 4.Balachandran VP, Gonen M, Smith JJ, et al. : Nomograms in oncology: More than meets the eye. Lancet Oncol 16:e173-e180, 2015 [DOI] [PMC free article] [PubMed] [Google Scholar]
- 5. Ang KK, Zhang QE, Rosenthal DI, et al: A randomized phase III trial (RTOG 0522) of concurrent accelerated radiation plus cisplatin with or without cetuximab for stage III-IV head and neck squamous cell carcinomas (HNC). J Clin Oncol 29:5500, 2011 (suppl) [DOI] [PMC free article] [PubMed] [Google Scholar]
- 6.RTOG 0522: A randomized phase III trial of concurrent accelerated radiation and cisplatin versus concurrent accelerated radiation, cisplatin, and cetuximab [followed by surgery for selected patients] for stage III and IV head and neck carcinomas. Clin Adv Hematol Oncol 5:79-81, 2007 [PubMed] [Google Scholar]
- 7. Flaming I, Cooper J, Henson D, et al: AJCC Cancer Staging Manual (ed 5). Philadelphia, PA, Lippincott-Raven, 1997. [Google Scholar]
- 8.Fu KK, Pajak TF, Trotti A, et al. : A Radiation Therapy Oncology Group (RTOG) phase III randomized study to compare hyperfractionation and two variants of accelerated fractionation to standard fractionation radiotherapy for head and neck squamous cell carcinomas: First report of RTOG 9003. Int J Radiat Oncol Biol Phys 48:7-16, 2000 [DOI] [PubMed] [Google Scholar]
- 9.Begum S, Gillison ML, Ansari-Lari MA, et al. : Detection of human papillomavirus in cervical lymph nodes: A highly effective strategy for localizing site of tumor origin. Clin Cancer Res 9:6469-6475, 2003 [PubMed] [Google Scholar]
- 10.Jordan RC, Lingen MW, Perez-Ordonez B, et al. : Validation of methods for oropharyngeal cancer HPV status determination in US cooperative group trials. Am J Surg Pathol 36:945-954, 2012 [DOI] [PMC free article] [PubMed] [Google Scholar]
- 11.Grønhøj Larsen C, Gyldenløve M, Jensen DH, et al. : Correlation between human papillomavirus and p16 overexpression in oropharyngeal tumours: A systematic review. Br J Cancer 110:1587-1594, 2014 [DOI] [PMC free article] [PubMed] [Google Scholar]
- 12.Kaplan EL Meyer P: Nonparametric estimation from incomplete observations. J Am Stat Assoc 53:457-481, 1958 [Google Scholar]
- 13.Mantel N: Evaluation of survival data and two new rank order statistics arising in its consideration. Cancer Chemother Rep 50:163-170, 1966 [PubMed] [Google Scholar]
- 14. Cox DR: Regression models and life-tables. J R Stat Soc [Ser B] 34:187-220, 1972. [Google Scholar]
- 15.Shenouda G, Zhang Q, Ang KK, et al. : Long-term results of radiation therapy oncology group 9903: A randomized phase 3 trial to assess the effect of erythropoietin on local-regional control in anemic patients treated with radiation therapy for squamous cell carcinoma of the head and neck. Int J Radiat Oncol Biol Phys 91:907-915, 2015 [DOI] [PMC free article] [PubMed] [Google Scholar]
- 16.Harrell FE, Jr, Lee KL, Mark DB: Multivariable prognostic models: Issues in developing models, evaluating assumptions and adequacy, and measuring and reducing errors. Stat Med 15:361-387, 1996 [DOI] [PubMed] [Google Scholar]
- 17. Westfall PH, Hochberg Y, Rom D, et al: Multiple Comparisons and Multiple Tests Using the SAS System. Cary, NC, SAS Institute, 1999. [Google Scholar]
- 18.Rios Velazquez E, Hoebers F, Aerts HJ, et al. : Externally validated HPV-based prognostic nomogram for oropharyngeal carcinoma patients yields more accurate predictions than TNM staging. Radiother Oncol 113:324-330, 2014 [DOI] [PubMed] [Google Scholar]
- 19.Shoultz-Henley S, Garden AS, Mohamed AS, et al. : Prognostic value of pretherapy platelet elevation in oropharyngeal cancer patients treated with chemoradiation. Int J Cancer 138:1290-1297, 2016 [DOI] [PMC free article] [PubMed] [Google Scholar]
- 20.Ang KK, Zhang Q, Rosenthal DI, et al. : Randomized phase III trial of concurrent accelerated radiation plus cisplatin with or without cetuximab for stage III to IV head and neck carcinoma: RTOG 0522. J Clin Oncol 32:2940-2950, 2014 [DOI] [PMC free article] [PubMed] [Google Scholar]
- 21.Shariat SF, Karakiewicz PI, Suardi N, et al. : Comparison of nomograms with other methods for predicting outcomes in prostate cancer: A critical analysis of the literature. Clin Cancer Res 14:4400-4407, 2008 [DOI] [PubMed] [Google Scholar]
- 22.Kattan MW: Nomograms are superior to staging and risk grouping systems for identifying high-risk patients: Preoperative application in prostate cancer. Curr Opin Urol 13:111-116, 2003 [DOI] [PubMed] [Google Scholar]
- 23.Callegaro D, Miceli R, Bonvalot S, et al. : Development and external validation of two nomograms to predict overall survival and occurrence of distant metastases in adults after surgical resection of localised soft-tissue sarcomas of the extremities: A retrospective analysis. Lancet Oncol 17:671-680, 2016 [DOI] [PubMed] [Google Scholar]
- 24.White RR, Kattan MW, Haney JC, et al. : Evaluation of preoperative therapy for pancreatic cancer using a prognostic nomogram. Ann Surg Oncol 13:1485-1492, 2006 [DOI] [PubMed] [Google Scholar]
- 25.Sanghani M, Truong PT, Raad RA, et al. : Validation of a web-based predictive nomogram for ipsilateral breast tumor recurrence after breast conserving therapy. J Clin Oncol 28:718-722, 2010 [DOI] [PMC free article] [PubMed] [Google Scholar]
- 26.Laine C, Davidoff F: Patient-centered medicine. A professional evolution. JAMA 275:152-156, 1996 [PubMed] [Google Scholar]


