

ABSTRACT
AZD1775 is a small molecule WEE1 inhibitor used in combination with DNA-damaging agents to cause premature mitosis and cell death in p53-mutated cancer cells. Here we sought to determine the mechanism of action of AZD1775 in combination with chemotherapeutic agents in light of recent findings that AZD1775 can cause double-stranded DNA (DS-DNA) breaks. AZD1775 significantly improved the cytotoxicity of 5-FU in a p53-mutated colorectal cancer cell line (HT29 cells), decreasing the IC50 from 9.3 μM to 3.5 μM. Flow cytometry showed a significant increase in the mitotic marker pHH3 (3.4% vs. 56.2%) and DS-DNA break marker γH2AX (5.1% vs. 50.7%) for combination therapy compared with 5-FU alone. Combination therapy also increased the amount of caspase-3 dependent apoptosis compared with 5-FU alone (4% vs. 13%). The addition of exogenous nucleosides to combination therapy significantly rescued the increased DS-DNA breaks and caspase-3 dependent apoptosis almost to the levels of 5-FU monotherapy. In conclusion, AZD1775 enhances 5-FU cytotoxicity through increased DS-DNA breaks, not premature mitosis, in p53-mutated colorectal cancer cells. This finding is important for designers of future clinical trials when considering the optimal timing and duration of AZD1775 treatment.
KEYWORDS: colorectal cancer, checkpoint kinase, cell cycle, DNA damage, mitosis
Introduction
Colorectal cancer is a global health problem with 693,900 deaths occurring annually worldwide.1 Conventional medical therapies for colorectal cancer, such as chemotherapy and radiotherapy, cause cell death by inducing lethal DNA damage in cancer cells. In health, DNA damage activates cell cycle checkpoints (G1, S- and G2/M) that arrest the cell cycle allowing DNA to be repaired. If the damage is too severe pathways that lead to cell death are activated, otherwise DNA damage will be accurately repaired. Understandably this is an essential process in healthy cells to preserve genomic integrity, but in cancerous cells this can limit the efficacy of DNA-damaging treatments.
WEE1 is a protein kinase that regulates cell entry into mitosis at the G2/M checkpoint through the activity of cyclin-dependent kinase 1 (CDK1). In response to DNA damage, WEE1 inactivates CDK1 through an inhibitory phosphorylation of its tyrosine 15 residue (pCDK1-Y15).2 This results in G2 arrest and allows DNA damage to be repaired. The combination of WEE1 inhibitors with DNA-damaging agents has emerged as an attractive anti-cancer treatment strategy, whereby cancer cells with lethal DNA damage are forced into premature mitosis with unrepaired DNA damage, resulting in cell death. This is thought to be particularly effective in cancers with non-functioning p53 (a key component of the G1 checkpoint) as these cells are more reliant on the G2/M checkpoint for DNA repair. Preclinical studies in several cancer lines, including colorectal cancer, support this theory.3-6 Currently there are over 25 clinical trials assessing AZD1775 (a small molecule WEE1 inhibitor) in combination with DNA-damaging agents in a range of cancers (Clinical Trails.gov Accessed August 2016).
Interestingly, several studies have demonstrated that AZD1775 has anti-cancer activity independent of p53 function.7-11 In 2012 it was reported that WEE1, through CDK1, has another critical role in DNA synthesis.12 WEE1 inhibition results in increased activity of CDK1, which in turn leads to increased replication origin firing, exhaustion of nucleotide stores, reduced replication fork speed and double-stranded DNA (DS-DNA) breaks. This has been supported by several pre-clinical studies showing single agent AZD1775 activity.7,9,13 The first Phase I clinical trial for AZD1775 monotherapy in solid tumors has also recently been reported.14
Whether or not AZD1775 increases the sensitivity of p53-mutated and wild type cancer cells to DNA-damaging therapies and the mechanism by which it achieves this sensitization are unanswered questions.15 To address this we investigated the mechanism of action of AZD1775 in combination with chemotherapeutic agents in a p53-mutated colorectal cancer cell line.
Results
AZD1775 enhances 5-FU toxicity in HT29 cells, but does not enhance toxicity of other common chemotherapeutic agents
In the majority of current clinical trials AZD1775 is administered following DNA-damaging treatment to cause mitotic catastrophe and cancer cell death. We sought to understand how this dosing strategy affected p53-mutated HT29 colorectal cancer cell viability with different chemotherapeutic agents commonly used for the treatment of colorectal cancer. 5-FU alone caused about a 30% reduction in HT29 cell viability (Fig. 1a) as did 300 nM AZD1775 (Fig. S1). Combination treatment showed an enhancing effect of AZD1775 at low doses of 5-FU, slightly increased maximum response to 5-FU and reduction in the 5-FU IC50 from 9.3 μM to 3.5 μM (Fig. 1b). When used in combination with oxaliplatin, AZD1775 decreased cell viability at low doses of oxaliplatin, but not higher doses (Fig. 1c). The IC50 was significantly higher with combination treatment than oxaliplatin alone (Fig. 1d). Similarly, with irinotecan and AZD1775 combination therapy, cell viability was decreased at lower doses of irinotecan but not higher doses (Fig. 1e). There was no significant difference in the IC50 values (Fig. 1f). Overall, the data suggest that 5-FU cytotoxicity is improved with AZD1775 addition, but both oxaliplatin and irinotecan treatments are only improved at low concentrations. It is unclear whether the effect of AZD1775 is additive or synergistic.
Figure 1.
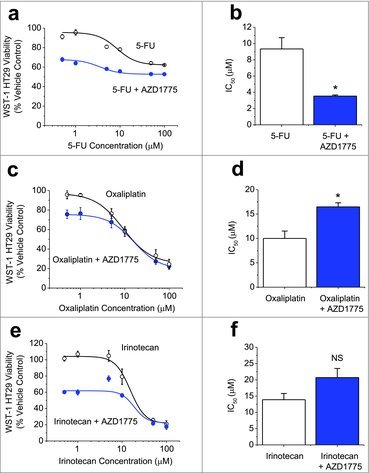
AZD1775 Enhances the Cytotoxicity of 5-FU, but not Oxaliplatin or Irinotecan. (a-f). Measurements of cell viability in HT29 cells using WST-1. (a) Concentration-response data for HT29 cells treated for 24 hrs with 5-FU at the indicated doses and then an additional 24 hrs with AZD1775 (300 nM) or vehicle control (n = 3, N = 9). (b) Mean data derived from the fitted Hill Equation in a indicating the 50% maximum inhibition (IC50) values (n = 3). (c) As for a but substituting 5-FU for varying concentrations of oxaliplatin (n = 3, N = 9). (d) Mean IC50 values from the type of experiment shown in c (n = 3). (e) As for a but replacing 5-FU with irinotecan (n = 3, N = 9). (f) Mean IC50 values from the type of experiment shown in e (n = 3).
AZD1775 increases S phase and G2/M phase populations in HT29 cells pre-treated with 5-FU
To further investigate the mechanism by which AZD1775 addition enhances chemotherapy cytotoxicity, we focused on concentrations of 1 μM 5-FU and 300 nM AZD1775 as this resulted in a 31% reduction in HT29 viability compared with 1 μM 5-FU alone (Fig. 1a). Treatment with 5-FU significantly increased pCDK1-Y15 indicating mitotic delay in response to DNA damage (Fig. 2a and b). With AZD1775 addition, pCDK1-Y15 was significantly reduced as WEE1 was prevented from phosphorylating CDK1 (Fig. 2a and b). As WEE1, through CDK1, regulates entry into mitosis we investigated the effect of combination treatment on the cell cycle distribution. The addition of AZD1775 grossly altered the cell cycle pattern (Fig. 2c). As expected, there were more cells in S Phase and G2/M phase (Fig. 2d). This reflects the dual role of CDK1 as a regulator of DNA synthesis and mitotic entry. The data suggest that AZD1775 alters CDK1 activity and is able to increase the number of 5-FU treated HT29 cells in S Phase and G2/M Phase.
Figure 2.
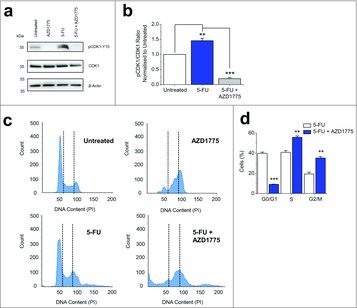
AZD1775 Decreases pCKD1-Y15 in 5-FU Treated HT29 Cells and Increases the Number of Cells in S Phase and G2/M Phase. (a) Example western blot labeled with anti-pCDK1-Y15, anti-CDK1 and anti-β-actin antibodies for HT29 cells that received no treatment (Untreated), AZD1775 (300 nM), 5-FU (1 μM) or 5-FU (1 μM) with an additional 24 hrs AZD1775 (300 nM). (b) Quantification of the pCDK1-Y15 band intensity divided by the CDK1 band intensity. Data has been normalized to the untreated group (n = 3 each). (c) Example flow cytometry recording for HT29 cells that received no treatment (Untreated), AZD1775 (300 nM), 5-FU (1 μM) or 5-FU (1 μM) with an additional 24 hrs AZD1775 (300 nM). The vertical dotted lines separate different phases of the cell cycle. (d) Mean percentage of cells in G0/G1, S- and G2/M phases (n = 3 each). 5-FU+AZD1775 data are statistically compared with 5-FU for each phase.
AZD1775 causes increased mitosis and DS-DNA breaks in HT29 cells pre-treated with 5-FU
Both premature mitosis and DS-DNA breaks have been reported to be responsible for AZD1775 cytotoxicity. To investigate how AZD1775 was working in combination with 5-FU we produced a flow cytometry time course assessing levels of DS-DNA breaks and mitosis after AZD1775 addition (Fig. 3a and b). With combination therapy levels of DS-DNA breaks increased over time to 50.7% 24 hrs after AZD1775 addition, compared with 5.1% in 5-FU alone (Fig. 3c). In contrast, levels of mitosis peaked 8 hrs after AZD1775 addition at 56.2% compared with 3.4% in 5-FU alone. Levels of mitosis almost returned to baseline at 24 hrs (Fig. 3d). Similar effects were observed with AZD1775 monotherapy (Fig. S2). The data suggest that AZD1775 can induce both mitosis and DS-DNA breaks in cells pre-treated with 5-FU.
Figure 3.
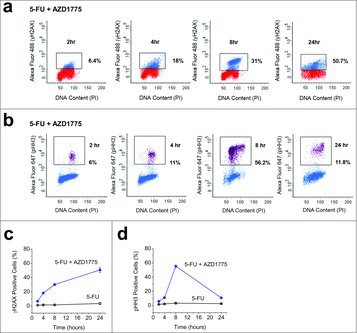
5-FU and AZD1775 Combination Therapy Causes Increased Mitosis and DS-DNA Breaks in HT29 Cells. (a) Example flow cytometry dot plots for unlabelled HT29 cells (red) and HT29 cells labeled with anti-γH2AX antibody (blue) after 24 hrs treatment with 5-FU (1 μM) and the addition of AZD1775 (300 nM) for the times indicated. (b) Example flow cytometry dot plots for unlabelled HT29 cells (blue) and HT29 cells labeled with anti-pHH3 antibody (purple) after 24 hrs treatment with 5-FU (1 μM) and the addition of AZD1775 (300 nM) for the times indicated. (c) Mean γH2AX expression for the groups in a including a control group (5-FU) where cells were treated for 24 hrs with 5-FU (1 μM) and vehicle control for the times indicated (n = 3 each time point). (d) Mean pHH3 expression for the groups in b including a control group (5-FU) where cells were treated for 24 hrs with 5-FU (1 μM) and vehicle control for the times indicated (n = 3 each time point).
DS-DNA breaks caused by combination therapy can be reversed by exogenous nucleoside addition
As AZD1775 monotherapy causes DS-DNA breaks in HT29 cells (Fig. S2) it was hypothesized that this may also be the dominant mechanism of action for combination therapy. Critical to investigating this was the fact that nucleotide shortage is a consequence of excess origin firing and not premature mitosis. AZD1775 monotherapy resulted in 45.2% of HT29 cells expressing γH2AX, a 452-fold increase compared with vehicle control treated cells (Fig. 4a and b). The addition of exogenous nucleosides significantly reduced γH2AX expression to 4% (Fig. 4a and b). When AZD1775 was used in combination with 5-FU a similar result was noted. The addition of exogenous nucleosides to 5-FU and AZD1775 combination therapy significantly reduced the number of cells expressing γH2AX from 50.5% to 8.7% (Fig. 4c and d). This was near the levels of 5-FU alone (4.5%). Similar results were observed in the HCT116 colorectal cancer cell line, which have wild type p53 status, although higher doses of AZD1775 were required to observe an effect (Fig. S3). Overall, the data suggest that DS-DNA breaks induced by 5-FU and AZD1775 combination therapy occur independently of p53 status and can be prevented if there is an exogenous supply of nucleosides.
Figure 4.
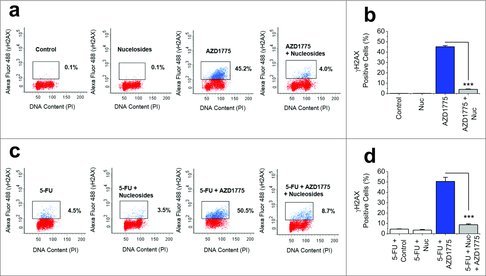
DS-DNA Breaks Caused by AZD1775 and 5-FU Combination Therapy can be Prevented by Exogenous Nuceloside Addition. (a) Four example flow cytometry dot plots for unlabelled HT29 cells (red) and HT29 cells labeled with anti-γH2AX antibody (blue). Cells were treated for 24 hrs with vehicle control (Control), exogenous nucleosides (Nuc, EmbryoMax®, 1:5 dilution), AZD1775 (300 nM) or AZD1775 (300 nM) + exogenous nucleosides (Nuc, EmbryoMax®, 1:5 dilution). (b) Mean γH2AX expression for the 4 groups in a (n = 3 each). (c) Four example flow cytometry dot plots for unlabelled HT29 cells (red) and HT29 cells labeled with anti-γH2AX antibody (blue). All cells received 24 hrs 5-FU (1 μM) followed by either vehicle control, exogenous nucleosides (Nuc, EmbryoMax®, 1:5 dilution), AZD1775 (300 nM) or AZD1775 (300 nM) + exogenous nucleosides (Nuc, EmbryoMax®, 1:5 dilution) for a further 24 hrs. (d) Mean γH2AX expression for the 4 groups in c (n = 3 each).
AZD1775 increases caspase-3 dependent apoptosis in HT29 cells pre-treated with 5-FU and can be reversed by exogenous nucleoside addition
A possible consequence of DS-DNA breaks is increased apoptotic cell death. Therefore, we investigated the levels of caspase-3 dependent apoptosis following combination therapy. 5-FU alone resulted in low levels of apoptosis (4%), however this was significantly increased with combination therapy up to 13% (Fig. 5a and b). To address whether this observation was due to increased DS-DNA breaks as a result of WEE1 inhibition we added exogenous nucleosides. This reduced the amount of caspase-3 dependent apoptosis to 4.7%, which was similar to levels observed with 5-FU treatment alone (Fig. 5a and b). The data suggest that combination therapy results in increased apoptotic cell death, but this is due to AZD1775 causing DS-DNA breaks, not premature mitosis.
Figure 5.
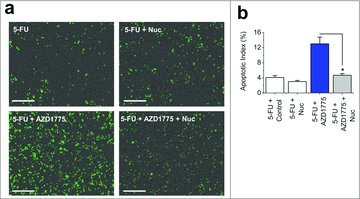
AZD1775 and 5-FU Combination Therapy Induce Caspase-3 Dependent Apoptosis, which can be Prevented by Exogenous Nucleoside Addition. (a) Images of fluorescence from caspase-3 activity indicator in HT29 cells. All cells received 24 hrs 5-FU (1 μM) followed by 24 hrs of either vehicle control, exogenous nucleosides (Nuc, EmbryoMax®, 1:5 dilution), AZD1775 (300 nM) or AZD1775 (300 nM) + exogenous nucleosides (Nuc, EmbryoMax®, 1:5 dilution). Scale bars 200 μm. (b) Mean data for the experimental groups in a (n = 3 each).
Discussion
This study shows that when AZD1775 is used in combination with 5-FU against a p53-mutated colorectal cancer cell line the enhanced cytotoxicity is due to AZD1775 causing increased DS-DNA breaks, not premature mitosis. AZD1775 exerts its own cytotoxic effects independent of chemotherapeutic agents.
There is disparity within the literature regarding the dominant mechanism of action of AZD1775, especially when used in combination with DNA-damaging agents.15 Furthermore, it is unclear what role p53 status has upon AZD1775 efficacy. To address this we took advantage of the HT29 colorectal cancer cell line as this has a mutated non-functional p53 (Arg-273 to His) and therefore both DS-DNA breaks and premature mitosis are possible mechanisms of AZD1775 action. Our findings contradict previous studies in colorectal cancer cell lines that suggest WEE1 inhibition sensitizes cells to DNA-damaging agents through premature mitosis.3-5 However, these studies were published before the role of WEE1 in regulating DNA synthesis was discovered and so DS-DNA breaks were not investigated. As we have shown, levels of mitosis do dramatically increase, but this is not the cause of caspase-3 dependent apoptosis. Furthermore, our results are in agreement with several reports of single agent AZD1775 activity causing DS-DNA breaks in cancer cells.9,13,14
Despite acting independently of chemotherapeutic agents, AZD1775 did improve the IC50 of 5-FU in viability assays. However, this is probably due to 5-FU monotherapy having limited effects on HT29 cells, even at high doses. AZD1775 has potent monotherapeutic action against HT29 cells and has been found to have more potent effects on cell viability than some DNA-damaging agents in other cancer cell lines.16 We demonstrated that AZD1775 monotherapy is able to inhibit HT29 cell proliferation with an IC50 of 184 nM (Fig. S1). This was significantly less than the IC50 for 5-FU, which was 9.3 μM and therefore using an AZD1775 dose of 300 nM is likely to result in independent cytotoxic effects. If AZD1775 is used in conjunction with chemotherapeutic agents clinically, it may mean that lower doses of chemotherapy can be given to patients. This could have the benefit of reducing the side effects associated with high dose chemotherapy, while maintaining the same efficacy.
This finding has clinical relevance as AZD1775 is currently being investigated in several clinical trials in combination with DNA-damaging treatments. As our data suggest that AZD1775 causes DS-DNA breaks rather than premature mitosis, giving AZD1775 immediately after DNA-damaging treatments of short periods may not be the optimal dosing strategy. Instead, longer term treatments with AZD1775 in conjunction with DNA-damaging agents may have better efficacy.
In conclusion, the data suggest that AZD1775 has independent cytotoxic effects from chemotherapeutic agents in p53-mutated colorectal cancer cells. This finding is important for designers of future clinical trials when considering the timing and duration of AZD1775 treatment.
Materials and methods
Cell culture and reagents
HT29 cells (ATCC® HTB-38™) were purchased from Sigma. This cell line was established in 1964 from the primary tumor of a 44-year-old Caucasian female with colorectal adenocarcinoma. These cells have a mutated p53 (Arg-273 to His). HCT116 cells were also purchased from Sigma. Both cell lines were cultured in Dulbecco's Modified Eagle Medium GlutatMAX (Invitrogen) supplemented with 10% foetal calf serum and 100 units.mL−1 penicillin-streptomycin. 5-FU, oxaliplatin and irinotecan were purchased from Sigma. Nucleosides (EmbryoMax® 100x) were purchased from Millipore and AZD1775 was purchased from Active Biochem.
WST-1 proliferation assay
WST-1 is a colorimetric assay used for the non-radioactive quantification of cell proliferation, viability and cytotoxicity. Cells were plated onto a 96-well plate and grown overnight. The following morning cells were treated with chemotherapeutic agents for 24 hrs, before the addition of AZD1775. Upon completion of the experiment WST-1 (Sigma) was applied in accordance with the manufacturer's protocol and absorbance was measured in a microtiter plate reader at wavelengths between 440 and 650 nm.
Western blotting
Cells were harvested in lysis buffer containing 10 mM Tris, pH 7.5, 150 mM NaCl, 0.5 mM EDTA, 0.5% NP-40, MiniComplete protease inhibitors (Roche), and PhosSTOP phosphatase inhibitors (Roche). Equal protein amounts were loaded on 4–20% gradient gels and resolved by electrophoresis. Samples were transferred to PVDF membranes and labeled overnight with primary antibody: mouse anti-human β-actin (1:2000, Santa Cruz Biotechnology), rabbit anti-human pCDK1-Y15 (1:1000, Cell Signaling Technology), mouse anti-human CDK1 (1:1000, Cell Signaling Technology). Species appropriate secondary antibodies and SuperSignal Femto detection reagent (Perbio Science) were used for visualization.
Flow cytometry
All flow cytometry work was undertaken on a BD-LSR Fortessa Flow Cytometer. HT29 cells were plated at 325,000 cells per well on a 6-well plate and grown overnight before treatment. At the end of treatment cells were trypsinised and spun down. Ice-cold ethanol (70%) was added dropwise to each pellet before samples were frozen at −20ºC for at least 48 hrs. To detect DS-DNA breaks, samples were defrosted, washed twice with PBS and then incubated with Alexa Fluor 488 Mouse anti-H2AX (BD Biosciences) for 20 mins at room temperature. Following incubation samples were washed again with PBS before adding 0.5 mL per 1 × 10⁶ cells PI/RNase Buffer (BD Biosciences). Samples were incubated at room temperature for 15 mins before being analyzed on the flow cytometer. To detect mitosis cells were incubated with Alexa Fluor 647 Rat anti-pHH3 (BD Biosciences), with other steps remaining unchanged. All analysis was undertaken using BD FACSDiva v6.2 software.
Apoptosis assay
HT29 apoptosis was measured using a caspase-3 assay on the Incucyte™ FLR Kinetic Imaging System. HT29 cells were plated onto a 6-well plate and grown overnight before treatment. Following treatment cells were incubated with 5 μM NucView™488 caspase-3 substrate (Biotium) according to manufacturer's instructions. Cells were placed in the Incucyte™ FLR and imaged in phase contrast and fluorescence mode using a x10 objective to detect apoptotic cells. To detect the total cell population cell nuclei were then stained with 5 μM Vybrant DyeCycle Green® (Molecular Probes, Invitrogen). Apoptotic Index was calculated as the percentage of caspase-3 positive cells divided by the total number of cells.
Data analysis
Statistical Analysis was performed using OriginPro 9.1 (OriginLab Corporation). Data are presented as mean +/- SEM. Prior to statistical analysis, data were tested for normality and equality of variance. Paired data were compared statistically using t tests. For data sets with more than 2 groups ANOVA and a post-hoc Bonferroni test were used. “n” indicates the number of independent experiments, where as “N” indicates the number of replicates. For statistical significance * indicates p < 0.05, ** p < 0.01 and ***p < 0.001. NS = Not significant.
Supplementary Material
Funding Statement
This research was supported by the following funding: David Beech: British Heart Foundation (FS/14/22/30734). David Beech: British Heart Foundation (FS/13/23/30122). David Beech: Medical Research Council (G1002076). Peter Webster: Leeds Teaching Hospitals Charitable Foundation (9R01/14–06).
Disclosure of potential conflicts of interest
No potential conflicts of interest were disclosed.
Author contributions
PJW generated ideas and designed the experiments. PJW conducted experiments with contributions from ATL and HJG. DJB, KRP, PJW and DAB initiated the project. DJB, KRP, PJW and DAB generated research funds to support the project. PJW and ATL co-wrote the paper, with critical input from DJB and DAB.
References
- [1].Torre LA, Bray F, Siegel RL, Ferlay J, Lortet-Tieulent J, Jemal A. Global cancer statistics, 2012. CA: A Cancer Journal for Clinicians 2015; 65:87–108. [DOI] [PubMed] [Google Scholar]
- [2].Watanabe N, Broome M, Hunter T. Regulation of the human WEE1Hu CDK tyrosine 15-kinase during the cell cycle. EMBO J 1995; 14:1878–91; PMID:7743995 [DOI] [PMC free article] [PubMed] [Google Scholar]
- [3].Wang Y, Li J, Booher R, Kraker A, Lawrence T, Leopold W, Sun Y. Radiosensitization of p53 Mutant Cells by PD0166285, a Novel G2 Checkpoint Abrogator. Cancer Res 2001; 61:8211–7; PMID:11719452 [PubMed] [Google Scholar]
- [4].Hirai H, Iwasawa Y, Okada M, Arai T, Nishibata T, Kobayashi M, Sakai N, Imagaki K, Ohtani J, Sakai T, et al.. Small-molecule inhibition of Wee1 kinase by MK-1775 selectively sensitizes p53-deficient tumor cells to DNA-damaging agents. Mol Cancer Ther 2009; 8:2992–3000; PMID:19887545; http://dx.doi.org/10.1158/1535-7163.MCT-09-0463 [DOI] [PubMed] [Google Scholar]
- [5].Hirai H, Arai T, Okada M, Nishibata T, Kobayashi M, Sakai N, Imagaki K, Ohtani J, Sakai T, Yoshizumi T et al.. MK-1775, a small molecule Wee1 inhibitor, enhances anti-tumor efficacy of various DNA-damaging agents, including 5-fluorouracil. Cancer Biol Ther 2010; 9:514–22; http://dx.doi.org/10.4161/cbt.9.7.11115 [DOI] [PubMed] [Google Scholar]
- [6].Rajeshkumar NV, De Oliveira E, Ottenhof N, Watters J, Brooks D, Demuth T, Shumway SD, Mizuarai S, Hirai H, Maitra A et al.. MK-1775, a potent Wee1 inhibitor, synergizes with gemcitabine to achieve tumor regressions, selectively in p53-deficient pancreatic cancer xenografts. Clin Cancer Res 2011; 17:2799–806; PMID:21389100; http://dx.doi.org/10.1158/1078-0432.CCR-10-2580 [DOI] [PMC free article] [PubMed] [Google Scholar]
- [7].Kreahling JM, Gemmer JY, Reed D, Letson D, Bui M, Altiok S. MK1775, a selective Wee1 inhibitor, shows single-agent antitumor activity against sarcoma cells. Mol Cancer Ther 2012; 11:174–82; PMID:22084170; http://dx.doi.org/10.1158/1535-7163.MCT-11-0529 [DOI] [PMC free article] [PubMed] [Google Scholar]
- [8].Van Linden AA, Baturin D, Ford JB, Fosmire SP, Gardner L, Korch C, Reigan P, Porter CC. Inhibition of Wee1 sensitizes cancer cells to antimetabolite chemotherapeutics in vitro and in vivo, independent of p53 functionality. Mol Cancer Ther 2013; 12:2675–84; PMID:24121103; http://dx.doi.org/10.1158/1535-7163.MCT-13-0424 [DOI] [PMC free article] [PubMed] [Google Scholar]
- [9].Guertin AD, Li J, Liu Y, Hurd MS, Schuller AG, Long B, Hirsch HA, Feldman I, Benita Y, Toniatti C et al.. Preclinical evaluation of the WEE1 inhibitor MK-1775 as single-agent anticancer therapy. Mol Cancer Ther 2013; 12:1442–52; PMID:23699655; http://dx.doi.org/10.1158/1535-7163.MCT-13-0025 [DOI] [PubMed] [Google Scholar]
- [10].Mueller S, Hashizume R, Yang X, Kolkowitz I, Olow AK, Phillips J, Smirnov I, Tom MW, Prados MD, James CD et al.. Targeting Wee1 for the treatment of pediatric high-grade gliomas. Neuro-oncology 2014; 16:352–60; PMID:24305702; http://dx.doi.org/10.1093/neuonc/not220 [DOI] [PMC free article] [PubMed] [Google Scholar]
- [11].Cuneo KC, Morgan MA, Davis MA, Parcels LA, Parcels J, Karnak D, Ryan C, Liu N, Maybaum J, Lawrence TS. Wee1 Kinase Inhibitor AZD1775 Radiosensitizes Hepatocellular Carcinoma Regardless of TP53 Mutational Status Through Induction of Replication Stress. Int J Radiat Oncol Biol Phys 2016; 95:782–90; PMID:26975930; http://dx.doi.org/10.1016/j.ijrobp.2016.01.028 [DOI] [PMC free article] [PubMed] [Google Scholar]
- [12].Beck H, Nähse-Kumpf V, Larsen MS, O'Hanlon KA, Patzke S, Holmberg C, Mejlvang J, Groth A, Nielsen O, Syljuåsen RG et al.. Cyclin-dependent kinase suppression by WEE1 kinase protects the genome through control of replication initiation and nucleotide consumption. Mol Cell Biol 2012; 32:4226–36; PMID:22907750; http://dx.doi.org/10.1128/MCB.00412-12 [DOI] [PMC free article] [PubMed] [Google Scholar]
- [13].Pfister SX, Markkanen E, Jiang Y, Sarkar S, Woodcock M, Orlando G, Mavrommati I, Pai CC, Zalmas LP, Drobnitzky N et al.. Inhibiting WEE1 Selectively Kills Histone H3K36me3-Deficient Cancers by dNTP Starvation. Cancer Cell 2015; 28:557–68; PMID:26602815; http://dx.doi.org/10.1016/j.ccell.2015.09.015 [DOI] [PMC free article] [PubMed] [Google Scholar]
- [14].Do K, Wilsker D, Ji J, Zlott J, Freshwater T, Kinders RJ, Collins J, Chen AP, Doroshow JH, Kummar S. Phase I Study of Single-Agent AZD1775 (MK-1775), a Wee1 Kinase Inhibitor, in Patients With Refractory Solid Tumors. J Clin Oncol 2015; 33(30):3409–15; PMID:25964244; http://dx.doi.org/10.1200/JCO.2014.60.4009 [DOI] [PMC free article] [PubMed] [Google Scholar]
- [15].Matheson CJ, Backos DS, Reigan P. Targeting WEE1 Kinase in Cancer. Trends Pharmacol Sci 2016; 37(10):872–81; PMID:27427153; http://dx.doi.org/10.1016/j.tips.2016.06.006 [DOI] [PubMed] [Google Scholar]
- [16].Kreahling JM, Foroutan P, Reed D, Martinez G, Razabdouski T, Bui MM, Raghavan M, Letson D, Gillies RJ, Altiok S. Wee1 inhibition by MK-1775 leads to tumor inhibition and enhances efficacy of gemcitabine in human sarcomas. PloS one 2013; 8:e57523; PMID:23520471; http://dx.doi.org/10.1371/journal.pone.0057523 [DOI] [PMC free article] [PubMed] [Google Scholar]
Associated Data
This section collects any data citations, data availability statements, or supplementary materials included in this article.