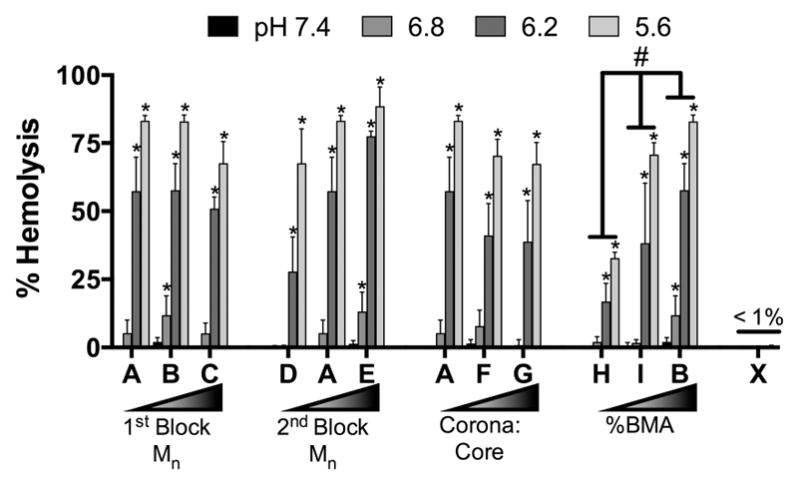
Figure 5.

pH-dependent hemolysis ability of NPs. *p < 0.05 compared to pH 7.4 for a given NP using two-way ANOVA with Dunnett’s correction for multiple comparisons. #p < 0.0001 comparing hemolysis across indicated NPs using two-way ANOVA with Tukey’s post hoc test for multiple comparisons. n = 8 from two independent experiments using blood from two separate donors. Error bars represent standard deviation.
