Abstract
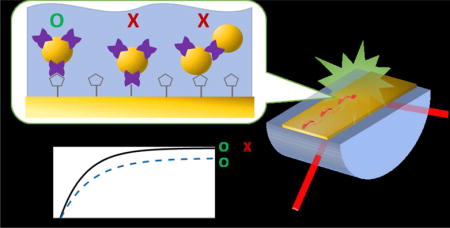
The ability to distinguish between specific and non-specific binding is important for assessing the interactions between protein receptors and ligands. Surface plasmon resonance (SPR) spectroscopy is an advanced tool to measure the binding events, yet the ability to distinguish between specific and non-specific binding remains a limitation. To address this problem, we use SPR spectroscopy correlated with surface enhanced Raman scattering (SERS). The chemical information present in SERS spectra provides insight into the molecular interactions between functionalized nanoparticles and proteins, which are not detectable by SPR alone. Using a custom instrument with the Kretschmann configuration, we successfully demonstrate simultaneous affinity and the chemical characterization of streptavidin-functionalized gold nanoparticles (STV-NPs) binding to biotin immobilized on a gold film in both air and flowing phosphate buffered saline (PBS). The SPR performance is consistent with previous reports. The association constant (KA) for streptavidin/biotin and STV-NPs/biotin interactions observed (2±1 ×10⁷ M−1 and 2.4±0.3 ×10¹⁰ M−1, respectively) agree with literature values and show a strong avidity effect associated with the STV-NPs. The SERS scattering from STV-NPs is excited by the surface plasmon polariton and collected from an objective lens mounted over the fluidic channel. The SERS spectra are recorded simultaneously with SPR sensorgram, and the detected Raman bands provide chemical insight into the binding event. Multivariate curve resolution analysis of the spectra can differentiate specific from non-specific binding. This label-free, real time and surface sensitive detection method provides chemical information to protein-ligand binding affinity measurements.
TOC image
Introduction
Surface plasmon resonance (SPR) is a powerful analysis technique and the most common method for determining molecular affinity.1,2 Due to its label-free, real time and analysis capabilities, SPR has been widely used as a biosensor to study a variety of applications including DNA/RNA hybridization,3–5 chemical signaling across cellular membranes,6 and recently it was developed for clinical uses.7 In addition, the sensitivity of SPR elucidates protein-ligand recognition without labeling, and provides real-time kinetic information about analytes.8–10
Despite its advantages, non-specific interactions remain a challenging problem in SPR detection,11,12 and a number of attempts have been made to address this challenge.1,2,5,10,13 Combining SPR with Raman spectroscopy is one approach to compensate for the lack of specificity.7 Raman spectroscopy can provide structural information of the molecule, which is not available with SPR alone. The intensity typical of Raman scattering is a challenge; however, the Raman signal can be enhanced by coupling with surface plasmon polaritons (SPPs). SPPs from flat metallic surfaces provide enhancements of 103–104, while localized surface plasmons (LSPs) from nanostructured metallic substrates (mainly silver and gold) can increase signals by 1010–1011.14–17 This surface enhanced Raman scattering (SERS) can give chemical information from small sample volumes and has been used in numerous applications.18
The idea of enhancing Raman signals with surface plasmon polaritons (SPPs) on flat metallic surfaces in a Kretschmann configuration originated in late 1960s,19–21 and more recently Etchegoin et al. and Smith et al. independently reported enhanced Raman signals from organic molecules such as Nile blue and pyridine.22,23 In their works, using flat metallic surfaces provides reproducible signals, but a low signal enhancement relative to most SERS reports. Xu et al. and Chen et al. then combined SPR and SERS using the LSPs from silver nanoparticles as well as the SPP on a silver film.24,25 Xu et al. showed the detection of 4-mercaptopyridine,24 while Chen et al. determined the secondary structures of oligonucleotides at the surface.24,25 Later, the Xu group detected protein-ligand complexes by assembling silver nanoparticles over a dye-labeled biotin and avidin sandwich array. The results showed a 6 fold SERS enhancement and 2.5 times increase in SPR sensitivity.26 Others have also reported improved SPR sensitivity with nanoparticles.27,28
Here, we further develop this combination platform to distinguish specific and non-specific binding of functionalized nanoparticles to monolayer surfaces. We demonstrate that streptavidin functionalized gold nanoparticles (STV-AuNPs) binding to a biotinylated monolayer on a gold film can be differentiated from non-specific adsorption of the STV-AuNPs to the monolayer surface on the basis of the observed SERS spectrum from the interacting molecules. By simultaneously recording SPR and SERS from functionalized gold nanoparticles binding to ligands on the SPR interface in flowing solutions, we demonstrate the potential of this approach to better elucidate protein-ligand specificity.
Experimental section
Materials
A 50nm thick Au film with a titanium adhesion layer on a coverglass (0.13–0.16mm thick) was purchased from Platypus Technologies, WI. STV-AuNPs (60nm) and biotin functionalized polyethylene glycol thiol (Biotin PEG Thiol, 25mg) were purchased from Nanocs Inc., NY. Streptavidin (25mg, Life technologies, CA) was diluted in PBS (pH 7.4, 0.1×). Other chemicals were purchased and used as received from Sigma-Aldrich, MO.
SPR-SERS combination instrument setup
SPR components and signal detection
A hemi-cylindrical sapphire prism (refractive index (RI) 1.7, Team Photon Inc., CA) was positioned at the center of dual-arm goniometer. Unlike typical SPR instruments, which have a rotating sample coupled with a movable detector to collect the reflected light, this goniometer keeps the sample position fixed and enables efficient collection of Raman scattering from the sample surface. The goniometer uses two motorized rotational stages (Thorlabs Inc., NJ) that are stacked and aligned vertically. One arm of the goniometer consists of a fiber coupled 632.8 nm HeNe laser (Melles Griot, NY) as shown in Figure 1a. The intensity of the beam is varied using cross polarizers. A polarizing beam splitter (N-SF1, Thorlabs, Inc.) is the second polarizer and insures p-polarization onto the sample interface. A lens (focal length 35 mm) provides a gentle focus onto the sample interface to minimize the intensity of the laser outside the detection area, typically a flow channel.
Figure 1.
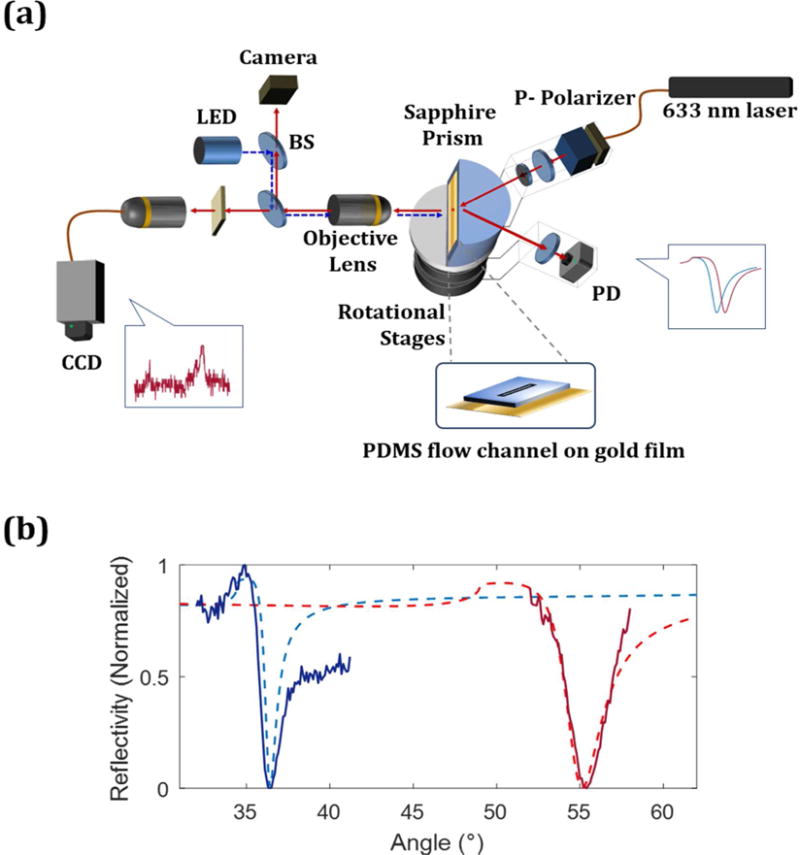
(a) A diagram of the SPR-SERS instrument is shown. (b) The experimental SPR curve (solid) obtained from SPR-SERS instrument is compared to theoretical values (dashed). At the air/gold (50nm thickness)/sapphire prism interface (blue), both experiment and calculation show an SPR angle of 36.4°. At the PBS/gold/prism interface (red), the theoretical SPR angle is 55.1° (red dotted line) and experimental SPR angle is 55.4° (red solid line).
Each arm of the goniometer can move from 30 to 60 degrees, enabling scanning over a wide range of angles with angular resolution of 0.01°. Using a sapphire prism we are able to monitor binding in both air and aqueous solutions (See Figure S1). The light reflected off the sample is collected with a planoconvex lens (focal length 25.4 mm) and focused onto a silicon photodiode (Thorlabs Inc.) in the other arm of the goniometer. To minimize noise a low pass electronic filter is applied to the output of the photodiode prior to the analog to digital converter. Figure 1b shows the reflectivity curve has the lowest reflection at the SPR angle, where the incident light couples into the gold film, resulting in the SPPs. The gold film is on a cover glass, which alters the SPR angle slightly. Figure S3 describes the correction between the mechanical angle of the goniometer and the incident angle onto the gold film. The goniometer angle and SPR data acquisition is controlled by LabView (National Instrument Corporation, TX). In Figure 1b, the experimentally observed SPR angles, 36.4° in air and 55.4° in PBS, are in excellent agreement with calculations performed using the SPR 4-Phase Fresnel Reflectivity Calculation program provided by Corn and coworkers.29 The refractive indices (RI) used are provided in Table S1 (Supporting information). The change in SPR response was verified by monitoring the assembly of the PEG-biotin-thiol monolayer and subsequent absorption of STV-AuNPs (See Supporting Figure S4).
SERS Components and signal detection
Light scattered at the Au/air or Au/water interface is collected by an objective lens (40×, 0.75 NA, Olympus) mounted normal to the gold/sample interface (Figure 1a). From the same laser spot used for SPR detection, Raman scattering is filtered from Rayleigh scattering using a 633nm dichroic mirror and 635 nm edge filter, and fiber coupled to a spectrograph (Kaiser Holospec f/2) and CCD (Andor Technology Ltd., UK). The Rayleigh scattering is reflected by the dichroic mirror and detected on a CMOS camera (Thorlabs Inc.). An LED lamp and beam splitter (Thorlabs Inc.) before the CMOS camera are used to visualize the laser spot and collection area on the Au surface. An extended description of the SPR sensorgram and simultaneous SPR-SERS measurements are provided in the Supporting Information.
Sample Preparation
Monolayers were prepared using standard self-assembly procedures. Additional details are provided in supporting information.
Data analysis
SPR curve, sensorgram, SERS spectra and multivariate curve resolution (MCR) were processed by using Matlab R2015a (Mathworks, MA).
Results and Discussion
SPR/SERS measurements
The streptavidin and biotin complex provides a well-described model system to assess specific and non-specific binding due to its high affinity and well-known SERS spectra.30–34 Differences in the affinity of streptavidin and STV-AuNPs are expected due avidity effects arising from the localized and increased protein coverage on the surface of functionalized nanoparticles.35 Figure 2a shows the sensorgrams observed from the sequential injection of streptavidin solution over the surface. By fitting the SPR response with increasing STV concentration to a Langmuir isotherm (Supporting information), we calculated KA = 2±1 ×10⁷ M−1, which is in excellent agreement with the results reported by Tang et al.10 SPR sensorgrams were also recorded flowing increasing concentrations of STV-AuNPs over a biotinylated gold surface (Figure 2c). The KA for STV-NPs and biotin is calculated to be 2.4±0.3 ×10¹⁰M−1. As expected, the KA value is larger for nanoparticles functionalized wit STV than for free STV for the biotin thiol bound on the surface.
Figure 2.
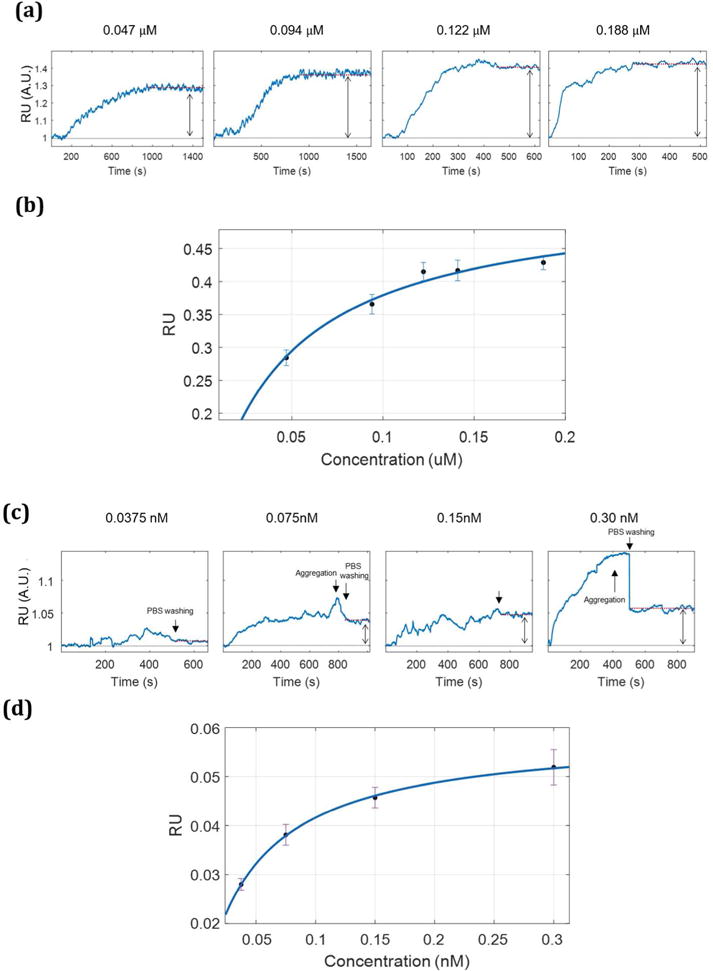
The SPR sensorgrams in (a) are detected with increasing concentrations (0.047, 0.094, 0.122, and 0.188 μM) of streptavidin solutions. The average reflectivity of each concentration was taken on the plateau of the sensorgram for each concentration (Δ= 0.03±0.01, 0.39±0.01, 0.42±0.01, 0.41±0.02, and 0.43±0.01 RU, respectively). The sensorgrams in (c) are obtained with increasing concentrations STV-NPs (0.030, 0.150, 0.075 and 0.0375 nM) and show the resulting increase (Δ= 0.05±0.04, 0.046±0.002, 0.038±0.002, and 0.008±0.001 RU, respectively). The absorption isotherms shown in (b) and (d) were used to calculate the binding constant using the Langmuir isotherm equation (Supporting information). KA for streptavidin- biotin pair is 2.49 ×10⁷ M−1, and 2.42 ×10¹⁰ M−1 for the STV-NPs to biotin.
The adsorption of STV-AUNPs to biotinylated Au-films enables detection of Raman bands characteristic of biotin-STV binding. Figure 3 illustrates the increased SERS response of the STV-AuNPs when excited by the SPP. The excitation angle was scanned from 33° to 40° in 0.5° increments, using a 3s acquisition at each angle. In Figure 3b, the intensity of the SERS signal is observed to increase as the angle approaches the SPR angle, and shows the maximum response at the SPR angle. This agrees with previous angle dependent SERS measurements obtained independently by Smith et al. and Etchegoin et al.22,23 A small difference in the SERS intensity at the SPR angle and the angle of maximum slope indicates that a significant evanescent field is present at a small range of angles near the SPR angle to excite SERS while recording a sensorgram at the angle of maximum slope. In addition to increased Raman scattering, we also observed increased background from sapphire and silica surfaces in agreement with previous reports.36
Figure 3.
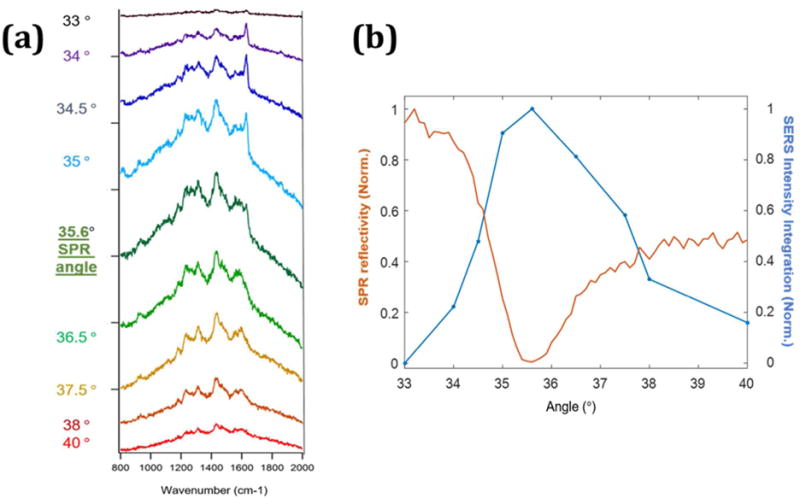
The SERS spectra in air from STV-AuNPs (0.1 nM) drop coated on biotin/MUOH gold film is measured while scanning the incident laser angle. As shown in (a), The SERS intensity increases and decreases with changes in the excitation angle. The maximum enhanced Raman intensity is observed at 35.6°. The spectra are offset for clarity. (b) The Blue line indicates the integration of the SERS signal and the orange line is simultaneously detected SPR reflectivity. The SPR angle (35.6°) with lowest reflectivity matches the highest intensity observed in the SERS measurement. A constant offset was applied to the SERS spectra, such that the lowest intensity in the spectrum corresponded to zero, before integration.
Differentiating specific/non-specific binding
In Figure 2, the SPR sensorgrams obtained from functionalized nanoparticles show larger fluctuations prior to the equilibrium portion of the curve relative to the sensorgrams observed from the free protein. This increased noise could arise from laser fluctuations, alternatively this may reflect the more drastic changes in the RI arising from nanoparticles within the evanescent field, which may be specifically nor non-specifically bound to the film. Previous reports have shown that the SPR signal can be affected by a single nanoparticle in the detection volume.3,37,38
The observed Raman signal provides a means to differentiate between specific and nonspecific binding. The correlated SPR-SERS signal observed from 0.3 nM of STV-AuNPs flowing over a biotin/11-mercapto-1-undecanol (MUOH) monolayer is shown in Figure 4. As STV-AuNPs interact with the surface, the SPR sensorgram (Figure 4a) shows a Δ 0.15 RU increase that corresponds to an increase in the SERS signal (Figure 4b). After washing with PBS at 500s, the equilibrium value of Δ 0.052 RU is observed. The observed SERS signal decreases in a correlated fashion, which indicates the SERS can inform on the chemical interactions associated with STV-AuNPs binding to biotin. The SERS spectra at specific timepoints are shown in Figure 4c. The 25 s timepoint is before evidence of binding occurs in the SPR trace. From 70s, the SERS spectra observed are consistent with previous reports of streptavidin.34 The peaks at 1290–1300 cm−1 and 1440–1460 cm−1 are assigned to methylene (CH2) and methyl (CH3) groups.34 The peaks at 1350 cm−1 and 1560 cm−1 peaks are associated with C-N vibrations of Trp in streptavidin.34 Peaks at 1045–1050 cm−1 and 1160–1170 cm−1, observed after PBS washing, are attributable to either biotin or streptavidin.33 The observed SERS signal in the equilibrium region is well conserved, as noted by the similarity of the spectra at 665 and 700s in Figure 4c. The SERS spectrum of the biotin-STV-AuNP complex is reported to be markedly different from aggregated STV-AuNPs.34 In particular, bands observed at 1047–1053 and at 1132 and 1173 cm−1 are associated with biotin provide clear evidence of the biotin-streptavidin interaction.
Figure 4.
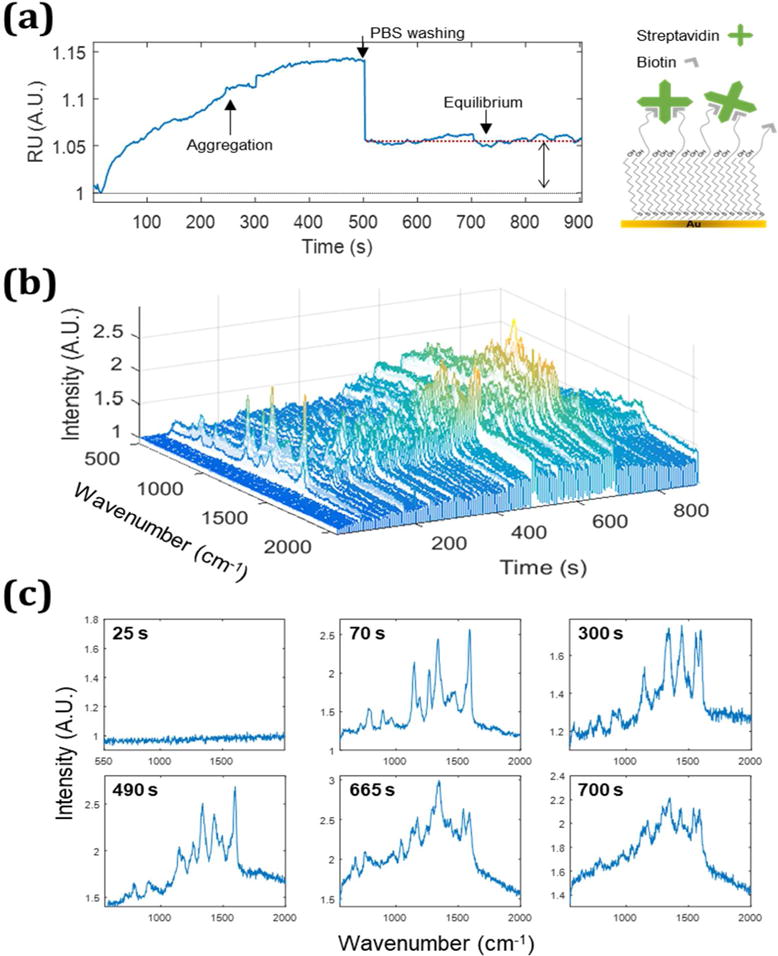
The simultaneous detection of SPR (a) and SERS (b) from STV-AuNPs (0.3 nM) on a biotin/MUOH mixed monolayer on a gold film is shown. An inset next to (a) is a scheme of the mixed monolayer. (c) Selected SERS spectra at specific timepoints (25, 70, 300, 490, 665 and 700s) are shown.
To further assess the chemical specificity of the SERS spectrum, SPR-SERS was performed using a MUOH monolayer on the gold film without biotin (Figure 5). Even in the absence of biotin on the substrate, the SPR sensorgram shows increases resulting from nonspecific binding of the functionalized nanoparticles. After washing with PBS, most of these particles are removed; however, the sensorgram shows a small increase, Δ 0.02 RU, and SERS signals are still observed, indicating nanoparticles are still adsorbed to the surface. After 370 s, there are common peaks at 1530–1540 cm−1 and 1440– 1450 cm−1(CH2 and CH3) attributable STV-AuNPs.34 Other time point spectra show sporadic peaks at 1220–1230cm−1(700s, 845s) and 1600 cm−1 (370s and 845 s). Peaks at 1140 and 1358 cm−1 temporarily emerge at 370s and 535s, and disappear after washing with PBS. Interestingly, several distinct peaks observed in the specific binding experiment are not present in the spectrum with a MUOH monolayer. Figure 6 illustrates differences in the SERS spectrum from the equilibrium region of the SPR sensorgram obtained from the biotinylated and MUOH control surfaces. The strong peaks at 1047–1053 cm−1(biotin), 1132 cm−1 (C-N and valine), 1173 cm−1(Phe, Tyr, Val) and 1242 cm−1 (Ureido ring) are only shown in biotinylated surface. Among those, the peaks at 1132 and 1173 cm−1 match previous reports of streptavidin and biotin complex.34
Figure 5.
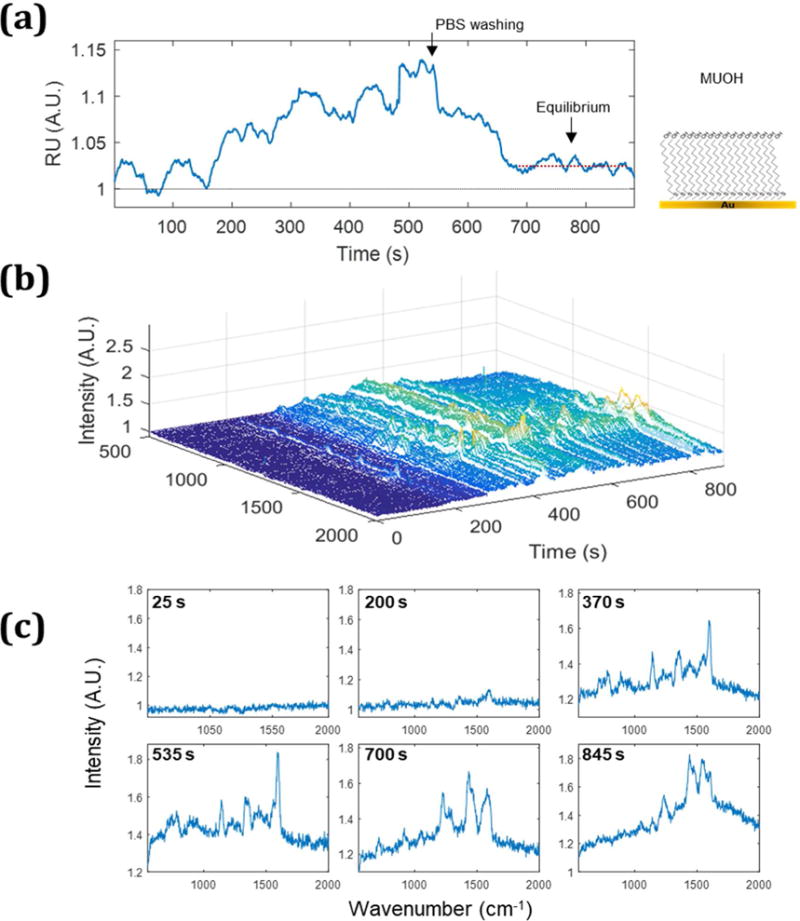
The simultaneous detection of SPR (a) and SERS (b) from STV-AuNPs (0.3 nM) on MUOH monolayer (without biotin) on a gold film is shown. An inset next to (a) is a scheme of the monolayer. (c) Selected SERS spectra at specific timepoints (25, 200, 370, 535, 700 and 845 s) are shown.
Figure 6.
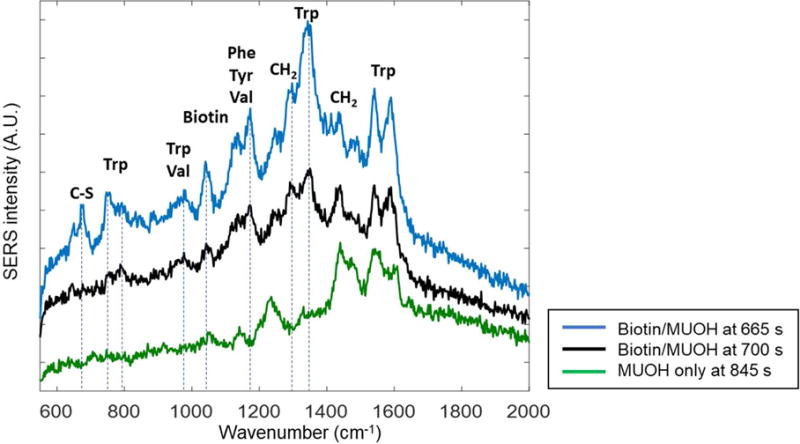
SERS spectra observed after washing with PBS are compared from the biotin/MUOH mixed monolayer (black and blue traces) and the MUOH monolayer (green trace). The spectra observed from monolayer with biotin (blue line, Figure 5c t=665s and black line, Figure 5c t=700s) show peaks representative of streptavidin-biotin interactions that are not observed in from control experiments with the MUOH only monolayer (green line, Figure 6c t=845s). Assigned peak are well-matched to the streptavidin -biotin Raman observed in the previous work.34 While the peaks from streptavidin and MUOH appear in all spectra (1440, 1540 and 1590 cm−1), several distinct peaks are only shown in biotinylated surface but not on the control surface (defined as dotted lines).
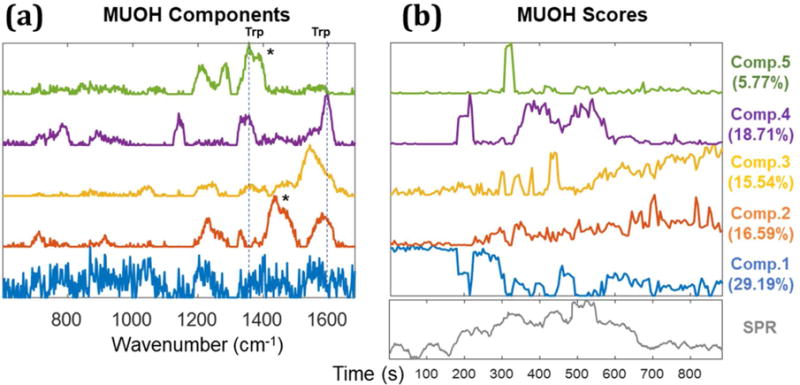
To further investigate the ability to discriminate between specific and non-specific binding, multivariate curve resolution analysis was performed on the time dependent SERS data. In Figure 7a, the variance in the SERS data can be described by 5 components, as indicated in the scree plot associated with MCR analysis (Supporting Information S5). The MCR scores show the contribution of each component to the observed spectrum at every time point (Figure 7b). The MCR analysis of MUOH control surface is shown in Figure 8.
Figure 7.
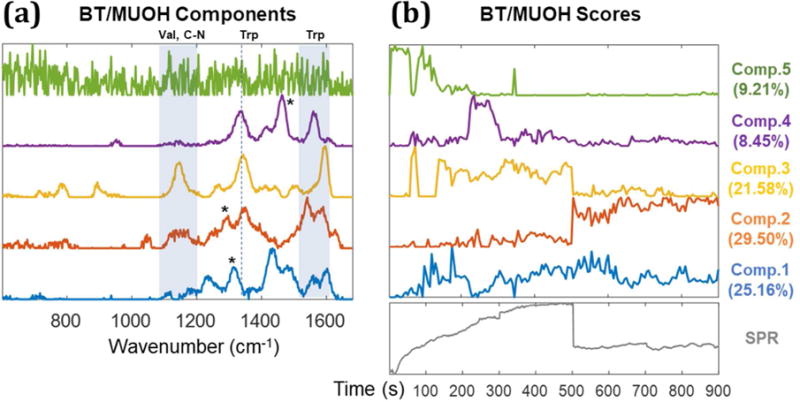
MCR analysis of SERS spectra from STV-NPs on the biotin-MUOH SAM. The original SERS data used for MCR analysis is shown in Figure 4 b. MCR components are illustrated in (a); the peaks from Tryptophan (1335–1350, 1560, and 1590cm−1) are assigned.34 The peaks around 1130–1149cm−1 mainly come from valine and C-N functional group. Asterisks (*) indicate components from CH2 and CH3.34 (b) MCR scores: Component 1 and 2 are attributed to specific binding of biotin and streptavidin and remain after washing. Component 3 and 4, which disappear after PBS washing at 500s, are attributed to components from aggregated nanoparticles. Component 5 is attributed to the background from gold film. The SPR sensorgram is shown below the MCR scores (b) to clarify the correspondence to the SPR experiment.
Figure 8.
MCR analysis of SERS spectra from STV-NPs on the MUOH SAM control surface. The original SERS data used for each MCR analysis is shown in Figure 5b. MCR components are illustrated in (a) and the corresponding scores are plotted in (b). In a similar fashion to Figure 7, component 1 is attributed to the background. Component 2 and 3 are nonspecific binding of STV-NPs to the MUOH surface. Component 4 and 5 arise from the nanoparticle aggregates. The peaks at 1335–1350, and 1590cm−1 are assigned to tryptophan and asterisks (*) indicate components from CH2 and CH3 modes.34 To compare the timepoint, SPR sensorgram is inserted below the MCR scores (b).
To understand the different components, we consider possible sources of SERS signals. One possible source for a non-specific SERS signal is nanoparticle aggregation. Aggregated AuNPs can evince a significant Raman signal if they are within the evanescent field. Additionally, if these aggregated particles adsorb in the detection region, an SPR response will also be observed. Using the combination of the SERS signal, SPR signal, and solution conditions, it is possible to use the MCR results interpret the origin of the different signals. In Figure 7, component 3 is attributed to the SERS from non-specifically absorbed nanoparticles aggregates. As the aggregated particles are not tightly fixed on the surface, the SERS intensity will fluctuate as the nanoparticle containing solution flows. For example, the SERS spectrum at 70s shows a, out-of-trend, higher intensity than other timepoints (Figure 4c). The corresponding MCR analysis at 70s, attributes this signal to component 3. Additionally, a spike is observed in the SPR sensorgram at 70 s, which is consistent with an aggregate at the surface. A similar trend is observed between 200–300s for component 4. The MCR scores for both components 3 and 4 are almost zero after PBS washing, further associating these signals with nonspecific aggregates.
On the other hand, the scores of components 1 and 2 remain after washing and suggest AuNPs binding to the surface. The scores of components 1 and 2 comprise a larger fraction of the total signal after 500s. The scores represent the fraction of the total signal, such that the binding likely occurs before 500s but its relative contribution is less in the presence of background and non-specifically adsorbed particles and aggregates. The peaks observed in component 1 and 2 match to reference spectra from biotin-STV-NPs complex34 further indicating that they represent specific-binding. It is not clear why there are two components attributed to specific binding, but they may reflect specific binding of aggregates or possibly orientation differences with respect to the gap mode that provides enhancement.
The assignment of non-specific binding and aggregates is further supported by analysis of the the control MUOH surface (Figure 8). Component 4 is highly similar to component 3 of biotin/MUOH surface in Figure 7, which was assigned to weakly adsorbed aggregates. The time dependent score of component 5 is also consistent with a weakly adsorbed aggregate. As expected, the scores of both components disappear after PBS washing. Meanwhile, component 2 and 3 are attributed to more strongly bound non-specific interactions of the STV-NPs onto the MUOH surface, whose score remaining after washing. Here the SERS spectra show only peaks from streptavidin and can be discerned from specific interactions by the lack of peaks attributable to the biotin-STV complex.
Interestingly, the luminescence background previously observed at SPR angle (Figure 3) is shown in MCR analysis of both biotin/MUOH and MUOH surface in common (component 5 and 1, respectively). The score of the luminescence associated component decreases as AuNPs interact to the surface. As the score is a relative measure of the total signal, this apparent decrease results from the other components’ increasing contributions to the overall signal.
From the relative scores in the MCR analysis, we calculated the fraction of the specific binding to nonspecific binding and aggregation observed in the equilibrium region of the SPR sensorgram (Figure 7) from 500 to 900 s. At each time point in Figure 7, the score for each component is divided by the sum of all 5 scores and Q residuals to calculate an average percentage. The fraction of component 1 and 2, which we attribute to specific binding is 31.11 and 57.09%, respectively. The nonspecific binding and aggregation comprise 4.11% (component 3) and 5.20% (component 4). Background luminescence contributes 0.67% and 1.82% remains unassigned in the residuals. Thus, 88.20% of total signal is attributed to specific binding.
In conclusion, we successfully demonstrated the combination of SPR-SERS to distinguish specific and non-specific binding from functionalized nanoparticles. Matching calculated SPR reflectivity curves and reproducing the KA of streptavidin for biotin in solution validated the instrument. The avidity effect of functionalizing a nanoparticle with streptavidin was demonstrated, by measuring a 103 higher affinity for the functionalized nanoparticles with maximum SERS intensity at the SPR angle. Using the SERS signal arising from the gap mode between the nanoparticle and SPR film, simultaneous SPR-SERS sensorgrams were measured in real time without fluorescence labels. MCR analysis demonstrates that SPR-SERS instrument can differentiate between specific and non-specific binding. We believe that this approach will improve studies of nanoparticle affinity relevant to nanomedicine and other applications.
Supplementary Material
Acknowledgments
We thank Paul Johns at University of Notre Dame for helping us with LabView programing. This work was supported by award R01 GM109988 from the National Institute for General Medical Sciences, part of the National Institutes of Health, and CHE- 1507287 from the National Science Foundation.
Footnotes
Supporting Information Available: Supplementary figures S1–S5, and Table S1 are included. This material is available free of charge at http://pubs.acs.org
References
- 1.Green RJ, Frazier RA, Shakesheff KM, Davies MC, Roberts CJ, Tendler SJB. Biomaterials. 2000;21:1823–1835. doi: 10.1016/s0142-9612(00)00077-6. [DOI] [PubMed] [Google Scholar]
- 2.Couture M, Zhao SS, Masson JF. Phys Chem Chem Phys. 2013;15:11190–11216. doi: 10.1039/c3cp50281c. [DOI] [PubMed] [Google Scholar]
- 3.Nelson BP, Grimsrud TE, Liles MR, Goodman RM, Corn RM. Anal Chem. 2001;73:1–7. doi: 10.1021/ac0010431. [DOI] [PubMed] [Google Scholar]
- 4.Yih JN, Chiu KC, Chien FC, Chen WY, Chen SJ. Proc SPIE. 2006;6099:609906-609901–609906-609908. [Google Scholar]
- 5.Nguyen H, Park J, Kang S, Kim M. Sensors. 2015;15:10481–10510. doi: 10.3390/s150510481. [DOI] [PMC free article] [PubMed] [Google Scholar]
- 6.Abadian PN, Kelley CP, Goluch ED. Anal Chem. 2014;86:2799–2812. doi: 10.1021/ac500135s. [DOI] [PubMed] [Google Scholar]
- 7.Masson J-F. ACS Sens. 2017;2:16–30. doi: 10.1021/acssensors.6b00763. [DOI] [PubMed] [Google Scholar]
- 8.Homola J, Yee SS, Gauglitz G. Sens Actuators, B. 1999;54:3–15. [Google Scholar]
- 9.Huang B, Yu F, Zare RN. Anal Chem. 2007;79:2979–2983. doi: 10.1021/ac062284x. [DOI] [PubMed] [Google Scholar]
- 10.Tang Y, Mernaugh R, Zeng X. Anal Chem. 2006;78:1841–1848. doi: 10.1021/ac051868g. [DOI] [PMC free article] [PubMed] [Google Scholar]
- 11.Meyer SA, Auguie B, Le Ru EC, Etchegoin PG. J Phys Chem A. 2012;116:1000–1007. doi: 10.1021/jp2107507. [DOI] [PubMed] [Google Scholar]
- 12.Ahmed FE, Wiley JE, Weidner DA, Bonnerup C, Mota H. Cancer Genomics Proteomics. 2010;7:303–309. [PubMed] [Google Scholar]
- 13.Furuya M, Haramura M, Tanaka A. Bioorg Med Chem. 2006;14:537–543. doi: 10.1016/j.bmc.2005.09.030. [DOI] [PubMed] [Google Scholar]
- 14.Willets KA, Van Duyne RP. Annu Rev Phys Chem. 2007;58:267–297. doi: 10.1146/annurev.physchem.58.032806.104607. [DOI] [PubMed] [Google Scholar]
- 15.Haynes CL, McFarland AD, Duyne RPV. Anal Chem. 2005;77:338 A–346 A. [Google Scholar]
- 16.Sharma B, Frontiera RR, Henry A-I, Ringe E, Van Duyne RP. Mater Today. 2012;15:16–25. [Google Scholar]
- 17.Ushioda S, Sasaki Y. Phys Rev B. 1983;27:1401–1404. [Google Scholar]
- 18.Stender AS, Marchuk K, Liu C, Sander S, Meyer MW, Smith EA, Neupane B, Wang G, Li J, Cheng JX, Huang B, Fang N. Chem Rev. 2013;113:2469–2527. doi: 10.1021/cr300336e. [DOI] [PMC free article] [PubMed] [Google Scholar]
- 19.Kretschmann E. Z Phys A: Hadrons Nucl. 1971;241:313–324. [Google Scholar]
- 20.Kretschmann E, Raether H. Z Naturforsch. 1968;23:2135–2136. [Google Scholar]
- 21.Giergiel J, Reed CE, Hemminger JC, Ushioda S. J Phys Chem. 1988;92:5357–5365. [Google Scholar]
- 22.Meyer SA, Le Ru EC, Etchegoin PG. Anal Chem. 2011;83:2337–2344. doi: 10.1021/ac103273r. [DOI] [PubMed] [Google Scholar]
- 23.McKee KJ, Meyer MW, Smith EA. Anal Chem. 2012;84:4300–4306. doi: 10.1021/ac203355a. [DOI] [PubMed] [Google Scholar]
- 24.Liu Y, Xu S, Xuyang X, Zhao B, Xu W. J Phys Chem Lett. 2011;2:2218–2222. [Google Scholar]
- 25.Kawata S, Chiu KC, Shalaev VM, Yu LY, Lin CY, Tsai D-P, Chen SJ. Proc SPIE. 2007;6642:66420H-66421–66420H-66429. [Google Scholar]
- 26.Fu C, Hu C, Liu Y, Xu S, Xu W. Anal Methods. 2012;4:3107. [Google Scholar]
- 27.Lyon LA, Musick MD, Natan MJ. Anal Chem. 1998;70:5177–5183. doi: 10.1021/ac9809940. [DOI] [PubMed] [Google Scholar]
- 28.Severs AH, Schasfoort RBM. Biosens Bioelectron. 1993;8:365–370. [Google Scholar]
- 29.Code for SPR angle calculations was made available by research group of Prof. Corn, R. M. at http://unicorn.ps.uci.edu/calculations/fresnel/fcform.html.
- 30.Jeppesen C, Wong JY, Kuhl TL, Israelachvili JN, Mullah N, Zalipsky S, Marques CM. Science. 2001;293:465–468. doi: 10.1126/science.293.5529.465. [DOI] [PubMed] [Google Scholar]
- 31.Srisa-Art M, Dyson EC, deMello AJ, Edel JB. Anal Chem. 2008;80:7063–7067. doi: 10.1021/ac801199k. [DOI] [PubMed] [Google Scholar]
- 32.Galarreta BC, Norton PR, Lagugne-Labarthet F. Langmuir. 2011;27:1494–1498. doi: 10.1021/la1047497. [DOI] [PubMed] [Google Scholar]
- 33.Carrier SL, Kownacki CM, Schultz ZD. Chem Commun. 2011;47:2065–2067. doi: 10.1039/c0cc05059h. [DOI] [PMC free article] [PubMed] [Google Scholar]
- 34.Wang H, Schultz ZD. Analyst. 2013;138:3150–3157. doi: 10.1039/c3an36898j. [DOI] [PMC free article] [PubMed] [Google Scholar]
- 35.Li M-H, Choi SK, Leroueil PR, Baker JR. ACS Nano. 2014;8:5600–5609. doi: 10.1021/nn406455s. [DOI] [PubMed] [Google Scholar]
- 36.McKee KJ, Meyer MW, Smith EA. Anal Chem. 2012;84:9049–9055. doi: 10.1021/ac3013972. [DOI] [PubMed] [Google Scholar]
- 37.Liang W, Wang S, Festa F, Wiktor P, Wang W, Magee M, LaBaer J, Tao N. Anal Chem. 2014;86:9860–9865. doi: 10.1021/ac5024556. [DOI] [PMC free article] [PubMed] [Google Scholar]
- 38.Smith EA, Thomas WD, Kiessling LL, Corn RM. J Am Chem Soc. 2003;125:6140–6148. doi: 10.1021/ja034165u. [DOI] [PubMed] [Google Scholar]
Associated Data
This section collects any data citations, data availability statements, or supplementary materials included in this article.


