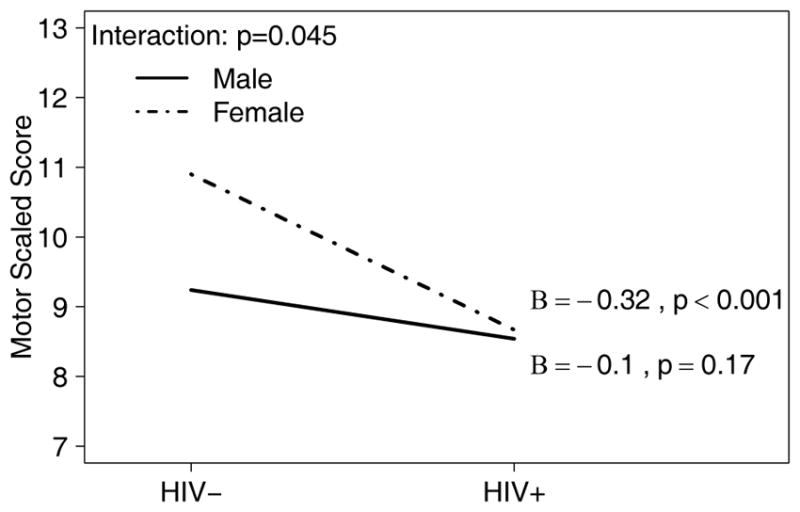
Figure 1.

Visual representation of the sex x HIV interaction effect on the scaled score for the motor domain.
Note: Effect size Beta (B) and p-value are shown for the effect of HIV status (on the x-axis), separately for each sex (represented by lines).
