Abstract
Automated and reproducible sample handling is a key requirement for high-throughput compound screening, and currently demands heavy reliance on expensive robotics in screening centers. Integrated droplet microfluidic screening processors are poised to replace robotic automation by miniaturizing biochemical reactions to the droplet scale. These processors must generate, incubate, and sort droplets for continuous droplet screening, passively handling millions of droplets with complete uniformity, especially during the key step of sample incubation. Here, we disclose an integrated microfluidic emulsion creamer that packs (“creams”) assay droplets by draining away excess oil through microfabricated drain channels. The drained oil co-flows with creamed emulsion and then reintroduces the oil to disperse the droplets at the circuit terminus for analysis. Creamed droplet emulsion assay incubation time dispersion was 1.7%, 3-fold less than other reported incubators. The integrated, continuous emulsion creamer (ICEcreamer) was used to miniaturize and optimize measurements of various enzymatic activities (phosphodiesterase, kinase, bacterial translation) under multiple- and single-turnover conditions. Combining the ICEcreamer with current integrated microfluidic DNA-encoded library bead processors eliminates potentially cumbersome instrumentation engineering challenges and is compatible with assays of diverse target class activities commonly investigated in drug discovery.
TOC Graphic
Introduction
Scale-up poses one of the most significant barriers to initiating a high-throughput screening campaign. The microplate-based format for large-scale screening is prohibitive due to high reagent cost and robotic sample handling, and despite efforts to establish academic screening infrastructure, technology access is still limited to a privileged few.1 Droplet microfluidics affords assay miniaturization (~103–106-fold volume reduction) and replaces robotic automation with integrated flow-based handling on chip, eliminating many scale-up concerns. Microfluidic screening platforms have now exist for many applications,2 ranging from identification of novel enzyme activity modulators3–5 and optimal assay conditions,6,7 to isolation of rare and desirable protein and cell phenotypes.8–12 To achieve these complicated analyses, microfluidic circuit architectures routinely integrate many complex droplet-scale operations,12,13 such as merging,14–16 splitting,17–19 sorting,20,21 synchronization,22–24 and incubation.25–27
Sample incubation is a common operation during screening, so incubators appear frequently in microfluidic screening circuits. On-chip incubator design is chiefly concerned with controlling incubation duration, while minimizing both incubation time dispersion arising from Poiseuille flow25 and impact on the performance of other in-line components.20,28,29 Incubators generally function at lower oil:aqueous fractions compared to droplet generation.25 As oil is extracted from the droplet flow, the droplets begin to pack in a process called “creaming.”25,29,30 Creamed emulsions are also frequently incubated off-chip, where creaming maximizes the number of compartments one can store in the syringe.20,28,31
Here, we describe a completely integrated, continuous emulsion creamer (ICEcreamer) that exhibits enhanced incubation performance. The ICEcreamer incubator integrates oil removal and reincorporation with no additional tubing or circuitry. It operates with single aqueous and oil inputs and incubates droplets up to 26 min within 25 mm of channel length while maintaining <2% incubation dispersion. We demonstrate the utility of the ICEcreamer by miniaturizing various assays of common drug discovery target activities (phosphodiesterase, kinase, bacterial translation) to the droplet scale. The ICEcreamer has the potential to simplify circuit design and operation of integrated microfluidic screening platforms while providing homogenous sample handling and rapid assay miniaturization.
Experimental Section
Materials sources
All reagents were obtained from Sigma Aldrich (St. Louis, MO) unless otherwise specified. Leucine aminopeptidase (LAP), Bovine serum albumin (BSA, Roche Diagnostics, Indianapolis, IN), polydimethylsiloxane (PDMS, Dow Corning, Midland, MI), 5(6)-carboxyrhodamine 110 (R110, Anaspec, Fremont, CA), c-AMP dependent protein kinase A (PKA, New England BioLabs, Ipswich, MA), phycoerythrin (Anaspec), 5(6)-carboxytetramethylrhodamine (TAMRA, Anaspec), and Taq DNA polymerase (Taq, New England Biolabs) were used as provided.
Microfluidic device fabrication
Unless otherwise noted, device thin and thick layers were 55 µm and 150 µm, respectively. Master channel heights were measured using a stylus profilometer (DektakXT, Bruker, Billerica, MA). Individual ICEcreamer variants are designated based on their incubator length and width relative to the reference ‘1×-wide 1×-long’ device, which has length = 11.5 mm and width = 0.7 mm. Channel structures were fabricated in PDMS using soft lithography.32 Degassed PDMS prepolymer (44 g, 10:1 base:curing agent) was poured over the master, polymerized (1 h, 80 °C), cooled (10 min, rt), and peeled from the master. Fluidic ports were punched with a biopsy punch (0.75 mm dia., World Precision Instruments, Inc., Sarasota, FL). PDMS molds and glass slides were cleaned with Seque soap, then rinsed with DI water and isopropyl alcohol prior to immersion in acid hydrolysis solution (5:1:1 DI H2O/HCl/H2O2, 30 min). Glass slides and PDMS molds were rinsed with DI water and isopropyl alcohol, then immediately bonded (overnight, 80 °C).33 Microbore Tygon tubing (0.01-in. i.d. × 0.03-in. o.d., Saint Gobain, Valley Forge, PA) or PTFE tubing (0.018-in. i.d. × 0.03-in. o.d., Zeus Industrial Products, Orangeburg, SC) connected device fluid input ports to aqueous-containing glass syringes (100 µL, Hamilton, Reno, NV) using blunt-tip Luer-Lok needles (30 gauge, Small Parts, Inc., Miramar, FL) and beveled Leur-Lok needles (26 gauge, Becton, Dickinson and Company, Franklin Lakes, NJ), respectively. Oil was delivered to fluidic inputs from glass syringes (500 µL, Hamilton) coupled to the device using the same Leur-Lok needles and PTFE tubing. Fluids from 100- and 500-µL syringes were driven into the circuit with syringe pumps (Legato 180, and Legato 100, respectively, KD Scientific, Holliston, MA). Circuits were backfilled with oil via syringe pump (3 µL/min) prior to operation.
Oil
Unless otherwise noted, oil for droplet generation consisted of 3% w/w KF-6038 (ShinEtsu, Tokyo, Japan) in squalene (TCI America, Portland, OR). Oil was prepared by combining components and mixing with agitation (1 h, 500 rpm).
Droplet incubation analysis
Low- and high-dye concentration droplet generation was alternated using two aqueous inputs. Both inputs contained phycoerythrin (200 ng/mL) in buffer (20 mM Tris-HCl pH 8.3, 2.5 mM CaCl2, 150 mM NaCl, 5 mg/mL BSA). AQ1 additionally contained fluorescein (300 nM). Aqueous flow rates were alternated between 3:1 (AQ1/AQ2), and 1:3 (AQ1/AQ2) v/v for high-to-low droplet fluorescence transitions. The flow programming was reversed for low-to-high droplet fluorescence transitions. QOIL was constant at the indicated flow rate. Confocal laser-induced fluorescence (LIF, λex = 488 nm, 20 mW; λem = 520 nm; λem = 570 nm) of the droplet flow was monitored at the incubation line terminus. A fluorescence intensity threshold was set in the 520-nm channel to distinguish high- and low-fluorescence droplet populations. Data were analyzed with R (RStudio, Boston, MA) to calculate incubation time and transition time. Transient LIF background noise was subtracted using the empirical count threshold. Droplets were then identified as runs of positive-value data points. Droplets were binned by 6-s intervals as either ‘high’ or ‘low’ based on an empirical threshold, and the droplet population transition data were fitted to the Gaussian cumulative distribution function. The fitted equation inflection point indicated transition time (t), and dispersion ratio was calculated as 6σ/t.25,26 Time t = 0 was defined as the point at which the syringe pump flows were switched, and the droplet incubation time was defined as the time from t = 0 to the observed transition time.
Autotaxin activity assay
The in-droplet assay was adapted using reagents from a 96-well plate autotaxin inhibitor screening kit (Echelon Biosciences Inc., Salt Lake City, UT). For steady-state autotaxin activity, AQ1 solution contained fluorogenic FS-3 probe (2.5 µM) and internal standard TAMRA (2 µM) in buffer (10 mM Tris-HCl, pH 8.3). AQ2 contained autotaxin (100 nM) in buffer (1/10 diluted kit buffers C and D). Aqueous inputs were both held constant (150 nL/min) as was QOIL (300 nL/min). Positive control experiments used identical conditions with the addition of PF-8380 (100 µM) in AQ1. Single-turnover experiments were run identically, except that AQ1 contained FS-3 (200 nM), AQ2 contained autotaxin (600 nM), AQ1 and AQ2 flows (300 nL/min), and oil flow (600 nL/min) were held constant. Normalized fluorescence was calculated as the ratio of signal in the probe (520 nm) and internal standard (570 nm) channels. Aqueous solutions were connected to fluidic inputs via Tygon tubing. Autotaxin-containing solutions (50 µL) were hand-drawn into Tygon tubing (100 cm) and then attached to a glass syringe (100 µL, Hamilton) pre-loaded with silicone fluid (DMF-A-6cs, ShinEtsu) via Luer-Lok needles (30 gauge). Oil used for all autotaxin experiments was 4% w/w KF-6038 in squalene. Oil was prepared by combining components and mixing with rotation (1 h, 500 rpm).
PKA inhibition assay
AQ1 contained R110 probe (3 µM), TAMRA (1.5 µM), and KF-6012 (0.03% v/v in PBS, ShinEtsu). AQ2 contained LAP (0.09 U/mL) and PKA (25,000 U/ml) in buffer (PBS, 10 mM MgCl2, 100 µM ATP). AQ1/AQ2/OIL flow rates were held constant (100/200/300 nL/min, respectively). Droplet fluorescence was calculated as the ratio of signal in the 520- to 570-nm channels. All aqueous inputs were connected to fluidic inputs via PTFE tubing. Tubing for AQ2 was filled with Starting Block in PBS Blocking Buffer (Thermo Fisher Scientific, Waltham, MA) and incubated (overnight, 4 °C) prior to use. Positive control experiments used identical conditions with the addition of H-9 (600 µM) in AQ1.
In vitro eGFP expression
Plasmid DNA containing an eGFP gene insert (pET45b-eGFP2) was PCR amplified by combining plasmid template (1.2 ng) with PCR buffer (10 mM Tris-HCl, 50 mM KCl, 1.5 mM MgCl2, pH 8.3), dNTPs (200 µM each), Taq (0.05 U/µL), and forward and reverse oligonucleotide primers (0.2 µM each, 5′–TGCGTCCGGCGTAGAGGATC–3′ and 5′–AGACCGAGATAGGGTTGAGTGTTG–3′). The reaction (45 µL) was thermally cycled (95 °C, 180 s, [95 °C, 20 s, 65 °C, 30 s, 72 °C, 60 s]×20 cycles, C1000, Bio-Rad, Hercules, CA), and the products were confirmed by agarose gel, purified (QiaQuick PCR purification kit, Qiagen, Inc., Valencia, CA), and quantitated by A260. In vitro transcription/translation reagent (IVTT, PURExpress, New England Biolabs) was used to express eGFP in droplets. AQ1 contained eGFP-encoding PCR product (5.7 ng/µL), TAMRA (2 µM), and PURExpress component A (40% v/v). AQ2 contained PURExpress component B. AQ1/AQ2/OIL flow rates were held constant at 80/120/250 nL/min. Positive control experiments were conducted identically with the addition of streptomycin (14 µM) in AQ1. Droplet fluorescence was taken as 520-nm channel signal (eGFP). Aqueous solutions were connected to fluidic inputs via Tygon tubing (see above). PURExpress component B solutions (50 µL) were hand-drawn into Tygon tubing (100 cm long) and then attached to a glass syringe (100 µL, Hamilton) pre-loaded with DMF-A-6cs via 30-gauge Luer-Lok needles. Microtiter plate assays were conducted using identical conditions, but without TAMRA.
Results & Discussion
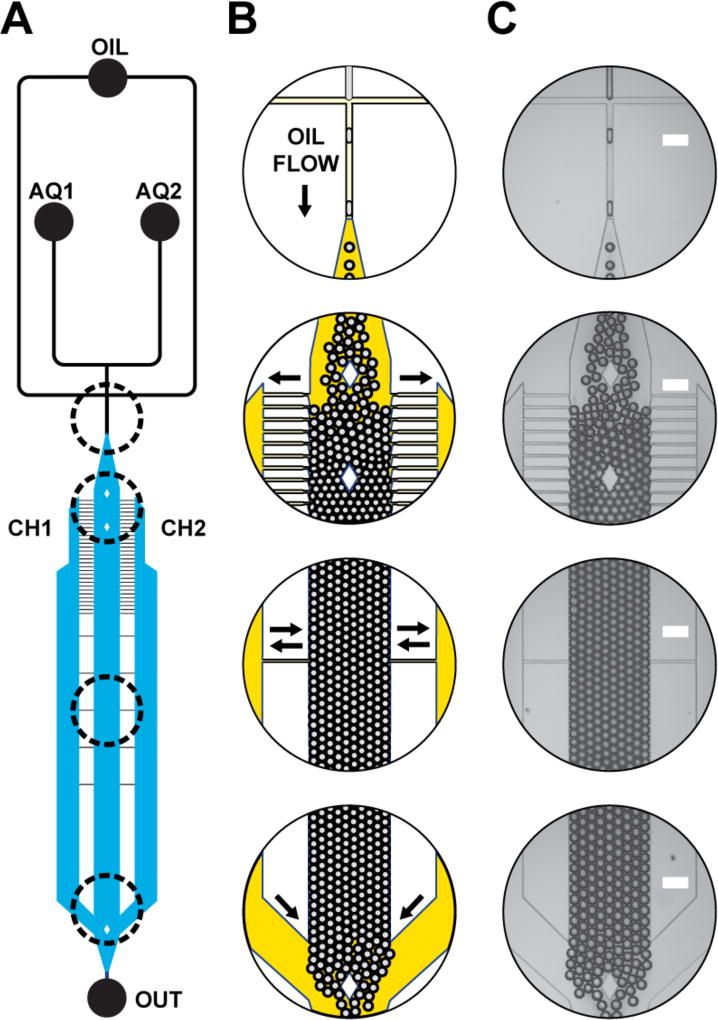
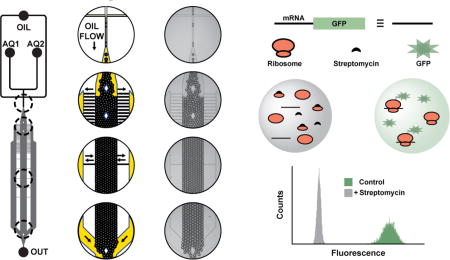
Continuous water-in-oil (W/O) emulsion generation, creaming, and incubation occurred on a single microfluidic device (Figure 1). Droplets were generated with a flow-focusing junction.34 Emulsions were creamed25,29,30 by draining oil from the central incubation channel into two adjacent oil chambers via thin-tipped oil-drain channels. Droplet packing restricts lateral movement, resulting in a uniform, non-parabolic flow profile.25 Fluids from the oil reservoirs and incubation channel combine at the circuit terminus, unpacking the droplets.
Figure 1. ICEcreamer circuit schematic and operation.
(A) Oil and aqueous solutions enter at inputs OIL, AQ1, and AQ2. A flow-focusing junction generates droplets, which immediately enter the 1-cm-long incubation chamber. Channels depicted in black and blue are 55-µm and 85-µm high, respectively. (B) A schematic of emulsion creaming depicts relative channel depth by oil opacity. Droplets pack as oil is removed from the central droplet incubation chamber. Oil travels into two oil chambers (CH1, CH2) via 20-µm-wide, 12.5-µm tipped oil drain channels. Oil drain channels are tipped to discourage droplets from exiting the central incubation chamber. Downstream equilibration channels allow oil to exchange between the central incubation chamber, CH1, and CH2 in response to varying back pressure. Oil is reintroduced at the end of the incubation line and droplets unpack. (C) Micrographs illustrate integrated and continuous emulsion creaming. Scale = 200 µm
Incubation is a ubiquitous operation in chemistry and biology, and therefore a central consideration of microfluidic miniaturization. The emulsions of compartmentalized reactions are typically stored in an independent incubation device,7 or creamed and collected off-chip with a syringe, incubated, and reinjected into a separate device for further analysis.20,28,31 For shorter assays (< 1 h), integration of microfluidic droplet generation and incubation architectures eliminates error associated with manual sample handling, increasing reproducibility.12,13,35 The ICEcreamer circuit simplifies droplet incubation by reintroducing the separated oil with emulsion at the circuit terminus, obviating the need for additional oil outlet tubing.
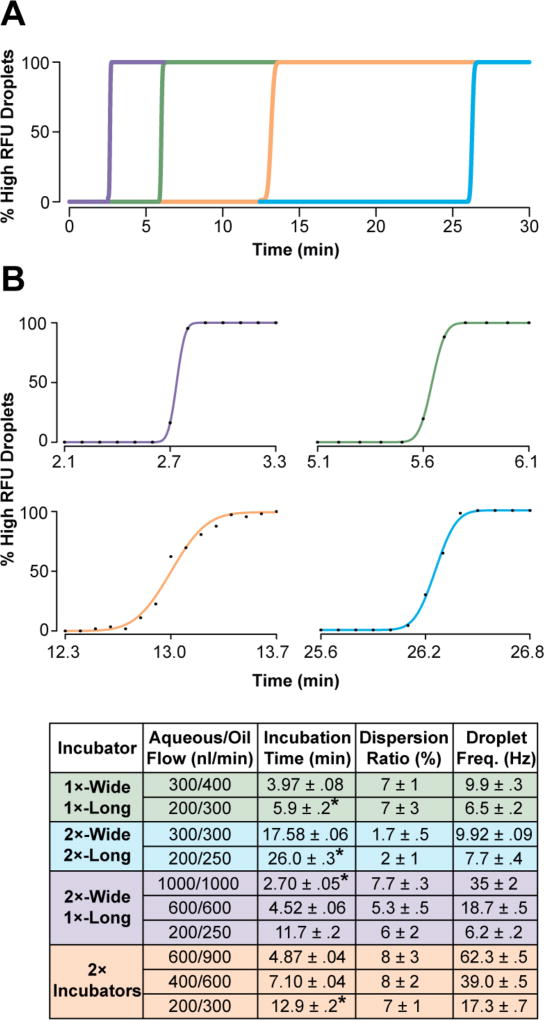
ICEcreamer circuit design was explored to induce packed droplet flow, restricting droplet lateral motion, and thereby minimizing parabolic flow. As a result, packed droplets transit the incubation line with equivalent velocity.25 Droplets with alternating (high and low) dye concentrations were generated and droplet LIF signal was acquired at the incubator terminus. The transition between droplet populations was used to quantitate the incubation time (t, the inflection) and dispersion ratio (6σ/t).25,26 Droplet population transition data from four different ICEcreamer designs (Figure S1) were fitted to the Gaussian cumulative distribution function (Figure 2).25 Incubation time and dispersion ranged from 2.7—26 min and 1.7—8%, respectively, depending on design. Incubation time scaled with aqueous flow rate: increasing aqueous flow rate from 200 to 300 nL/min reduced incubation time by 30%. Relative device incubation time for a given aqueous flow rate scaled with incubation channel volume: addition of a second incubator doubled incubation time. Doubling the incubator width did not impact incubation dispersion ratio (7% vs 6%, P = 0.62, two-tailed t-test), but doubling both the incubator’s width and length significantly reduced dispersion ratio (7% vs 2%, P = 0.03, two-tailed t-test) (Figure 2, bottom). The 2×-wide 2×-long incubator flowing 300 nL/min aqueous reaches 1.7% incubation dispersion, a >3-fold reduction in dispersion relative to reported droplet incubation devices (5.5 – 13.4%).25–27
Figure 2. Incubation characterization with ICEcreamer circuit variants.
Droplet incubation times and dispersion ratios were determined by alternating between generation of high- and low-dye concentration droplets, and monitoring the delay in transition between droplet populations at the incubation line terminus. Droplet population transitions were fitted to the Gaussian cumulative distribution function. (A) Representative fits of ICEcreamer variants’ transitions are shown with (B) individual fitted examples of droplet population transition experiments. Incubation times and dispersion ratios of four ICEcreamer circuit variants (150-µm-high incubation channel) were characterized with multiple flow rates. Conditions used in droplet population transition curves are marked with an asterisk.
The incubation dispersion ratio measures droplet incubation uniformity, which is particularly important for activity-based screening. A high dispersion ratio reflects inconsistent droplet-to-droplet incubation time, which intensifies the variance of reaction progress measurements, and may ultimately manifest as statistically unacceptable assay quality.36 Variable incubation time is particularly problematic when signal generation is nonlinear, as can be the case for more complex assays that involve coupled enzymatic processes,37 reconstituted metabolic cycles,38 lysate, or living cells.
This study parameterizes ICEcreamer design, suggesting further modifications to the circuit in pursuit of greater throughput, increased incubation time, and reduced dispersion. Incubation time is proportional to incubator volume. Incubator volume scales with channel width, and increasing channel width did not increase dispersion ratio. In fact, proportionally scaling up both incubator width and length reduced the dispersion ratio by increasing t without changing σ. Thus, incubation time variance appears to stem entirely from droplet packing (see Supporting Information). Further increasing the incubation channel width will require PDMS supports or greater channel depths to maintain appropriate aspect ratios and prevent channel collapse.39 Pursuing such changes would be advantageous because they would reduce backpressure,40 allowing lengthened incubation channels that increase incubation time and further reduce dispersion.
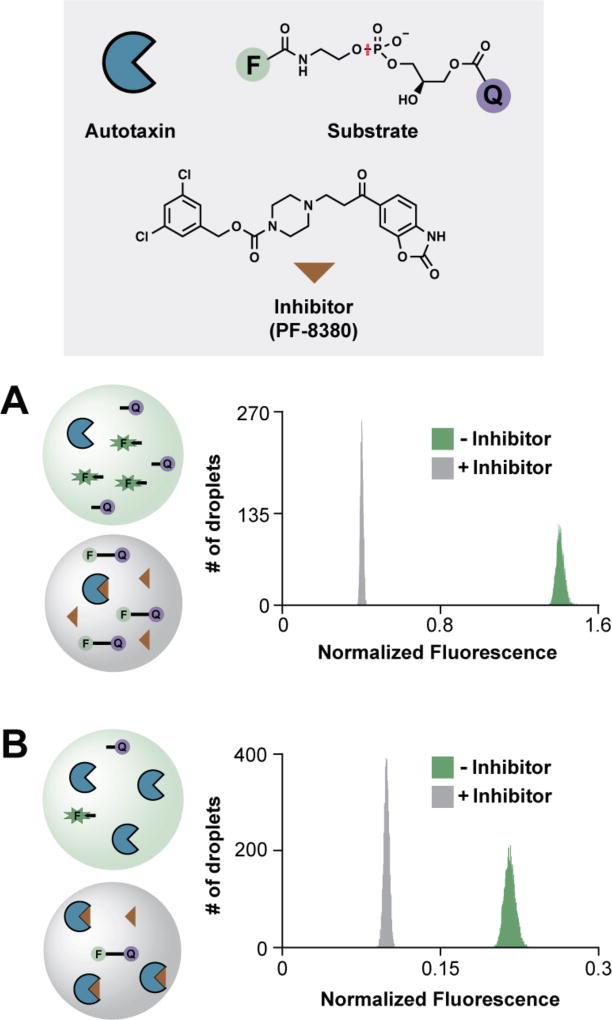
As a first example application, we creamed an activity-based assay of the enzyme autotaxin. Autotaxin’s phosphodiesterase activity can be monitored in vitro using a fluorogenic probe consisting of a fluorophore and quencher coupled via glycerophosphodiester bond.41 The assay was initially conducted in the steady-state kinetic regime ([S] >> [E]) using positive control autotaxin inhibitor PF-8380.42 Assay performance was quantitated as Z′ based on the separation of positive and negative control populations:36
| (1) |
where Z′ ≥ 0.5 indicates assay suitability for high-throughput screening (HTS). Fitting droplet LIF population data to Gaussian cumulative distribution functions yields σpos, μpos, σneg, and μneg as described previously.26 For the steady-state autotaxin activity assay (Figure 3A), Z′ = 0.88. An alternative assay approach under single-turnover conditions ([S] ~ [E]) yielded Z′ = 0.80 with 4.5-min incubation at ambient temperature (Figure 3B).
Figure 3. Detection of autotaxin inhibition in ICEcreamer incubators.
(A) Under steady-state conditions, autotaxin (blue pac-man, 50 nM) cleaves fluorogenic phosphodiesterase probe (F–Q, 1.3 µM), liberating fluorescein (green F) from the quencher and increasing droplet fluorescence. The scissile bond is indicated (red). PF-8380 (brown triangle) inhibits autotaxin-catalyzed probe hydrolysis, and droplet fluorescence remains low (Z′ = 0.88). Assays were conducted in the 2×-wide 2×-long ICEcreamer, which incubates droplets for 17.6 min. (B) Under single-turnover conditions, autotaxin (300 nM) rapidly cleaves the probe (100 nM) in the 2×-wide 1×-long ICEcreamer incubator, which incubates droplets for 4.5 min (Z′ = 0.80). Normalized droplet fluorescence was taken as the ratio of signal in the 520- and 570-nm channels (probe:standard). Each histogram represents 5,000 droplets.
Autotaxin’s lysophospholipase D activity catalyzes the formation of lysophosphatidic acid. Dysregulated autotaxin activity has been implicated in tumor progression,43 and is the target in a clinical investigation of idiopathic pulmonary fibrosis (clinical trial number NCT02738801). The ICEcreamer steady-state assay conditions and timescale are like those used in conventional robotic HTS,42 albeit with ~104-fold volume reduction, no enzyme-inhibitor pre-incubation step, and no sample heating. One autotaxin inhibitor screening kit, containing 2.5 µg autotaxin, can form 106 individual reactions (~500-pL droplets, 50 nM autotaxin), eliminating scale-up of screening target production. Single-turnover conditions are further advantageous because they require less incubation and lower [S]. Decreased incubation permits higher flow rates, resulting in >3.5-fold increased droplet generation rate. Single-turnover conditions ([E] ~ [S]) are generally not feasible for microtiter well plate-based HTS due to the dramatic increase in enzyme consumption and microplate reader sensitivity limitations. Picoliter-scale reaction volume coupled with high-sensitivity LIF detection of substrate turnover minimizes the quantity of enzyme per reaction, permitting screening under single-turnover conditions.
The steady-state autotaxin activity assay serves as an excellent model system for understanding the impact of incubation uniformity on an assay’s statistical robustness. Incubation dispersion is an inherent property of an incubator under given flow conditions, and is therefore unchanging between positive and negative assay conditions, or σneg = σpos = σdisp. Equation 1 can be solved for Z′ ≥ 0.5 in terms of σdisp and Δμ as Δμ ≥ 12σdisp. Increases in incubation dispersion will require a proportional increase in population mean separation. In the steady-state autotaxin assay, [E] and [S] remain approximately constant and signal increases linearly over the course of the reaction. The Δμ is then defined as the reaction velocity multiplied by incubation time. For a defined incubation time the only way to to compensate for greater incubation dispersion is by increasing [E] and [S] to increase Δμ. However, reaction velocity gains from increasing [S] are limited as [S] approaches KM, and increasing [E] is not always straightforward, as is the case when utilizing reconstituted metabolic systems, cells/cell lysate, or multiple coupled enzymatic processes.
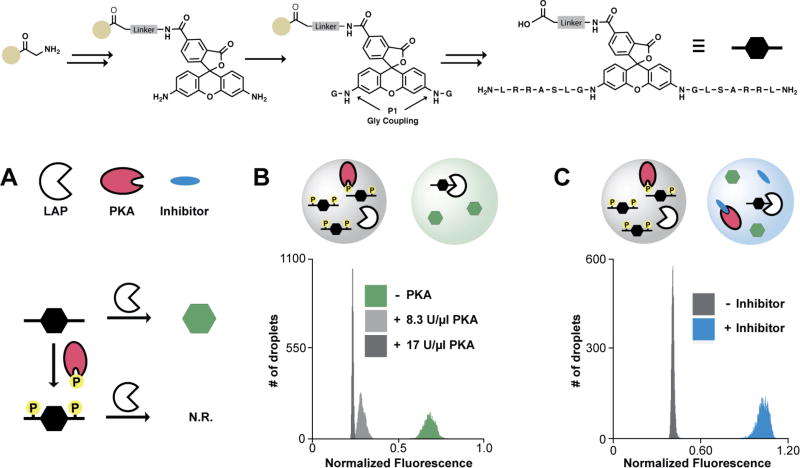
As a second example of ICEcreamer incubation, we examined an activity-based assay of PKA. A rhodamine 110 (R110) probe of PKA activity44 was prepared via solid-phase synthesis (Figure 4, top).45 Product sufficient for ~108 droplet-based reactions was obtained after a single analytical-scale purification step. The R110 PKA probe was used to optimize a droplet-scale assay of PKA activity wherein LAP and PKA mediate competing transformations of the R110 substrate. LAP digests the R110 probe and generates fluorescence; PKA phosphorylates the R110 substrate, inhibiting LAP digestion of the probe (Figure 4A). The assay’s ratio of LAP:PKA was optimized in the ICEcreamer circuit using a simple three-channel splitting valve (Figure S3). [LAP] was held constant (90 mU/mL) while [PKA] was varied step-wise (0—17,000 U/mL). [PKA] was increased until LAP activity was minimized, as evidenced by an improvement in the negative population’s coefficient of variance (CV, from 6.6 to 2.2%) (Figure 4B). The optimized assay conditions yielded Z′ = 0.74 using positive control inhibitor H-9 (Figure 4C).
Figure 4. Detection of kinase inhibition in the ICEcreamer incubator.
The R110 probe was synthesized via iterative Fmoc deprotection and amide coupling reactions (top). (A) LAP cleaves amino acid residues from the bisamide amino termini, restoring R110 fluorescence following LAP-mediated P1 cleavage. Amino acid side chain phosphorylation inhibits LAP exopeptidase activity. Low fluorescence intensity indicates PKA activity. (B) Assay LAP/PKA ratio was optimized on-chip using fixed [LAP] while varying [PKA]. Increasing [PKA] to the point that LAP activity became negligible had a modest effect on population mean, but greatly reduced the negative population’s spread; the assay Z′ (+/− PKA) increased from 0.57 to 0.72. (C) Under optimized conditions, H-9 was used as a positive control inhibitor of PKA (Z′ = 0.74). Normalized droplet fluorescence was taken as the ratio of signal in the 520- and 570-nm channels (probe:standard). Assays were incubated 17.6 min using the 2×-wide 2×-long ICEcreamer. Each histogram population represents 5,000 droplets.
Expedient probe synthesis and assay optimization are key for economical droplet-based screening. Solid-phase synthesis of R110 probes provides rapid access to fluorogenic substrates for diverse target classes. The synthetic route does not require intervening extraction or purifications and proceeds primarily via 5-min ambient-temperature amide couplings. R110 probes for various targets, including other kinases,44 phosphatases,46 serine/aspartyl proteases, esterases,47 and deubiquitinases,48 should be similarly accessible by solid-phase synthesis. Facile and cost-effective probe development is particularly useful in determining target feasibility for droplet-based screening.
Activity assay development in segmented flow involves evaluating and optimizing both target enzyme and probe performance at the droplet scale. Probe performance issues largely stem from unwanted partitioning of hydrophobic compounds into the oil continuous phase, which has been the subject of extensive investigation.49–51 There are numerous straightforward strategies to abrogate inappropriate partitioning. BSA, dextran, and sucrose reduce small molecule partitioning into oil.49,50 Negatively charged probes (e.g., via sulfation) also disfavor partitioning.52,53 The PKA probe design incorporated this concept in the form of an ionizable carboxylic acid terminus. The packed, semi-static nature of the ICEcreamer incubator could lend to small molecule transport between droplets. However, sufficiently hydrophobic compounds will remain largely in the oil phase, while equilibration of hydrophilic compounds across packed droplets can take many hours.51 Such partitioning would likely be most problematic for extremely sensitive assays (e.g. signal amplification generation via signal transduction pathway, positive feedback loop, enzyme activation) or in studying enzymes with extremely potent, moderately hydrophobic inhibitors.
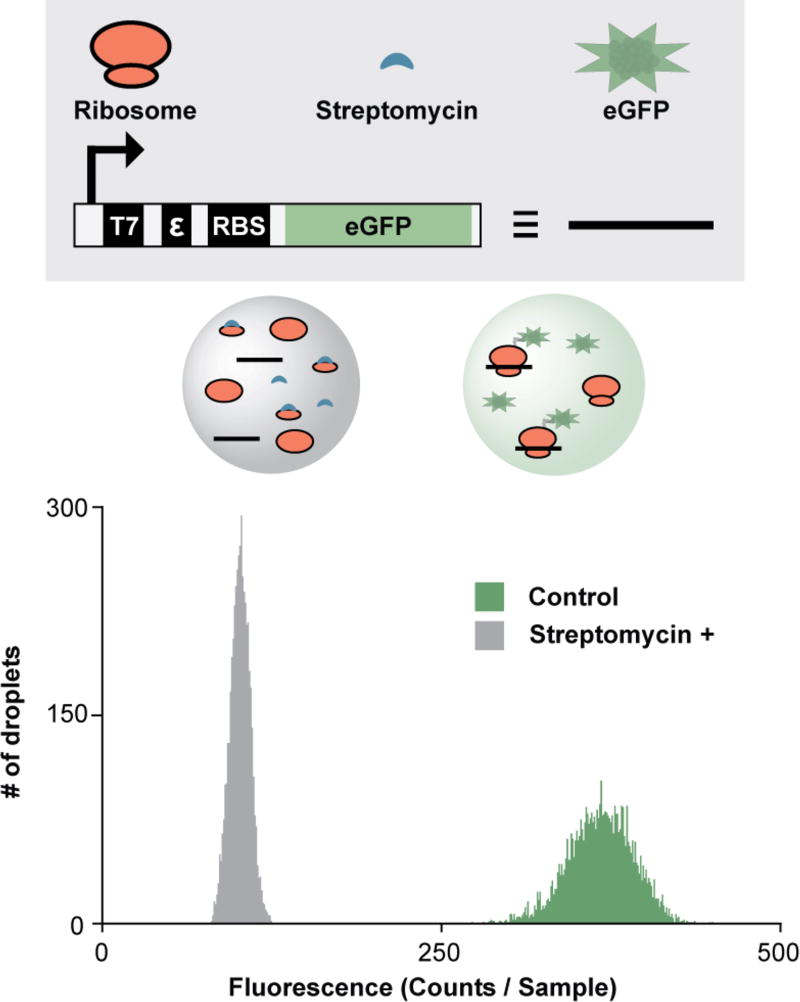
As a third application, we developed a droplet-scale bacterial in vitro translation assay. Fluorescent protein expression was used as an indicator of bacterial ribosome activity. Bacterial IVTT reagents38 were encapsulated in droplets along with an eGFP-encoding PCR product (eGFP DNA, Figure 5). After 26-min incubation, eGFP expression was detectable at ambient temperature. Addition of positive control inhibitor streptomycin (an inhibitor of bacterial translation) significantly attenuated eGFP production, yielding Z′ = 0.64.
Figure 5. Detection of in vitro protein synthesis in the ICEcreamer incubator.
The eGFP-encoding DNA construct contains the eGFP open reading frame, a T7 RNA polymerase promoter (T7) to initiate transcription, an epsilon enhancer (ε), and a ribosome binding site (RBS). DNA templates encoding eGFP were transcribed and translated at ambient temperature with incubation in the 2×-wide 2×-long ICEcreamer (26-min incubation). Streptomycin inhibited eGFP expression in positive control droplets (Z′ = 0.64). Each histogram represents 5,000 droplets.
The bacterial IVTT activity can be used to screen for inhibitors of ribosomal protein synthesis and potentially antibiotic activity. The assay layout is simple relative to a phenotypic cytotoxicity screen because IVTT reagents are homogeneously distributed in droplets in contrast to Poisson-limited single-cell encapsulation.31 Identical microtiter plate experiments yielded minimal eGFP signal with 25-min incubation (Figure S4). The difference in relative signal generation over time is likely owed to the minimal background noise and high sensitivity of LIF detection.
Detection of protein expression by IVTT machinery in droplets further enables other discovery-oriented experiments, such as directed evolution. Integrated droplet microfluidic experiments for directed evolution yield dramatic increases in enzymatic activity12 and require minimal sample handling relative to emulsion reinjection.9,10,20,54 However, integrated experiments currently rely on cell-based gene library distribution. As an alternative, gene libraries can be expressed with IVTT in droplets starting from plasmid,28 and could also be used to express protein from template-coated beads (BEAMing).45,55 In contrast to cell-based library distribution, neither of these approaches require transformation or bacterial population expansion steps, which are bottlenecks for library generation and diversity.56,57
Conclusion
The ICEcreamer is a simple architecture for on-chip incubation that is compatible with various assay formats conducted at the droplet scale. Creamed emulsion incubation also paves the way for simplified instrument design because it minimizes inputs/outputs and achieves experimentally useful incubation times with low incubation dispersion. Together, these features and capabilities will facilitate incorporation of droplet incubation with multiple other droplet manipulation modules for fully integrated microfluidic discovery platforms.12,13
Supplementary Material
Acknowledgments
We thank Karla Montejo for assistance in device fabrication. This work was supported by an NSF CAREER Award (1255250) and an NIH Research Grant Award (GM120491). WGC gratefully acknowledges support from a Farris Foundation Graduate Research Fellowship Award. AKP gratefully acknowledges an NIH Health Mentored Quantitative Research Career Development Award (AI128000).
Footnotes
The Supporting Information is available free of charge on the ACS Publications website. Experimental details, additional results, movies
References
- 1.Schreiber SL, Kotz JD, Li M, Aubé J, Austin CP, Reed JC, Rosen H, White EL, Sklar LA, Lindsley CW, Alexander BR, Bittker JA, Clemons PA, de Souza A, Foley MA, Palmer M, Shamji AF, Wawer MJ, McManus O, Wu M, Zou B, Yu H, Golden JE, Schoenen FJ, Simeonov A, Jadhav A, Jackson MR, Pinkerton AB, Chung TDY, Griffin PR, Cravatt BF, Hodder PS, Roush WR, Roberts E, Chung D-H, Jonsson CB, Noah JW, Severson WE, Ananthan S, Edwards B, Oprea TI, Conn PJ, Hopkins CR, Wood MR, Stauffer SR, Emmitte KA NIH Molecular Libraries Project Team. Cell. 2015;161:1252–1265. doi: 10.1016/j.cell.2015.05.023. [DOI] [PMC free article] [PubMed] [Google Scholar]
- 2.Price AK, Paegel BM. Anal. Chem. 2015;88:339–353. doi: 10.1021/acs.analchem.5b04139. [DOI] [PMC free article] [PubMed] [Google Scholar]
- 3.Miller OJ, Harrak El A, Mangeat T, Baret J-C, Frenz L, Debs El B, Mayot E, Samuels ML, Rooney EK, Dieu P, Galvan M, Link DR, Griffiths AD. Proc. Natl. Acad. Sci. U. S. A. 2012;109:378–383. doi: 10.1073/pnas.1113324109. [DOI] [PMC free article] [PubMed] [Google Scholar]
- 4.Sun S, Kennedy RT. Anal. Chem. 2014;86:9309–9314. doi: 10.1021/ac502542z. [DOI] [PMC free article] [PubMed] [Google Scholar]
- 5.Guetschow ED, Steyer DJ, Kennedy RT. Anal. Chem. 2014;86:10373–10379. doi: 10.1021/ac502758h. [DOI] [PMC free article] [PubMed] [Google Scholar]
- 6.Li L, Mustafi D, Fu Q, Tereshko V, Chen DL, Tice JD, Ismagilov RF. Proc. Natl. Acad. Sci. U. S. A. 2006;103:19243–19248. doi: 10.1073/pnas.0607502103. [DOI] [PMC free article] [PubMed] [Google Scholar]
- 7.Cho S, Kang D-K, Sim S, Geier F, Kim J-Y, Niu X, Edel JB, Chang S-I, Wootton RCR, Elvira KS, deMello AJ. Anal. Chem. 2013;85:8866–8872. doi: 10.1021/ac4022067. [DOI] [PubMed] [Google Scholar]
- 8.Brouzes E, Medkova M, Savenelli N, Marran D, Twardowski M, Hutchison JB, Rothberg JM, Link DR, Perrimon N, Samuels ML. Proc. Natl. Acad. Sci. U. S. A. 2009;106:14195–14200. doi: 10.1073/pnas.0903542106. [DOI] [PMC free article] [PubMed] [Google Scholar]
- 9.Agresti JJ, Antipov E, Abate AR, Ahn K, Rowat AC, Baret J-C, Marquez M, Klibanov AM, Griffiths AD, Weitz DA. Proc. Natl. Acad. Sci. U. S. A. 2010;107:4004–4009. doi: 10.1073/pnas.0910781107. [DOI] [PMC free article] [PubMed] [Google Scholar]
- 10.Fallah-Araghi A, Baret J-C, Ryckelynck M, Griffiths AD. Lab Chip. 2012;12:882–891. doi: 10.1039/c2lc21035e. [DOI] [PubMed] [Google Scholar]
- 11.Debs El B, Utharala R, Balyasnikova IV, Griffiths AD, Merten CA. Proc. Natl. Acad. Sci. U. S. A. 2012;109:11570–11575. doi: 10.1073/pnas.1204514109. [DOI] [PMC free article] [PubMed] [Google Scholar]
- 12.Obexer R, Godina A, Garrabou X, Mittl PRE, Baker D, Griffiths AD, Hilvert D. Nat. Chem. 2017;9:50–56. doi: 10.1038/nchem.2596. [DOI] [PubMed] [Google Scholar]
- 13.MacConnell AB, Price AK, Paegel BM. ACS Comb. Sci. 2017;19:181–192. doi: 10.1021/acscombsci.6b00192. [DOI] [PMC free article] [PubMed] [Google Scholar]
- 14.Song H, Tice JD, Ismagilov RF. Angew. Chem., Int. Ed. 2003;42:768–772. doi: 10.1002/anie.200390203. [DOI] [PubMed] [Google Scholar]
- 15.Chabert M, Dorfman KD, Viovy J-L. Electrophoresis. 2005;26:3706–3715. doi: 10.1002/elps.200500109. [DOI] [PubMed] [Google Scholar]
- 16.Abate AR, Hung T, Mary P, Agresti JJ, Weitz DA. Proc. Natl. Acad. Sci. U. S. A. 2010;107:19163–19166. doi: 10.1073/pnas.1006888107. [DOI] [PMC free article] [PubMed] [Google Scholar]
- 17.Link DR, Anna SL, Weitz DA, Stone HA. Phys. Rev. Lett. 2004;92:054503. doi: 10.1103/PhysRevLett.92.054503. [DOI] [PubMed] [Google Scholar]
- 18.Tan Y-C, Fisher JS, Lee AI, Cristini V, Lee AP. Lab Chip. 2004;4:292. doi: 10.1039/b403280m. [DOI] [PubMed] [Google Scholar]
- 19.Abate AR, Weitz DA. Lab Chip. 2011;11:1911–1915. doi: 10.1039/c0lc00706d. [DOI] [PubMed] [Google Scholar]
- 20.Baret J-C, Miller OJ, Taly V, Ryckelynck M, Harrak El A, Frenz L, Rick C, Samuels ML, Hutchison JB, Agresti JJ, Link DR, Weitz DA, Griffiths AD. Lab Chip. 2009;9:1850–1858. doi: 10.1039/b902504a. [DOI] [PubMed] [Google Scholar]
- 21.Sciambi A, Abate AR. Lab Chip. 2015;15:47–51. doi: 10.1039/c4lc01194e. [DOI] [PMC free article] [PubMed] [Google Scholar]
- 22.Frenz L, Blouwolff J, Griffiths AD, Baret J-C. Langmuir. 2008;24:12073–12076. doi: 10.1021/la801954w. [DOI] [PubMed] [Google Scholar]
- 23.Hong J, Choi M, Edel JB, deMello AJ. Lab Chip. 2010;10:2702–2708. doi: 10.1039/c005136e. [DOI] [PubMed] [Google Scholar]
- 24.Xu L, Lee H, Panchapakesan R, Oh KW. Lab Chip. 2012;12:3936–3937. doi: 10.1039/c2lc40456g. [DOI] [PubMed] [Google Scholar]
- 25.Frenz L, Blank K, Brouzes E, Griffiths AD. Lab Chip. 2009;9:1344–1348. doi: 10.1039/b816049j. [DOI] [PMC free article] [PubMed] [Google Scholar]
- 26.Price AK, MacConnell AB, Paegel BM. Anal. Chem. 2016;88:2904–2911. doi: 10.1021/acs.analchem.5b04811. [DOI] [PMC free article] [PubMed] [Google Scholar]
- 27.Dai J, Kim HS, Guzman AR, Shim W-B, Han A. RSC Adv. 2016;6:20516–20519. [Google Scholar]
- 28.Mazutis L, Baret J-C, Treacy P, Skhiri Y, Araghi AF, Ryckelynck M, Taly V, Griffiths AD. Lab Chip. 2009;9:2902–2908. doi: 10.1039/b907753g. [DOI] [PubMed] [Google Scholar]
- 29.Mary P, Abate AR, Agresti JJ, Weitz DA. Biomicrofluidics. 2011;5:24101. doi: 10.1063/1.3576934. [DOI] [PMC free article] [PubMed] [Google Scholar]
- 30.Haliburton JR, Kim SC, Clark IC, Sperling RA, Weitz DA, Abate AR. Biomicrofluidics. 2017;11:034111. doi: 10.1063/1.4984035. [DOI] [PMC free article] [PubMed] [Google Scholar]
- 31.Clausell-Tormos J, Lieber D, Baret J-C, Harrak El A, Miller OJ, Frenz L, Blouwolff J, Humphry KJ, Köster S, Duan H, Holtze C, Weitz DA, Griffiths AD, Merten CA. Chem. Biol. 2008;15:427–437. doi: 10.1016/j.chembiol.2008.04.004. [DOI] [PubMed] [Google Scholar]
- 32.Duffy DC, McDonald JC, Schueller OJ, Whitesides GM. Anal. Chem. 1998;70:4974–4984. doi: 10.1021/ac980656z. [DOI] [PubMed] [Google Scholar]
- 33.Sui G, Wang J, Lee C-C, Lu W, Lee SP, Leyton JV, Wu AM, Tseng H-R. Anal. Chem. 2006;78:5543–5551. doi: 10.1021/ac060605z. [DOI] [PubMed] [Google Scholar]
- 34.Anna SL, Bontoux N, Stone HA. Appl. Phys. Lett. 2003;82:364–366. [Google Scholar]
- 35.Frenz L, Blank K, Brouzes E, Griffiths AD. Lab Chip. 2009;9:1344–1348. doi: 10.1039/b816049j. [DOI] [PMC free article] [PubMed] [Google Scholar]
- 36.Zhang J, Chung T, Oldenburg K. J. Biomol. Screening. 1999;4:67–73. doi: 10.1177/108705719900400206. [DOI] [PubMed] [Google Scholar]
- 37.Storer AC, Cornish-Bowden A. Biochem. J. 1974;141:205–209. doi: 10.1042/bj1410205. [DOI] [PMC free article] [PubMed] [Google Scholar]
- 38.Shimizu Y, Inoue A, Tomari Y, Suzuki T, Yokogawa T, Nishikawa K, Ueda T. Nat. Biotechnol. 2001;19:751–755. doi: 10.1038/90802. [DOI] [PubMed] [Google Scholar]
- 39.Melin J, Quake SR. Annu. Rev. Biophys. Biomol. Struct. 2007;36:213–231. doi: 10.1146/annurev.biophys.36.040306.132646. [DOI] [PubMed] [Google Scholar]
- 40.Fuerstman MJ, Lai A, Thurlow ME, Shevkoplyas SS, Stone HA, Whitesides GM. Lab Chip. 2007;7:1479–1489. doi: 10.1039/b706549c. [DOI] [PubMed] [Google Scholar]
- 41.Ferguson CG, Bigman CS, Richardson RD, van Meeteren LA, Moolenaar WH, Prestwich GD. Org. Lett. 2006;8:2023–2026. doi: 10.1021/ol060414i. [DOI] [PMC free article] [PubMed] [Google Scholar]
- 42.Gierse J, Thorarensen A, Beltey K, Bradshaw-Pierce E, Cortes-Burgos L, Hall T, Johnston A, Murphy M, Nemirovskiy O, Ogawa S, Pegg L, Pelc M, Prinsen M, Schnute M, Wendling J, Wene S, Weinberg R, Wittwer A, Zweifel B, Masferrer J. J. Pharmacol. Exp. Ther. 2010;334:310–317. doi: 10.1124/jpet.110.165845. [DOI] [PubMed] [Google Scholar]
- 43.Perrakis A, Moolenaar WH. J. Lipid Res. 2014;55:1010–1018. doi: 10.1194/jlr.R046391. [DOI] [PMC free article] [PubMed] [Google Scholar]
- 44.Kupcho K, Somberg R, Bulleit B, Goueli SA. Anal. Biochem. 2003;317:210–217. doi: 10.1016/s0003-2697(03)00094-0. [DOI] [PubMed] [Google Scholar]
- 45.Tran DT, Cavett VJ, Dang VQ, Torres HL, Paegel BM. Proc. Natl. Acad. Sci. U. S. A. 2016;113:14686–14691. doi: 10.1073/pnas.1609925113. [DOI] [PMC free article] [PubMed] [Google Scholar]
- 46.Kupcho K, Hsiao K, Bulleit B, Goueli SA. J. Biomol. Screening. 2004;9:223–231. doi: 10.1177/1087057103262840. [DOI] [PubMed] [Google Scholar]
- 47.Beija M, Afonso CAM, Martinho JMG. Chem. Soc. Rev. 2009;38:2410–2433. doi: 10.1039/b901612k. [DOI] [PubMed] [Google Scholar]
- 48.Hassiepen U, Eidhoff U, Meder G, Bulber J-F, Hein A, Bodendorf U, Lorthiois E, Martoglio B. Anal. Biochem. 2007;371:201–207. doi: 10.1016/j.ab.2007.07.034. [DOI] [PubMed] [Google Scholar]
- 49.Courtois F, Olguin LF, Whyte G, Theberge AB, Huck WTS, Hollfelder F, Abell C. Anal. Chem. 2009;81:3008–3016. doi: 10.1021/ac802658n. [DOI] [PubMed] [Google Scholar]
- 50.Sandoz PA, Chung AJ, Weaver WM, Di Carlo D. Langmuir. 2014;30:6637–6643. doi: 10.1021/la5004484. [DOI] [PubMed] [Google Scholar]
- 51.Gruner P, Riechers B, Semin B, Lim J, Johnston A, Short K, Baret J-C. Nat. Commun. 2016;7:10392. doi: 10.1038/ncomms10392. [DOI] [PMC free article] [PubMed] [Google Scholar]
- 52.Woronoff G, Harrak El A, Mayot E, Schicke O, Miller OJ, Soumillion P, Griffiths AD, Ryckelynck M. Anal. Chem. 2011;83:2852–2857. doi: 10.1021/ac200373n. [DOI] [PubMed] [Google Scholar]
- 53.Najah M, Mayot E, Mahendra-Wijaya IP, Griffiths AD, Ladame S, Drevelle A. Anal. Chem. 2013;85:9807–9814. doi: 10.1021/ac4022709. [DOI] [PubMed] [Google Scholar]
- 54.Kintses B, Hein C, Mohamed MF, Fischlechner M, Courtois F, Lainé C, Hollfelder F. Chem. Biol. 2012;19:1001–1009. doi: 10.1016/j.chembiol.2012.06.009. [DOI] [PubMed] [Google Scholar]
- 55.Diehl F, Li M, He Y, Kinzler KW, Vogelstein B, Dressman D. Nat. Methods. 2006;3:551–559. doi: 10.1038/nmeth898. [DOI] [PubMed] [Google Scholar]
- 56.Groves M, Lane S, Douthwaite J, Lowne D, Rees DG, Edwards B, Jackson RH. J. Immunol. Methods. 2006;313:129–139. doi: 10.1016/j.jim.2006.04.002. [DOI] [PubMed] [Google Scholar]
- 57.Thom G, Cockroft AC, Buchanan AG, Candotti CJ, Cohen ES, Lowne D, Monk P, Shorrock-Hart CP, Jermutus L, Minter RR. Proc. Natl. Acad. Sci. U. S. A. 2006;103:7619–7624. doi: 10.1073/pnas.0602341103. [DOI] [PMC free article] [PubMed] [Google Scholar]
Associated Data
This section collects any data citations, data availability statements, or supplementary materials included in this article.


