Abstract
Objective
State-of-the-art algorithms that quantify nonlinear dynamics in physiologic waveforms are underutilized clinically due to their esoteric nature. We present a generalizable framework for classifying multiscalar waveform features, designed for patient-state tracking directly at the bedside.
Methods
An artificial neural network classifier was designed to evaluate multiscale waveform features against a fingerprint database of multifractal synthetic time series. The results are mapped into a physiologic state space for near realtime patient-state tracking.
Results
The framework was validated on cardiac beat-to-beat dynamics processed with the multiscale entropy algorithm, and assessed using PhysioNet databases. We then applied our algorithm to predict 28-day mortality for sepsis patients, and found it had greater prognostic accuracy than standard clinical severity scores.
Conclusion
We developed a novel framework to classify multiscale features of beat-to-beat dynamics, and performed an initial clinical validation to demonstrate that our approach generates a robust quantification of a patient’s state, compatible with real-time bedside implementations.
Significance
The framework generates meaningful and actionable patient-specific information, and could facilitate the dissemination of a new class of “always-on” diagnostic tools.
Index Terms: nonlinear variability dynamics, supervised learning, intensive care decision support, sepsis, state tracking
I. Introduction
A data revolution is currently underway in healthcare, leading to significant improvements in the acquisition and storage of medical data in electronic health records (EHRs), in turn enabling data-driven knowledge generation [1]. For instance, many hospitals are deploying early warning scores (EWS) for sepsis or rapid decompensation that are integrated into the EHR and generate a warning message if specific combinations of laboratory values or vital signs exceed certain threshold values [2]-[4]. Although EWS for different patient groups are proliferating rapidly with varying degrees of success [5], [6], the decision support logic is usually rule-based, i.e. the values of discrete data points are evaluated in relation to population-based thresholds with little to no regard for individual differences or temporal context. Therefore, EWS are prone to false positives, further adding to the growing issue of alarm fatigue [7]. In addition, most EWS were purposely built for the type of averaged vital sign data typically stored in EHRs and largely ignore high resolution data, even though the latter is especially well-suited for EWS applications by virtue of its high sampling rate and the wealth of information encoded in its features. Data storage capacity is no longer a significant constraint, so one of the last remaining hurdles to incentivize the use of raw physiologic waveforms or higher-level waveform features at the bedside, is the development of analytic algorithms that can transform these data into clinically meaningful and actionable information.
One such class of higher-level waveform features is the small but continuous changes in the timing between waveform-derived events (inter-feature intervals), e.g. beat-to-beat variability in a cardiac time series. The dynamics of these interval fluctuations can be attributed to the combined action of various feedback and feedforward autonomic neural control systems, humoral, and mechanical effects that influence the cardiac rhythm [8]-[10]. The physiologic controls act over multiple temporal and biological scales, and interact with random noise, resulting in the multiscalar deterministic and stochastic mechanisms that underlie the variability. Thus, heart rate variability (HRV) may represent an evolutionary optimization to maintain a homeodynamic state that allows the cardiovascular system to respond appropriately to internal and external stresses [11]. Consequently, physiologic time series are often nonstationary and nonlinear, exhibit both deterministic and stochastic properties, and are scale invariant, i.e. operate over multiple interdependent temporal scales [9], [12]. Therefore, no a priori assumption can be made about the distribution of the data. Nevertheless, vital sign data stored in EHRs are based on first (mean) and second-order (variance) statistical moments, which are most commonly associated with a Gaussian distribution and thus ignore the multiscalar long-term correlation structure of the overall time series. We theorize that a unified framework for feature extraction, processing, and visualization of multimodal, high-dimensional (waveform) data will facilitate moving beyond the status quo, and is required to introduce clinical decision support tools based on complexity dynamics at the bedside.
Because beat-to-beat variability effectively serves as a high level proxy for the underlying neural regulation, diagnostic and prognostic value has been attributed to many of its properties in both preclinical studies [13]—[15] and clinical trials [16]—[19]. Previously, we quantified the predictability of cardiac beat-to-beat dynamics using multiscale entropy (MSE) [20]. We pattern-matched the output of the MSE algorithm to colored noise with frequency-dependent scaling factors and tracked the progression of systemic inflammation in two preclinical models [13]. Now, we present the adaptation of this approach to human electrocardiogram (ECG) data by: 1) improving the original heuristic pattern-matching method to scale beyond the preclinical proof-of-concept study for univariate time series dynamics; 2) limiting sampling bias via a fingerprint database of synthetic time series; 3) developing a visual representation of a state space for patient tracking; and 4) validating our state tracking system in four distinct datasets. Specifically, the normal sinus rhythm, long-term atrial fibrillation, and congestive heart failure datasets, publicly accessible on PhysioNet [21], and a sepsis dataset generated in the Medical Intensive Care Unit (MICU) at University Hospitals Cleveland Medical Center (UHCMC).
This work presents an initial clinical validation of a framework for classification of multiscalar physiologic waveform features, developed to facilitate end-user interaction with advanced patient state tracking tools.
II. A Framework for Physiologically-Relevant Classification of Multiscale Variability Dynamics
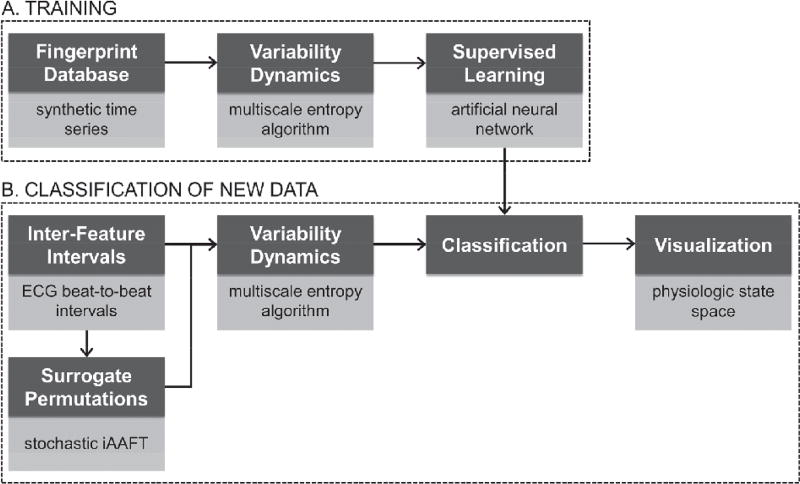
This section describes a generalizable framework for classification of multiscale variability dynamics, using a database of synthetic time series that emulates an appropriate physiologic range of ECG beat-to-beat dynamics (Fig. 1, A) [20].
Fig. 1. Schematic representation of the framework.
Dark grey boxes: proposed framework workflow. Light grey boxes: specific implementation of the current framework instance. A) Steps to be performed once to set up a new framework instance, see § II. B) Steps to be performed to process new (unknown) data, see § III. iAAFT, iterative Amplitude-Adjusted Fourier Transform.
A. Fingerprint Database (FPDB)
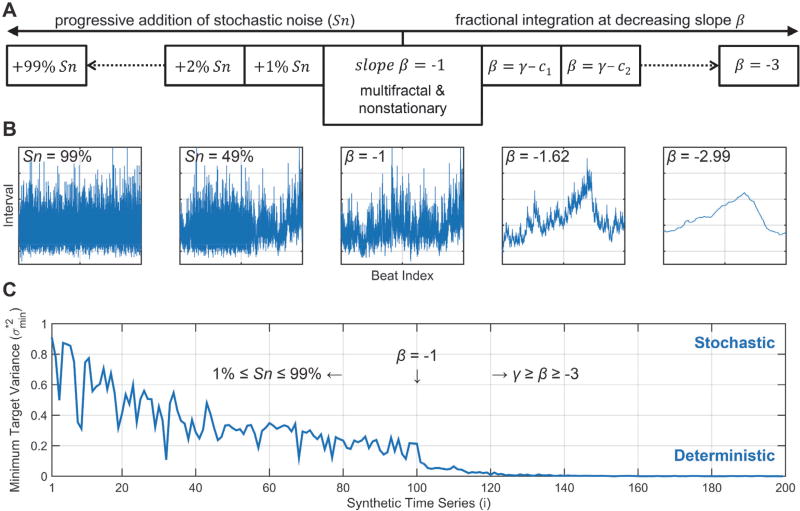
Nonstationary, multifractal synthetic time series were generated as training data for the artificial neural network (ANN, see § II. D.) using the p-model [22]–[24]. Synthetic time series that emulate cardiac beat-to-beat dynamics have multiple advantages over real-world data. First, it avoids sampling bias and is much faster to generate. Second, the primary goal of the FPDB is not to model the entire universe of possible cardiac beat-to-beat dynamics in health and disease, but rather to mimic the subset of pattern dynamics that can be quantified via the multiscale variability algorithm of interest, in this case regularity/predictability as quantified by MSE. As such, the synthetic time series provide a granular level of control over the dynamic structure of the data (Fig. 2, B). The FPDB was generated as follows: 50 multifractal time series were generated from a p-model with p-factor = 0.57, length L = 10,000, and fractionally integrated at slope β = −1 (Fig. 2, A [middle]). These parameters were chosen empirically as an idealistic representation of “normal” cardiac beat-to-beat dynamics, and will be referred to as f−ℚ, analogous to colored noise conventions [25] but assuming multiple non-integer fractal scaling exponents. Second, additional time series were generated from three f−ℚ time series that were used to seed progressive addition of stochastic noise (Sn) by random scrambling, in steps from 1% to 99% of the length of the time series (i.e. 3×99 = 297 time series), and were labeled f−ℚ + Sn (Fig. 2, A [left]). Three seed time series and their derivations were sufficient to cover the range of physiologically-relevant MSE profiles (see § II. C.) ranging from deterministic multifractal dynamics f−ℚ → f−ℚ + Sn) to almost full randomness (white noise, f0). Third, 297 time series were generated from additional p-model time series that were fractionally integrated at progressively more negative (“steeper”) slopes β, equidistant in the range γ = [−1.18, −3], and were labeled f−βℚ (Fig. 2, A [right]). The number of time series was chosen arbitrarily to match the f−ℚ + Sn category. Integration at steeper power spectral slopes is used to smooth out the long-term correlation structure in the time series. For β ≈ −1.62, a given value is strongly correlated with the preceding interval only, i.e. approximating a random walk-like process (brown noise, f−2). At even steeper slopes β, high frequency dynamics are progressively lost. In summary, the final FPDB contains 644 synthetic time series, each of length 10,000, ranging from almost pure white noise (f0) and f−ℚ + Sn (acute pathologic), to multifractal dynamics (f−ℚ, physiologic), and random walk-like dynamics (f−βℚ, chronic (pathophysiologic). The choice of the number of time series and their properties was guided by: 1) our prior work [13], 2) ensuring that the full range of physiologically-relevant MSE profiles was covered by the FPDB (see § II. C), and 3) appropriately representing the important class of f−ℚ time series, used as a proxy for “normal” dynamics, in the classifier training data (see § II. D.).
Fig. 2. Characterization of the FPDB: stochastic vs deterministic properties.
A) Schematic representation of the generation of the various types of synthetic time series mat make up the FDPB: Sn, stochastic noise; β, power spectral slope for fractional integration; γ, offset value for slope β; ci, constant to generate equidistantly spaced γ ≥ β ≥ −3. B) From left-to-right: representative tachograms for f−ℚ + Sn99% (approximating white noise, f0); f−ℚ + Sn49%; f−ℚ (multifractal and nonstationary seed time series); f−1.62ℚ (approximating brown noise, f−2); and f2.99ℚ (extreme smoothing, loss of high frequency dynamics). C) Minimum target variance ( ) for a representative set of 199 synthetic time series (i.e. encompassing the entire range from f−ℚ + 99% to f−ℚ and f−2.99ℚ determined by delay vector variance (DVV). The lower , the stronger the deterministic component; the higher , the stronger the stochastic component of the time series structure. The middle time series [i = 100] corresponds to a fractional integration slope β of −1. See text for details.
B. Deterministic, Stochastic, and Multifractal Properties
Delay vector variance (DVV) was used to verify the deterministic versus stochastic properties of the synthetic time series [26]. Time series with a strong deterministic component will have a low minimum target variance ( ). For f−ℚ → f−ℚ + sn time series (Fig. 2,C [i = 1 ← 100]), this is -predictably- reflected in a progressive loss of the deterministic component in favor of the stochastic (noise) component. For f−ℚ → f−βℚ time series (Fig. 2, C [i = 100 → 199]), this is reflected in a further decrease in , i.e. the time series structure becomes fully deterministic.
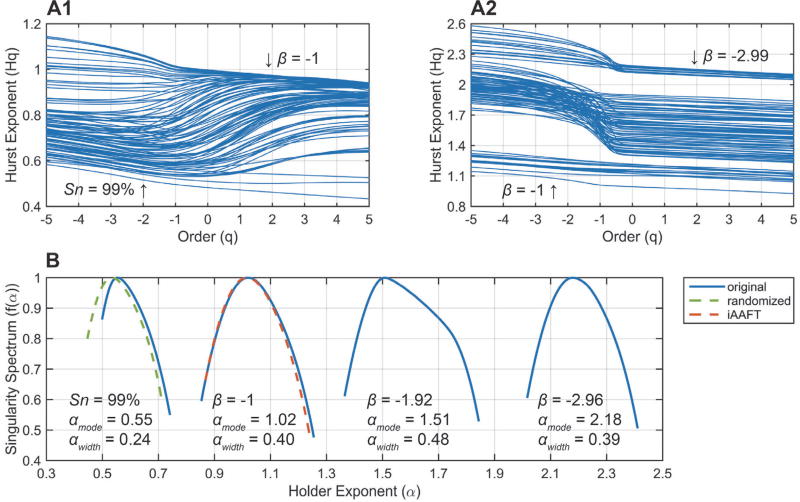
Additionally, the fractal properties of the time series were characterized via multifractal detrended fluctuation analysis (MFDFA) [27]. Cardiac beat-to-beat interval data (under most non-pathological conditions) are scale-invariant, indicative of a system controlled by mechanisms in dynamic equilibrium acting over multiple interdependent temporal scales [8], [9], [28]. Thus, the time series is characterized by one or more fractal dimensions and exhibits memory effects. MFDFA generates Hurst exponents (or fractal dimensions) Hq, weighted over different orders q, with low q-values emphasizing small fluctuations (singularities) and vice versa. In other words, MFDFA calculates a spectrum of fractal dimensions ranked in terms of the size of the fluctuations they describe, and is more accurate than monofractal techniques. For 0.5 < Hq ≤ 1, a time series exhibits long-range correlations (LRC) or memory, i.e. current intervals are correlated with both the distant and recent past as Hq → 1. For 0 < Hq < 0.5, the time series structure is anti-correlated, characterized by paired switching of short/long intervals, whereas Hq = 0.5 is the special case of random (white noise, f0) data. For Hq > 1, short-range correlations (SRC) become more pronounced, in extremis approaching a highly-smoothed random walk. The f−ℚ time series in the FPDB (Fig. 3, A1) have Hurst exponents centered around 1. The f−ℚ + Sn time series have a dual profile, with decreased LRC at low q-order (small fluctuations), and relatively well-preserved LRC at higher q-orders (large fluctuations) until Sn ~ 90%. For Sn > 90%, the Hurst exponents center around 0.5 (f0). For the f−βℚ time series (Fig. 3, A2), three distinct groups can be observed: 1) power spectral slopes in the range −1 > β ≥ −1.4 exhibit stable LRC across q; 2) for −1.4 ≥ β ≥ −2.6, both small and large fluctuations are short-range correlated (random walk-like dynamics), but the structure of small fluctuations is noticeably smoother (high Hq at low q); and 3) for β < −2.6 the range of Hq narrows again as the removal of the high frequency component becomes even more pronounced. The multifractal singularity spectra for several representative time series are shown in Fig. 3, B. The spectra depict the occurrence of different local Hurst exponents in the signal. The width of the spectrum (αwidth) is an estimator of the strength of the multifractal dynamics, while the mode of the distribution (αmode) represents the most prevalent fractal dimension. For f−ℚ → f−ℚ+ Sn, αwidth narrows from 0.4 to 0.24, while αmode shifts from 1.02 to 0.55, again illustrating the loss of multifractal dynamics and LRC. For f−ℚ → f−βℚ, αmode shifts to the right, while the multifractal dynamics are largely preserved. Importantly, two different types of multifractal behavior can be observed in a time series: 1) that due to LRC of both small and large fluctuations; and 2) that due to a probability density distribution with broad support [27]. The latter would be unwanted for the FPDB and its presence can be tested for as follows: the f−ℚ time series (Fig. 2, A [middle]) were scrambled randomly (Fig. 3, B [green-dashed line]) or shuffled using iterative Amplitude-Adjusted Fourier Transform (iAAFT; Fig. 3, B [red-dashed line]) [29]. The latter preserves the amplitude distribution and the (auto)correlation structure of the original data, while destroying any nonlinear structure. Because the randomized surrogate shifts to αmode~ 0–5, while the iAAFT surrogate is essentially identical to the original f−ℚ time series, the multifractal dynamics can be explained fully by LRC (type 1).
Fig. 3. Characterization of the FPDB: multifractal properties.
A) Hurst exponent Hq (fractal dimension) as a function of order q (singularity weighting factor) for a representative set of 199 synthetic time series (i.e. encompassing the entire range from f−ℚ + 99% to f−ℚ and f−2.99ℚ). The annotations correspond to Fig. 2, B. B) Multifractal singularity spectra for representative synthetic time series: αwidth is an estimator of multifractal strength, αmode denotes the most prevalent fractal dimension. The surrogate permutations (randomized (green) and iAAFT (red)) correspond to the original time series (β = −1). See text for details.
C. MSE Conversion
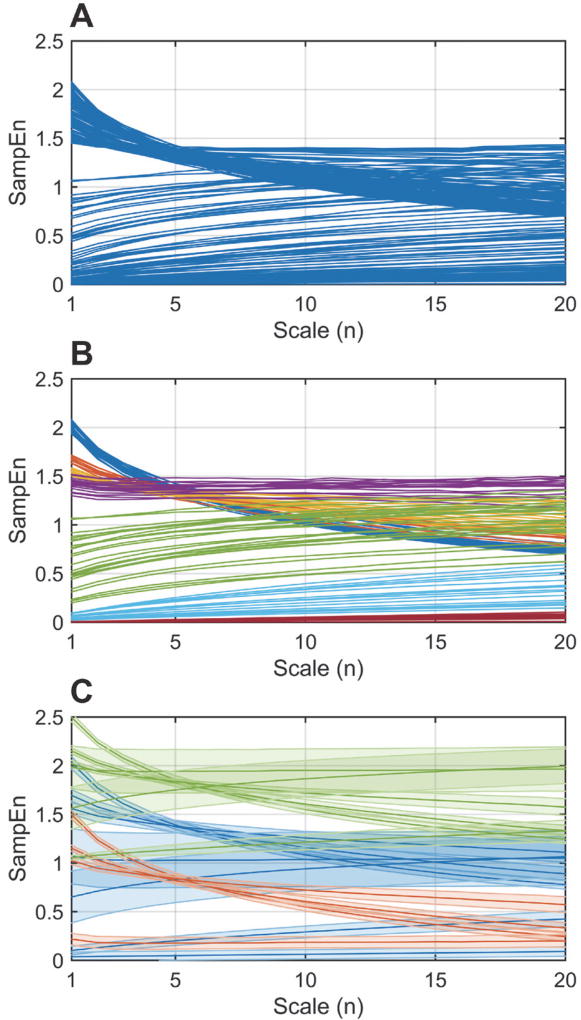
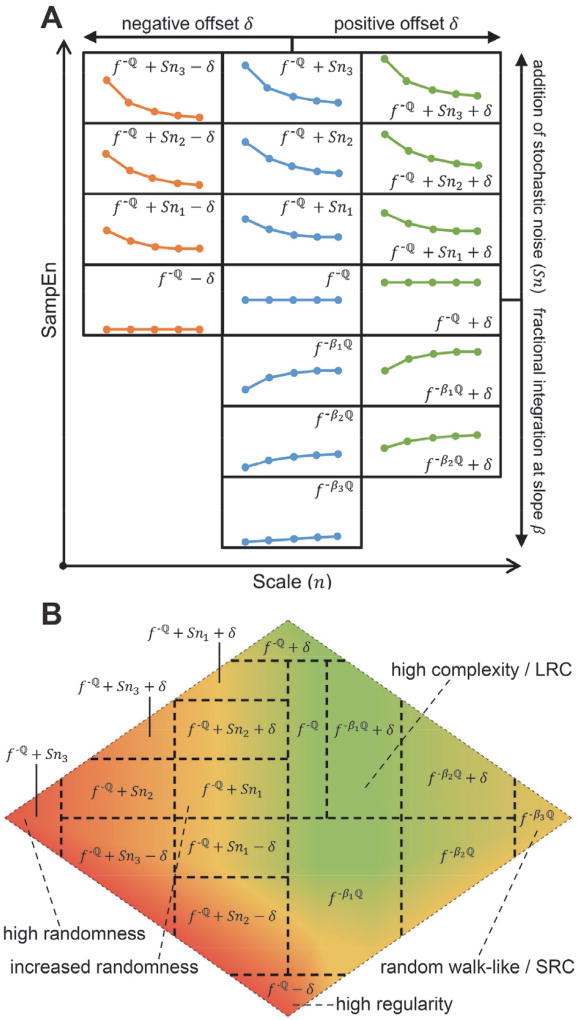
The MSE algorithm was used to convert the FPDB into the corresponding MSE profiles (Fig. 1, A). Sample Entropy (SampEn) quantifies the regularity/predictability of a time series. MSE does so over multiple coarse-grained scales, thereby distinguishing between stochastic noise and complex determinism (or complexity dynamics). One adjustment was made to the original algorithm [20]: all combinations of overlapping coarse-grained time series were processed as opposed to only non-overlapping cases (see § III. D.). The default parameters were used: pattern length m = 2, standard deviation modified by similarity criterion r = 0.15, scales n = [1, 20]. We previously showed the importance of the SampEn value as a function of scale n [13], i.e. specific changes in the shape of the MSE profile were found to be important determinants of the progression of systemic inflammation and associated organ damage, which could be quantified by matching the MSE profile to three prototypical colored noise time series (white f0, pink f−1, and brown f−2 noise). We refer the interested reader to Fig. 2 and 4 in [13] for more details. This heuristic approach worked well for highly controlled animal experiments but would not have been amenable to generalization and more confounded clinical data. First, the initial set of MSE profiles was pruned to delineate 7 discrete classes (Fig. 4, A → B) to facilitate the classifier training (see § II. D.). As the assignment of the class labels is a manual process, the dataset will be made available upon request. To account for a wider SampEn range in vivo, the initial 7 classes were shifted up (Fig. 4, C [green]), or down (Fig. 4, C [red]) by a constant value S. In terms of the time series dynamics, the shifts correspond to decreased (positive 8) and increased (negative S) regularity, respectively. Newly generated classes that fell outside the relevant physiologic range due to the shifts were removed, resulting in a total of 17 classes, schematically shown in Fig. 5, A. These classes are the theoretical equivalent of the empirically-determined classes in [13], and reflect clinically-pertinent state changes as we demonstrate in Section IV. The shifting procedure increased the total number of MSE profiles used for training to 792.
Fig. 4. MSE conversion of the FPDB.
A) Set of 199 representative synthetic time series converted to their corresponding MSE profiles (see Fig. 3. A). B) Pruning of the MSE profiles to delineate 7 distinct classes. C) Positive (green) and negative (red) shifts of the original (blue) MSE profiles to better match the physiologic range, generating a total of 17 classes. See text for details.
Fig. 5. Schematic representation of the classification scheme and the state space.
A) Each class is labeled according to the primary determinant of its structure; (middle column) f−ℚ corresponds to β = −1; f−ℚ + Snx corresponds to increasing amounts (x = 1, 2, 3) of stochastic noise added to the seed time series f−ℚ; fβℚ corresponds to decreasing (x = 1, 2, 3) fractional integration slopes β. The left and right columns represent negative and positive offsets δ, respectively. The drawings are approximations of the MSE profile shape covered by that specific class. B) Visual representation of the state space, overlaid with the 17 classes. The pseudo-coloring delineates multi-class sectors within the state space that share dynamical properties (as quantified by MSE) to improve readability. LRC, long-range correlations; SRC, short-range correlations. See text for details.
D. Training the Pattern Recognizer
A two-layer feedforward artificial neural network (ANN) with 20 inputs (corresponding to the MSE scales n), 17 hidden (sigmoid activation) and 17 output (softmax activation) neurons was trained on 594 MSE profiles (75% of dataset), and then validated and tested on 119 (15%) and 79 (10%) MSE profiles, respectively, using the scaled conjugate gradient backpropagation algorithm (standard settings in the Matlab R2015a Neural Network Pattern Recognition Toolbox (nprtool)). The cross entropy of the ANN is 0.0089. Although the classification performance of the ANN is very high for MSE profiles based on synthetic time series, it is more ambiguous for real-world data. This is by design, as it enables smooth class transitions in the state space (see § III. D.).
E. State Space Mapping and Visualization
The 17 discrete class outputs of the ANN were assembled into a 2-dimensional state space (Fig. 5, B), with physiologically-related classes neighboring each other. As mentioned earlier, the ANN will usually classify new data as a combination of 2 or more classes, which is the intended behavior in order to generate a more accurate representation of the dynamical fluctuations as a function of time. Every class has a geometric center in the state space, and new data are mapped along the Euclidean distance between the identified class centers, weighted over the relative contribution of each class. The state space was pseudo-colored to improve readability: 1) the green sector encompasses high complexity dynamics with stable LRC, corresponding to “healthy” dynamics (not necessarily healthy individuals); 2) the red sector represents either extreme randomness (white noise, f0) to the far left, and extreme regularity (C) at the bottom of the state space, indicative of (acute) pathophysiologic changes in the underlying dynamics; 3) the yellow sector on the right edge encompasses f−βℚ type dynamics at low β values, i.e. random walk-like dynamics characterized by SRC, indicative of more chronic (patho)physiologic changes in the underlying dynamics; and 4) the yellow sector bordering the green and red sectors denotes transitional f−ℚ + Sn dynamics. Additionally, temporal (in)stability of the signal as it moves through the state space is another important determinant of the physiologic state of a patient.
III. Classification of New Data
This section describes how new data can be classified using the instance of the framework set up in § II, applied to four distinct physiologic waveform databases (Fig. 1, B).
A. Ethics Statement
All experiments were approved by the Institutional Review Board of UHCMC, and selected study data were collected and managed using REDCap electronic data capture tools, hosted at UHCMC [30].
B. Databases and Study Participants
ECG waveforms from 3 PhysioNet databases were used: the MIT-BIH Normal Sinus Rhythm database (n = 18, 128 Hz) [21], the Long-Term Atrial Fibrillation database [21], [31] (n = 15, 128 Hz), and the BIDMC Congestive Heart Failure database [21], [32] (n = 15, 250 Hz). In addition, a database of continuously recorded physiologic waveforms, including ECG (125 Hz), was generated for sepsis patients recruited in the MICU at UHCMC via the Philips Healthcare Research Data Export environment. Selected laboratory values and clinical annotations were managed in a REDCap database. Inclusion criteria were: 1) ≥ 18 years old, 2) admitted to the MICU with a diagnosis of sepsis or septic shock. Exclusion criteria were: overly moribund and not expected to survive for more than 24 h. Patients were enrolled between 03/2015 and 01/2016. For the present study, 15 septic patients with vasopressor dependency were selected from the database.
C. Data Preprocessing
The datasets (n = 63) collectively span 131 days of ECG recordings. To minimize data curation time, a custom beat-detector was built and optimized for feature extraction from long non-stationary time series. Artifacts and ectopic beats were labeled automatically, and visually evaluated by an operator. Short artifacts were automatically corrected by examining the surrounding normal beats, followed by replacing the artifact by one or more “expected” beats. Artifacts too long to be corrected were taken into account in an overall quality control penalty, and excluded from the analysis.
D. Tracking a Patient’s State
A beat-to-beat interval time series was processed in epochs of 60 min, shifting forward in time by 10 min. This is important from a technical point-of-view: 1) it ensures sufficient data for robust algorithm operations, while maintaining adequate temporal resolution; and 2) the MSE similarity criterion r is based on the standard deviation of the input data, which can lead to inaccurate estimations for longer input time series due to non-stationarity of the data. Additionally, from a physiologic point-of-view, it ensures that leading edge beat-to-beat dynamics are evaluated in the context of the appropriate memory lag. For every epoch, 3 Stochastic iAAFT (SiAAFT) surrogate permutations were generated. SiAAFT is more accurate than standard iAAFT in matching the power spectrum of the input data, at the expense of increased computation time [29], [33]. Next, every epoch was processed with the MSE algorithm. As mentioned earlier, the original MSE algorithm was adjusted to process all combinations of overlapping coarse-grained time series, to buffer against the influence of outliers in the beat-to-beat interval time series. Additionally, for real-world data, both pattern length m = 2 and m = 3 were computed, to extend the quantification of regularity to longer pattern matches (refer to [20] for details). Finally, original data epochs and their corresponding surrogates were classified by the ANN and mapped in the state space as described earlier. The state space locations for multiple pattern lengths and surrogates were averaged. In addition to the state space plots (Fig. 5, B), sectors (corresponding to the pseudo-colors in the state space) were defined to generate a representation of sector transitions as a function of time. The 3 dimensions of the state space (2D grid and time) are projected onto a linear axis, representing sector transitions, as a function of time (ID axis and time). Although the information content of the latter is reduced compared to the state space plots, it improves the time-based interpretation of the data by focusing only on major sector transitions. Furthermore, a moving average filter was applied to the sector transition plots, to reduce the importance of very short-lived (1 epoch) state transitions.
E. Analysis
Statistics were performed with GraphPad Prism 6.07 (GraphPad Software, La Jolla, CA, USA) at a 95% confidence level. Two-way ANOVA was used to compare group aggregated data. Unpaired two-tailed t-tests were used to compare clinical severity scores between “Sepsis – Survived” and “Sepsis – Deceased” groups. All summary data are reported as means ± SD. Code for custom analyses was written in Matlab R2015a (The Math Works Inc., Natick, MA, USA).
IV. Application to Clinical Data
A. Normal Sinus Rhythm (NSR) Database
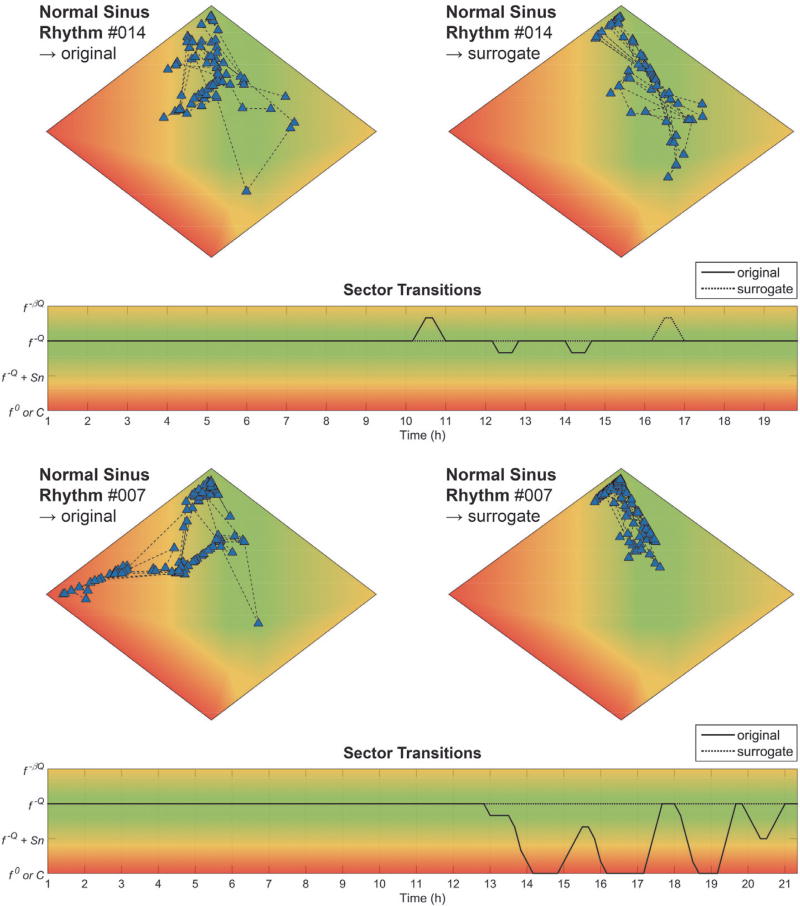
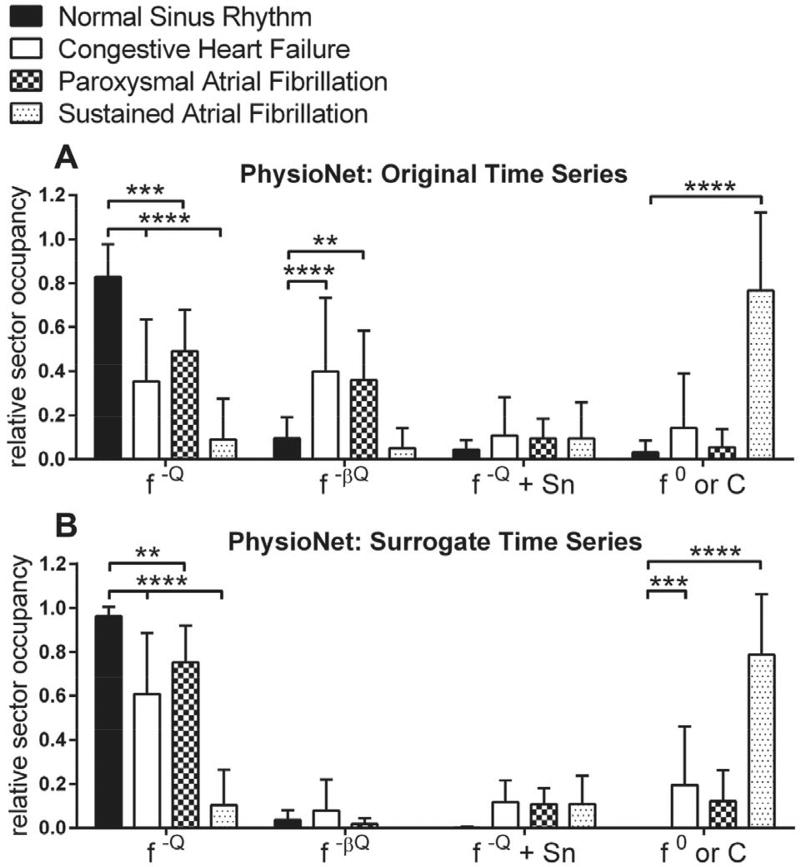
Long-term NSR ECG recordings (n = 18) were used to validate the baseline monitoring capabilities of the state tracker. Fig. 6 shows the state space plots for original [left] and surrogate [right] data for two representative NSR subjects. For dataset #014 [top], almost all original data epochs are located in the f−ℚ sector (green), with the exception of a low number of epochs on the edge of the f−ℚ + Sn sector (yellow). For the surrogate data, all epochs are located in the f−ℚ sector (green). The corresponding sector transition plot shows a complex signal, indicative of LRC, for the total length of the recording. The static state space plots shown here obfuscate temporal information; an animated version of the state space plot for subject NSR014 can be found in the Supplemental Information. For dataset #007 [bottom], the original signal is distributed similarly across the state space but includes transitions to the f−ℚ + Sn (yellow) and f0 sectors (red). Again, these transitions were removed by surrogate shuffling, and the ECG revealed that these transitions occurred during periods of marked respiratory sinus arrhythmia (RSA) and long sinus pauses [34], [35], which can occur during non-rapid eye movement sleep. Thus, benign bradyarrhythmias can introduce beat intervals that act as a source of “physiologic noise”, although one that could be highly regulated via cardiorespiratory coupling if examined with the appropriate techniques [36]. Indeed, SiAAFT surrogate shuffling removed the effect of the arrhythmias from the pattern dynamics, pointing to a more nonlinearly organized structure. Similar types of bradyarrhythmias were observed in 4/18 of the datasets; surrogate shuffling removed their influence in all cases (Fig. 8). Aggregate data, expressed as total time spent in each sector, are shown in Fig. 8.
Fig. 6. Two representative examples from the NSR database.
State space plots for original [top-left] and surrogate [top-right] data, and sector transition plot [bottom] for: 1) dataset #014, NSR; and 2) dataset #007, NSR with marked bradyarrhythmias. See text for details.
Fig. 8. Relative sector occupancy for the NSR, CHF, and AF databases.
A–B) Averaged original (A) and surrogate (B) data for the databases, grouped per sector: f−ℚ, f−βℚ, f−ℚ + Sn, and f0/C. Stars denote comparisons of the CHF, PAF, and SAF groups to the NSR control group. ****, p ≤ 0.0001; ***, p ≤ 0.001; **, p ≤ 0.01; *, p ≤ 0.05.
B. Congestive Heart Failure (CHF) Database
Beat-to-beat dynamics of CHF patients are known to exhibit reduced complexity [20] and multifractal dynamics [28]. Two representative examples from the CHF database (n = 15) are shown in Suppl. Fig. 1. Dataset #013 [top] fluctuates between the edge of the f−ℚ and f−ℚ + Sn sectors (green/yellow), for both the original and surrogate data. For the latter, the transitions are reduced in duration and severity, except for the larger f−ℚ → f0 transition (green → red) around 12.5 h. Thus, in the case of CHF, the periodic loss of complexity, sometimes approaching randomly distributed data, is also reflected in the linear structure of the data, in contrast to the bradyarrhythmias observed in the NSR database. Dataset #004 [bottom], on the other hand, has a markedly different profile. The original data is characterized by a random walk-like structure (yellow). However, the surrogate shuffling seems to unmask sector transitions that are more similar to dataset #013. Aggregate data, expressed as total time spent in each sector, are shown in Fig. 8.
C. Atrial Fibrillation (AF) Database
The AF database (n = 15) contains 8 subjects with paroxysmal (PAF) and 7 subjects with sustained AF (SAF). A representative PAF and SAF example are shown in Suppl. Fig. 2. For dataset #001 (PAF) [top], both the original and surrogate data are located in the f−ℚ (green) sector with little to no sector transitions, followed by a very marked transition to f−ℚ + Sn (yellow) and f0 (red) at the onset of the AF episode. SAF (dataset #012, [bottom]), on the other hand, is characterized by a very narrow clustering of the epochs in the f−ℚ + Sn → f0 (yellow → red) sectors for both the original and surrogate data. Aggregate data for the PAF and SAF groups, expressed as total time spent in each sector, are shown in Fig. 8.
D. Sepsis Database
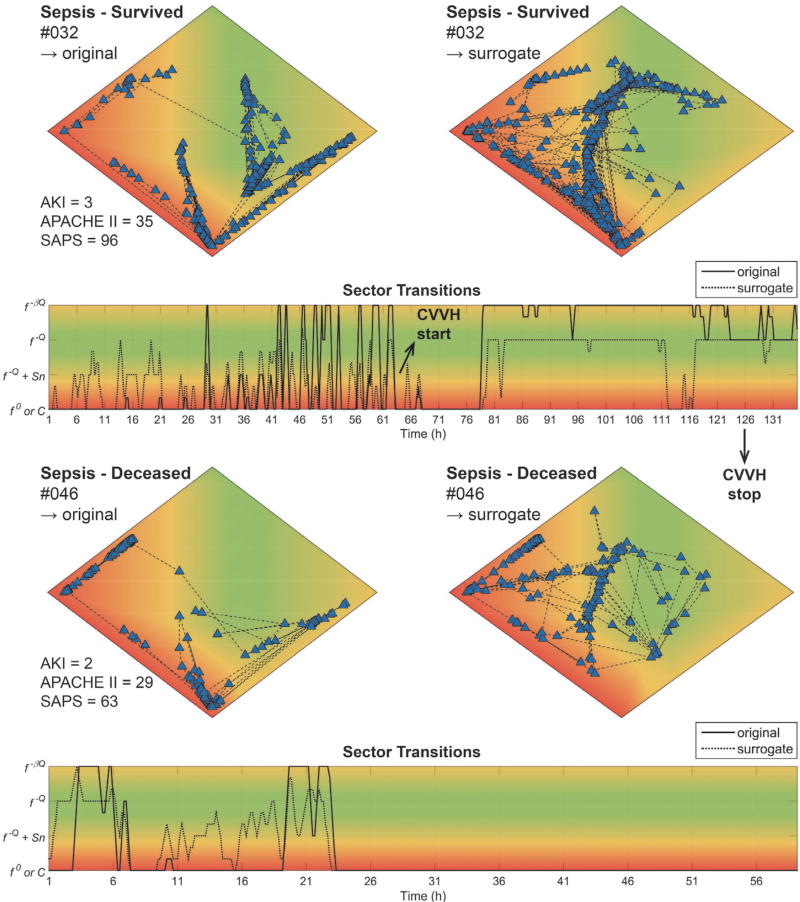
ECG waveforms from patients admitted to the MICU (Table I) and diagnosed with sepsis with vasopressor dependency were used to evaluate the state tracker on patients with complex disease etiologies and no primary cardiac pathology. Patients were retrospectively divided in “Survived” and “Deceased” groups, based on 28-day mortality. Two representative examples are shown in Fig. 7 (an animated version of the state space plot for subject MICU032 can be found in Supplemental Information). One of the survivors (dataset #032, [top]) was admitted with sepsis, respiratory and kidney failure, and required mechanical ventilation. During the first 64 h of admission, original and surrogate epochs were located mostly in sector C (extremely regular patterns, red), indicative of severe disturbances in regulatory pathways converging on the heart. This was followed by an abrupt C → f0 transition when continuous veno-venous hemofiltration (CVVH) was started in response to the kidney failure. About 15 h after the start of CVVH, both the original and surrogate data started to normalize to the f−βℚ (yellow) and f−ℚ (green) sectors, respectively. Dataset #046 (“Deceased” group, [bottom]) is from a patient admitted with urosepsis who required mechanical ventilation. For the first 24 h of admittance, the original and surrogate data were located in sector C (red), with occasional transitions to f−βℚ (yellow), followed by an abrupt transition to the f0 (red) sector with no further changes until discharge to palliative care.
TABLE I.
Patient Characteristics
| Patient | Gender | Age | APACHE | SAPS | AKI | Deceased |
|---|---|---|---|---|---|---|
| 005 | M | 88 | 21 | 67 | 3 | Y |
| 009 | M | 66 | 22 | 48 | 0 | Y |
| 015 | M | 58 | 19 | 68 | 2 | N |
| 019 | M | 75 | 21 | 62 | 1 | Y |
| 021 | M | 45 | 17 | 46 | 0 | N |
| 025 | F | 57 | 22 | 51 | 1 | N |
| 027 | M | 43 | 18 | 37 | 3 | N |
| 031 | F | 67 | 24 | 75 | 0 | Y |
| 032 | F | 53 | 35 | 96 | 3 | N |
| 037 | F | 68 | 26 | 56 | 3 | Y |
| 038 | M | 23 | 8 | 58 | 0 | N |
| 040 | M | 64 | 13 | 46 | 2 | N |
| 042 | M | 71 | 20 | 64 | 0 | Y |
| 045 | F | 60 | 26 | 75 | 0 | Y |
| 046 | M | 70 | 29 | 63 | 3 | Y |
APACHE II, Acute Physiology and Chronic Health Evaluation; SAPS II, Simplified Acute Physiology Score; AKI, Acute Kidney Injury.
Fig. 7. Two representative examples from the Sepsis database.
State space plots for original [top-left] and surrogate [top-right] data, and sector transition plot [bottom] for: 1) dataset #032 (“Sepsis – Survived” group); and 2) dataset #046 (“Sepsis – Deceased” group). AKI, Acute Kidney Injury; APACHE II, Acute Physiology and Chronic Health Evaluation; SAPS II, Simplified Acute Physiology Score; CVVH, continuous venovenous hemofiltration. See text for details.
E. Statistical Comparison
Aggregate data for the PhysioNet databases are shown in Fig. 8. Averaging the data reduces the information content severely and destroys all temporal context. We did this solely to provide summary statistics for validation purposes. Compared to the NSR control group, CHF was significantly decreased for the f−ℚ (green) sector (p < 0.0001), and increased for the f−βℚ (yellow) sector (p < 0.0001); PAF was significantly decreased for the f−ℚ (green) sector (p = 0.0002), and increased for the f−βℚ (yellow) sector (p = 0.006); and SAF was significantly decreased for the f−ℚ (green) sector (p < 0.0001), and increased for the C//° (red) sector (p < 0.0001). The aggregate effect of SiAAFT shuffling appears to be removal of random walk-like dynamics (f−βℚ → f−ℚ) (yellow → green) for the CHF (p = 0.0016) and PAF (p < 0.0001) databases, emphasizing that surrogate shuffling can unmask physiologically-relevant linear patterns.
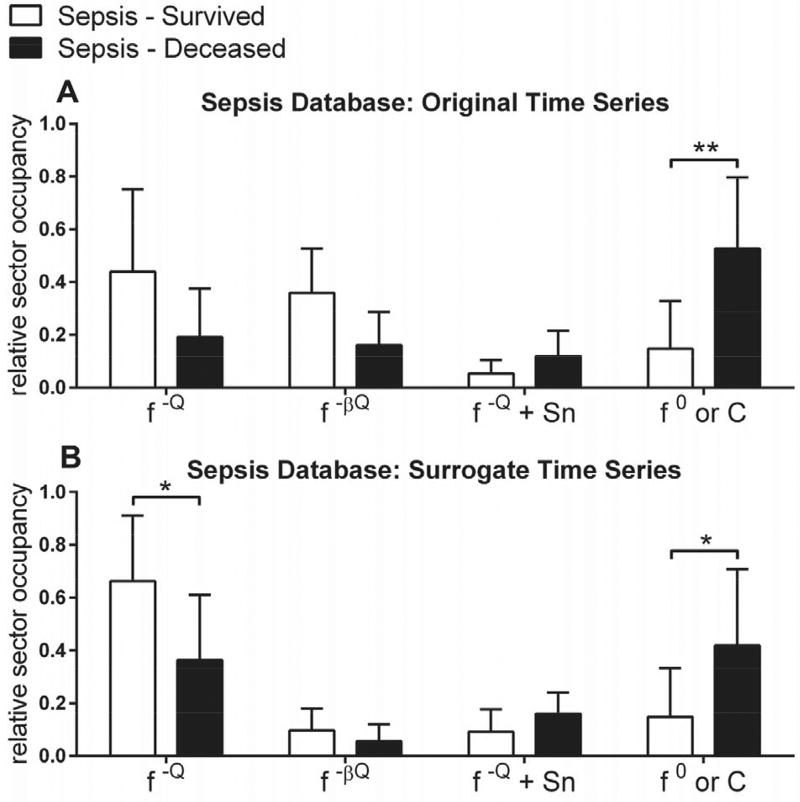
Aggregate data from the Sepsis Database is shown in Fig. 9 and Table II. Total time spent in the C/f0 (red) sector and, to a lesser extent, the f−ℚ (green) sector was significantly correlated with outcome (28-day mortality). In contrast, clinical severity scores were non-significant between the “Sepsis – Survived” and “Sepsis – Deceased” outcome groups.
Fig. 9. Relative sector occupancy for the Sepsis Database.
A–B) Averaged original (A) and surrogate (B) data for the “Sepsis - Survived” and “Sepsis - Deceased” groups, grouped per sector: f−ℚ, f−βℚ, f−ℚ + Sn, and f0/C. **, p ≤0.01; *, p ≤ 0.05.
TABLE II.
Group Comparison Sepsis Database
| SURVIVED* | DECEASED* | COMPARISON | |
|---|---|---|---|
| APACHE | 18.86 ±8.44 | 23.63 ±3.16 | p = 0.160 |
| SAPS | 57.43 ± 19.66 | 63.75 ± 9.07 | p = 0.428 |
| AKI | 1.57 ± 1.27 | 1.25 ± 1.49 | p = 0.663 |
| f−ℚ - original | 0.439 ±0.314 | 0.192 ±0.184 | p = 0.0602 |
| f−ℚ - surrogate | 0.663 ± 0.250 | 0.365 ± 0.246 | p = 0.0112 |
| f0/C - original | 0.148± 0.181 | 0.527 ±0.269 | p = 0.0013 |
| f0/C surrogate | 0.148 ±0.185 | 0.419 ±0.290 | p = 0.0249 |
APACHE II, Acute Physiology and Chronic Health Evaluation; SAPS II, Simplified Acute Physiology Score; AKI, Acute Kidney Injury.
Results are mean ± SD.
V. Discussion
We presented an initial clinical validation of a novel framework for the classification of multiscalar features extracted from physiologic waveform time series data. Our framework was designed to facilitate rapid prototyping and bedside deployment of state-of-the-art feature extraction algorithms that have diagnostic or prognostic value, but whose clinical implementation is hampered by their esoteric nature. Specifically, and depending on the application: 1) the synthetic fingerprints can be reconfigured to embed other time series dynamics (e.g. respiratory instead of cardiac); 2) the feature extraction algorithm can be changed (e.g. (MF)DFA, DVV, other implementations of MSE); 3) changes in #1 and #2 require the ANN to be retrained; however, the time-consuming step of the acquisition of high-quality training data is bypassed by the FPDB; 4) the physiologic state space -and variations thereof- can be read without extensive training, as the “intelligence” is handled by the classification process.
The method was validated using MSE analysis of cardiac beat-to-beat intervals because of prior preclinical work that identified specific features of MSE profiles as important determinants of progression and outcome of systemic inflammation [13]. These preliminary observations were translated to human data in the present study. ANN-mediated matching of new data to multiscalar complexity fingerprints reduced the dimensionality of a single time point from 20 dimensions (scales n) to 2 (state-space plot) or 1 (sector-transition plot) spatial dimension(s) with minimal loss of relevant clinical information. Moreover, the pattern matching approach highlights clinically pertinent “features of features”, by interpreting SampEn as a function of all scales n, across time. Certain aspects of this workflow are computationally expensive (e.g. the surrogate permutations). However, the time lag (10 min in the current implementation) would allow server-side processing. Additionally, because many of the analysis steps are easily parallelizable, scaling is trivial.
The resulting MSE-based framework instance was validated on various physiologic waveform databases. The NSR database established a baseline for normal cardiac dynamics. Importantly, 22% of the subjects exhibited bradyarrhythmi-as, which was detected as increased randomness in the beat-to-beat intervals (Fig. 6 [bottom]). The surrogate permutations effectively removed the influence of the arrhythmias, highlighting the importance of teasing apart the linear and nonlinear organization of the data via surrogate methods. The CHF and AF databases were used to corroborate prior results with the same or similar data [20], namely that beat-to-beat dynamics of CHF patients exhibit random walk-like dynamics, and those of AF patients approach full randomness (white noise). Interestingly, if random walk-like dynamics were present in the original signal, they were “unmasked” by surrogate shuffling, sometimes revealing f−ℚ + Sn and f0 sector transitions (Fig. 8 and Suppl. Fig. 1). Additionally, for PAF subjects, the sector transitions tracked accurately with the AF episodes (Suppl. Fig. 2 [top]). These results are not surprising, considering the underlying primary cardiac pathology, but nevertheless validate the robustness of the method, and emphasize the importance of also examining the linear structure of the data via surrogate permutations.
The Sepsis Database is characterized by much more complex disease etiologies that are not primarily cardiac in origin. In this case, cardiac beat-to-beat interval dynamics act as a proxy for examining the underlying network physiology and organ coupling [10], [37]. Subtle changes in the dynamics can be attributed to network disturbances and the detection of tipping points; for instance, the transition of a controlled inflammatory response to uncontrolled systemic inflammation. The initial validation shows that our approach is already more powerful than widely used clinical severity scores (e.g. SAPS and APACHE) in categorizing severity and outcome. Because the survival rate of sepsis and septic shock is highly correlated with early diagnosis and start of appropriate treatment [4], [38], robust real-time decision support tools are imperative for the continued management of sepsis and multiple organ failure. As an anecdotal example, in dataset #032 (Fig. 7 [top]), a very marked improvement in complexity dynamics in both the original and surrogate signals was detected 15 h after starting CVVH, and 74 h before CVVH was terminated. Because urine output and other biomarkers of kidney failure are masked during CVVH, critical care physicians have little information available to guide the decision to continue or terminate the treatment. Precedent exists for using variability-based biomarkers for decision support, e.g. in mechanical ventilation weaning trials [17]. We wish to highlight the following limitations of our study: 1) we used various sources of ECG data to perform an initial clinical validation, but the total number of subjects was limited (n = 63); 2) so far, the presented framework instance was only tested on cardiac interbeat interval data, processed by the MSE algorithm; and 3) potential end-users did not yet evaluate the visualization tools. Future studies will focus on evaluating the performance of framework instances for specific monitoring applications directly at the bedside.
VI. Conclusion
In summary, the classification framework presented in this paper can generate meaningful and actionable patient-specific information that is based on relevant properties from physiologic time series, in near real-time. We demonstrated this for an MSE-based instance of the framework, using three PhysioNet databases and a Sepsis Database from the MICU at UHCMC. The latter showed that our approach yielded a sensitive, albeit non-specific, continuously updating physiologic biomarker that reflected improvements in or exacerbations of a patient’s overall state. Furthermore, we presented two data visualization approaches that represent the information in an end-user friendly format, and could facilitate bedside adoption.
Future work will evaluate the performance of the current framework instance on a much larger and more diverse ICU population, in addition to evaluating other framework instances (e.g. designed to process other types of physiologic time series data, such as photoplethysmography, arterial blood pressure, or respiratory signals), multimodal variants (e.g. based on cardiorespiratory coupling), and implementation of other pertinent feature extraction algorithms or data sources (e.g. based on ambulatory monitoring systems). In addition, decision-support tools that are both sensitive and specific can be developed by fusing information generated by these or similar “always-on” EWS with diagnostic data from the patient’s EHR profile.
Supplementary Material
Acknowledgments
The authors thank Julie Heald and Mary Andrews for assistance with patient enrollment in the MICU at UHCMC.
This work was supported in part by the NIH National Center for Advancing Translational Sciences (NCATS), Clinical Translational Science Collaborative (CTSC) Pilot Award CON501510-V101, and the VA Research Service Merit Review Award I01BX000873. B. Vandendriessche was supported by a Belgian-American Educational Foundation (B.A.E.F.) postdoctoral fellowship.
Contributor Information
Benjamin Vandendriessche, Department of Electrical Engineering and Computer Science, and the Division of Pulmonary, Critical Care, and Sleep Medicine, Case Western Reserve University (CWRU), Cleveland 44106, USA.
Mustafa Abas, Division of Pulmonary, Critical Care, and Sleep Medicine, CWRU.
Thomas E. Dick, Division of Pulmonary, Critical Care, and Sleep Medicine, CWRU
Kenneth A. Loparo, Department of Electrical Engineering and Computer Science, CWRU.
Frank J. Jacono, Division of Pulmonary, Critical Care, and Sleep Medicine, CWRU, and the Louis Stokes Department of Veteran Affairs Medical Center, Cleveland.
References
- 1.Ghassemi M, Celi LA, Stone DJ. State of the art review: the data revolution in critical care. Crit. Care. 2015;19(1):801. doi: 10.1186/s13054-015-0801-4. [DOI] [PMC free article] [PubMed] [Google Scholar]
- 2.Henry KE, Hager DN, Pronovost J, Saria S. A targeted real-time early warning score (TREWScore) for septic shock. Sci. Transl. Med. 2015;7(299):299ral22. doi: 10.1126/scitranslmed.aab3719. [DOI] [PubMed] [Google Scholar]
- 3.Vorwerk C, Loryman B, Coats TJ, Stephenson JA, Gray LD, Reddy G, Florence L, Butler N. Prediction of mortality in adult emergency department patients with sepsis. Emerg. Med. J. 2009 Apr;26(4):254–8. doi: 10.1136/emj.2007.053298. [DOI] [PubMed] [Google Scholar]
- 4.Singer M, Deutschman CS, Seymour CW, Shankar-Hari M, Annane D, Bauer M, Bellomo R, Bernard GR, Chiche J-D, Coopersmith CM, Hotchkiss RS, Levy MM, Marshall JC, Martin GS, Opal SM, Rubenfeld GD, van der Poll T, Vincent J-L, Angus DC. The Third International Consensus Definitions for Sepsis and Septic Shock (Sepsis-3) JAMA. 2016 Feb;315(8):801. doi: 10.1001/jama.2016.0287. [DOI] [PMC free article] [PubMed] [Google Scholar]
- 5.Williams TA, Tohira H, Finn J, Perkins GD, Ho KM. The ability of early warning scores (EWS) to detect critical illness in the prehospital setting: A systematic review. Resuscitation. 2016;102:35–43. doi: 10.1016/j.resuscitation.2016.02.011. [DOI] [PubMed] [Google Scholar]
- 6.Kaukonen K-M, Bailey M, Pilcher D, Cooper DJ, Bellomo R. Systemic Inflammatory Response Syndrome Criteria in Defining Severe Sepsis. N. Engl. J. Med. 2015 Mar;372(17):150317020036009. doi: 10.1056/NEJMoa1415236. [DOI] [PubMed] [Google Scholar]
- 7.Paine CW, V Goel V, Ely E, Stave CD, Stemler S, Zander M, Bonafide CP. Systematic Review of Physiologic Monitor Alarm Characteristics and Pragmatic Interventions to Reduce Alarm Frequency. J. Hosp. Med. 2016 Feb;11(2):136–44. doi: 10.1002/jhm.2520. [DOI] [PMC free article] [PubMed] [Google Scholar]
- 8.Goldberger AL, Amaral LNa, Hausdorff JM, Ivanov C, Peng C-K, Stanley HE. Fractal dynamics in physiology: alterations with disease and aging. Proc. Natl. Acad. Sci. U. S. A. 2002 Feb;99(Suppl 1):2466–72. doi: 10.1073/pnas.012579499. [DOI] [PMC free article] [PubMed] [Google Scholar]
- 9.Meyer M, Stiedl O. Fractal rigidity by enhanced sympamovagal antagonism in heartbeat interval dynamics elicited by central application of corticotropin-releasing factor in mice. J. Math. Biol. 2006 Jun;52(6):830–74. doi: 10.1007/s00285-006-0375-5. [DOI] [PubMed] [Google Scholar]
- 10.Godin PJ, Buchman TG. Uncoupling of biological oscillators: a complementary hypothesis concerning the pathogenesis of multiple organ dysfunction syndrome. Crit. Care Med. 1996 Jul;24(7):1107–16. doi: 10.1097/00003246-199607000-00008. [DOI] [PubMed] [Google Scholar]
- 11.Lloyd D, a Aon M, Cortassa S. Why homeodynamics, not homeostasis? ScientificWorldJournal. 2001 May;1:133–145. doi: 10.1100/tsw.2001.20. [DOI] [PMC free article] [PubMed] [Google Scholar]
- 12.Meyer M, Stiedl O. Self-affine fractal variability of human heartbeat interval dynamics in health and disease. Eur. J. Appl. Physiol. 2003 Oct;90(3–4):305–16. doi: 10.1007/s00421-003-0915-2. [DOI] [PubMed] [Google Scholar]
- 13.Vandendriessche B, Peperstraete H, Rogge E, Cauwels P, Hoste E, Stiedl O, Brouckaert P, Cauwels A. A multiscale entropy-based tool for scoring severity of systemic inflammation. Crit. Care Med. 2014 Aug;42(8):e560–9. doi: 10.1097/CCM.0000000000000299. [DOI] [PubMed] [Google Scholar]
- 14.Fairchild KD, Saucerman JJ, Raynor LL, Sivak J, Xiao Y, Lake DE, Moorman JR. Endotoxin depresses heart rate variability in mice: cytokine and steroid effects. Am. J. Physiol. 2009 Oct;297(4):R1019–27. doi: 10.1152/ajpregu.00132.2009. [DOI] [PMC free article] [PubMed] [Google Scholar]
- 15.Beckers F, Verheyden B, Ramaekers D, Swynghedauw B, Aubert AE. Effects of autonomic blockade on non-linear cardiovascular variability indices in rats. Clin. Exp. Pharmacol. Physiol. 2006;33(5–6):431–9. doi: 10.1111/j.1440-1681.2006.04384.x. [DOI] [PubMed] [Google Scholar]
- 16.Ahmad S, Ramsay T, Huebsch L, Flanagan S, McDiarmid S, Batkin I, Mclntyre L, Sundaresan SR, Maziak DE, Shamji FM, Hebert P, Fergusson D, Tinmouth A, Seely AJE. Continuous multi-parameter heart rate variability analysis heralds onset of sepsis in adults. PLoS One. 2009 Jan;4(8):6642. doi: 10.1371/journal.pone.0006642. [DOI] [PMC free article] [PubMed] [Google Scholar]
- 17.Seely AJE, Bravi A, Herry C, Green G, Longtin A, Ramsay T, Fergusson D, Mclntyre L, Kubelik D, Maziak DE, Ferguson N, Brown SM, Mehta S, Martin C, Rubenfeld G, Jacono FJ, Clifford G, Fazekas A, Marshall J. Do heart and respiratory rate variability improve prediction of extubation outcomes in critically ill patients? Crit. Care. 2014 Jan;18(2):R65. doi: 10.1186/cc13822. [DOI] [PMC free article] [PubMed] [Google Scholar]
- 18.Richman JS, Moorman JR. Physiological time-series analysis using approximate entropy and sample entropy. J. Physiol. 2000 Jun;278(6):H2039–49. doi: 10.1152/ajpheart.2000.278.6.H2039. [DOI] [PubMed] [Google Scholar]
- 19.Sullivan BA, McClure C, Hicks J, Lake DE, Moorman JR, Fairchild KD. Early Heart Rate Characteristics Predict Death and Morbidities in Preterm Infants. J. Pediatr. 2016 Apr; doi: 10.1016/j.jpeds.2016.03.042. [DOI] [PMC free article] [PubMed] [Google Scholar]
- 20.Costa M, Goldberger AL, Peng CK. Multiscale entropy analysis of biological signals. Phys. Rev. E. 2005 Feb;71(2 Pt 1):21906. doi: 10.1103/PhysRevE.71.021906. [DOI] [PubMed] [Google Scholar]
- 21.Goldberger AL, Amaral LAN, Glass L, Hausdorff JM, Ivanov C, Mark RG, Mietus JE, Moody GB, Peng C-KK, Stanley HE. PhysioBank, Physio Toolkit, and PhysioNet: Components of a New Research Resource for Complex Physiologic Signals. Circulation. 2000 Jun;101(23):e215–e220. doi: 10.1161/01.cir.101.23.e215. [DOI] [PubMed] [Google Scholar]
- 22.Meneveau C, Sreenivasan KR. Simple multifractal cascade model for fully developed turbulence. Phys. Rev. Lett. 1987 Sep;59(13):1424–1427. doi: 10.1103/PhysRevLett.59.1424. [DOI] [PubMed] [Google Scholar]
- 23.Venema V. P-model multifractal time series. 2006 [Google Scholar]
- 24.Davis A, Marshak A, Cahalan R, Wiscombe W. The Landsat Scale Break in Stratocumulus as a Three-Dim ensional Radiative Transfer Effect: Implications for Cloud Remote Sensing. J. Atmos. Sci. 1997;54(2):241–260. [Google Scholar]
- 25.Timmer J, Koenig M. On generating power law noise. Astron. Astrophys. 1995;300:707. [Google Scholar]
- 26.Gautama T, Mandic DP, Van Hulle MM. The delay vector variance method for detecting determinism and nonlinearity in time series. Phys. D Nonlinear Phenom. 2004;190(3–4):167–176. [Google Scholar]
- 27.Kantelhardt JW, a Zschiegner S, Koscielny-bunde E, Bunde A, Havlin S, Stanley HE. Multifractal Detrended Fluctuation Analysis of Nonstationary Time Series. Phys. A Stat. Mech. its Appl. 2002;316(1–4):87–114. [Google Scholar]
- 28.Ivanov PC, Amaral La, Goldberger La, Havlin S, Rosenblum MG, Struzik ZR, Stanley HE. Multifractality in human heartbeat dynamics. Nature. 1999 Jun;399(6735):461–5. doi: 10.1038/20924. [DOI] [PubMed] [Google Scholar]
- 29.Schreiber T, Schmitz A. Surrogate time series. Phys. D Nonlinear Phenom. 2000 Aug;142(3–4):346–382. [Google Scholar]
- 30.Harris PA, Taylor R, Thielke R, Payne J, Gonzalez N, Conde JG. Research electronic data capture (REDCap)—a metadata-driven methodology and workflow process for providing translational research informatics support. J. Biomed. Inform. 2009 Apr;42(2):377–81. doi: 10.1016/j.jbi.2008.08.010. [DOI] [PMC free article] [PubMed] [Google Scholar]
- 31.Petrutiu S, V Sahakian A, Swiryn S. Abrupt changes in fibrillatory wave characteristics at the termination of paroxysmal atrial fibrillation in humans. Europace. 2007 Jul;9(7):466–70. doi: 10.1093/europace/eum096. [DOI] [PubMed] [Google Scholar]
- 32.Bairn DS, Colucci WS, Monrad ES, Smith HS, Wright RF, Lanoue A, Gauthier DF, Ransil BJ, Grossman W, Braunwald E. Survival of patients with severe congestive heart failure treated with oral milrinone. J. Am. Coll. Cardiol. 1986 Mar;7(3):661–70. doi: 10.1016/s0735-1097(86)80478-8. [DOI] [PubMed] [Google Scholar]
- 33.Venema V, Ament F, Simmer C. A Stochastic Iterative Amplitude Adjusted Fourier Transform algorithm with improved accuracy. Nonlinear Process. Geophys. 2006;13(3):321–328. [Google Scholar]
- 34.Brodsky M, Wu D, Denes P, Kanakis C, Rosen KM. Arrhythmias documented by 24 hour continuous electrocardiographic monitoring in 50 male medical students without apparent heart disease. AM. J. Cardiol. 1977;39(3):390–395. doi: 10.1016/s0002-9149(77)80094-5. [DOI] [PubMed] [Google Scholar]
- 35.Yasuma F, Hayano J-I. Respiratory sinus arrhythmia: why does the heartbeat synchronize with respiratory rhythm? Chest. 2004 Feb;125(2):683–90. doi: 10.1378/chest.125.2.683. [DOI] [PubMed] [Google Scholar]
- 36.Gilad O, Swenne CA, Davrath LR, Akselrod S. Phase-averaged characterization of respiratory sinus arrhythmia pattern. Am. J. Physiol. Heart Circ. Physiol. 2005 Feb;288(2):H504–10. doi: 10.1152/ajpheart.00366.2004. [DOI] [PubMed] [Google Scholar]
- 37.Bashan A, Bartsch RP, Kantelhardt JW, Havlin S, Ivanov PC. Network physiology reveals relations between network topology and physiological function. Nat. Commun. 2012;3:702. doi: 10.1038/ncomms1705. [DOI] [PMC free article] [PubMed] [Google Scholar]
- 38.Kumar A, Roberts D, Wood KE, Light B, Parrillo JE, Sharma S, Suppes R, Feinstein D, Zanotti S, Taiberg L, Gurka D, Kumar A, Cheang M. Duration of hypotension before initiation of effective antimicrobial therapy is the critical determinant of survival in human septic shock. Crit. Care Med. 2006 Jun;34(6):1589–96. doi: 10.1097/01.CCM.0000217961.75225.E9. [DOI] [PubMed] [Google Scholar]
Associated Data
This section collects any data citations, data availability statements, or supplementary materials included in this article.


