Abstract
Genome alignments provide a powerful basis to transfer gene annotations from a well-annotated reference genome to many other aligned genomes. The completeness of these annotations crucially depends on the sensitivity of the underlying genome alignment. Here, we investigated the impact of the genome alignment parameters and found that parameters with a higher sensitivity allow the detection of thousands of novel alignments between orthologous exons that have been missed before. In particular, comparisons between species separated by an evolutionary distance of >0.75 substitutions per neutral site, like human and other non-placental vertebrates, benefit from increased sensitivity. To systematically test if increased sensitivity improves comparative gene annotations, we built a multiple alignment of 144 vertebrate genomes and used this alignment to map human genes to the other 143 vertebrates with CESAR. We found that higher alignment sensitivity substantially improves the completeness of comparative gene annotations by adding on average 2382 and 7440 novel exons and 117 and 317 novel genes for mammalian and non-mammalian species, respectively. Our results suggest a more sensitive alignment strategy that should generally be used for genome alignments between distantly-related species. Our 144-vertebrate genome alignment and the comparative gene annotations (https://bds.mpi-cbg.de/hillerlab/144VertebrateAlignment_CESAR/) are a valuable resource for comparative genomics.
INTRODUCTION
Annotating coding genes is an essential step in the annotation of newly sequenced genomes (1). A number of computational gene prediction approaches have been developed for this task (2–8), and different methods and sources of evidence are often integrated in gene annotation pipelines (9–12). One group of these approaches makes use of the conservation of coding genes between species. These homology-based approaches are accurate and have been instrumental in obtaining high-quality gene annotations (13,14).
One type of homology-based approaches utilizes the alignment of entire genomes to transfer gene annotations from one well-annotated (reference) genome to other aligned (query) genomes (15,16). Genome alignments provide a powerful basis to obtain such comparative gene annotations, since coding exons are typically well conserved between species (17,18) and the aligning genomic context is helpful to distinguish orthologous genes from paralogs and pseudogenes that are located in a different genomic context.
To utilize genome alignments for the accurate mapping of exons of coding genes from a reference to many query genomes, we have previously developed a method called CESAR (Coding Exon-Structure Aware Realigner) (19). CESAR extracts the sequence of a query species that aligns to a coding exon of the reference species and ‘realigns’ this exon with the aim to find an alignment with an intact reading frame and consensus splice sites if the exon is conserved. To realign this sequence, CESAR uses a Hidden-Markov-Model that captures the reading frame and splice sites of the reference exon. This ‘re-alignment’ step enables CESAR to effectively avoid spurious frameshift mutations in truly conserved genes and to detect 91% of the cases where splice sites have been shifted in the query species. CESAR annotates the intact exons in the query genome, using the detected splice site coordinates as the exon coordinates. Of all human exons that align with an intact reading frame and consensus splice sites to mouse, 99% match real exons independently annotated in the mouse genome (19), demonstrating the high accuracy of this approach.
However, the completeness of CESAR’s comparative gene annotation crucially depends on the underlying genome alignment between the reference and query genome(s), since it extracts the exonic sequence from the genome alignment and then realigns it. Consequently, exons or genes that do not align in the genome alignment will be missed in the comparative gene annotation. Therefore, it would be desirable to apply CESAR to genome alignments having a high sensitivity in detecting exon alignments.
Here, we show that existing genome alignments have insufficient sensitivity in aligning exons across larger evolutionary distances. Using comparisons between human and nine other vertebrate genomes, we show that more sensitive alignment parameters detect thousands of novel alignments between orthologous exons that would be missed otherwise. To systematically improve comparative gene annotation, we applied these sensitive parameters to align human to 143 vertebrates; the resulting multiple alignment is the largest vertebrate genome alignment available to date. Applying CESAR to map human genes to all 143 aligned vertebrates, we detected numerous additional exons and genes that did not align before. Our study shows that genome comparisons between distantly-related species benefit from highly sensitive alignment parameters and presents a strategy to test alignment parameter sensitivity for species in other clades. The 144-vertebrate alignment and our improved comparative gene annotations are an important resource for comparative genomics.
MATERIALS AND METHODS
Pairwise genome alignments
We used the human hg38 genome assembly as the reference genome. To compute pairwise genome alignments, we used lastz (20) version 1.03.54 and the chain/net pipeline (21) with default parameters (chainMinScore 1000, chainLinearGap loose). To align placental mammals, we used the lastz alignment parameters K = 2400, L = 3000, Y = 9400, H = 2000 and the lastz default scoring matrix, corresponding to parameter set 2 in Table 1. To align non-placental mammals, we used K = 2400, L = 3000, Y = 3400, H = 2000 and the HoxD55 scoring matrix. In addition, we used highly sensitive local alignments with lastz parameters K = 1500, L = 2500 and W = 5 to find co-linear alignments in the un-aligning regions that are flanked by local alignments (gaps in the chains) (22). This corresponds to parameter set 3 in Table 1. We filtered all local alignments for a minimum alignment quality by keeping only those alignments where at least one ≥30 bp region has ≥60% sequence identity and ≥1.8 bits entropy as described in (22).
Table 1. The table lists the three different alignment parameter sets that were evaluated in this study.
| Parameter set | Placental mammals | Non-placental vertebrates |
|---|---|---|
| 1 | K = 3000, L = 3000 | K = 2200, L = 6000 |
| 2 | K = 2400, L = 3000 | K = 2400, L = 3000 |
| 3 | K = 2400, L = 3000 | K = 2400, L = 3000 |
| and a subsequent round of highly sensitive alignments with K = 1500, L = 2500 |
Alignments between exons of orthologous genes
To compare the different alignment parameters, we counted the number of human coding exons for which an alignment to an exon of the orthologous gene was detected. To this end, we first downloaded the coordinates of Ensembl coding genes from the UCSC genome browser ‘ensGene’ table for human (hg38 assembly, Ensembl version 78), horse (equCab2, Ensembl version 86), cow (bosTau4, Ensembl version 63), mouse (mm10, Ensembl version 75), opossum (monDom5, Ensembl version 86), platypus (ornAna1, Ensembl version 86), chicken (galGal4, Ensembl version 85), lizard (anoCar2, Ensembl version 86), frog (xenTro3, Ensembl version 86) and zebrafish (danRer10, Ensembl version 86). We used liftOver to map these genes from bosTau4 to bosTau8, ornAna1 to ornAna2 and xenTro3 to xenTro7 that we used for the genome alignments. One-to-one orthologous genes were downloaded from Ensembl Biomart (23,24). Then, we counted the number of exons overlapping an aligning block of a chain that aligns the human exon to the ortholog in the query species.
Building a multiple genome alignment of 144 vertebrates
Before building a multiple alignment from the pairwise alignment nets of different species, low-scoring alignment nets that are unlikely to represent real homologies need to be removed. To this end, the netFilter program (21) removes nets that do not satisfy the specified score and size criteria, however netFilter also removes all nested nets. This is problematic if the nested nets would satisfy the specified criteria. To keep such nets, we implemented and applied a non-nested filtering procedure that considers and filters each net individually and adjusts the net level in case a parent net is removed but not a net nested within.
We applied the UCSC ‘syntenic net’ criteria (netFilter –syn thresholds: minTopScore = 300 000, minSynScore = 200 000, minSynSize = 20 000, minSynAli = 10000, maxFar = 200 000) to all placental mammal alignments that have well-assembled genomes (Supplementary Table S1). For five placental mammalian genomes (dolphin, sperm whale, seal, pangolin, megabat) with a scaffold N50 value of less than 1 Mb, we kept all nets that score >100 000 and kept all nested nets that align to the same locus (inversions or local translocations; net type ‘inv’ or ‘syn’ according to netClass) if they score >5000. For all other species, we kept all nets that score >10 000 and kept all nested nets of type ‘inv’ or ‘syn’ if they score >3000 (Supplementary Table S1). Note that these thresholds are more stringent than the thresholds used for the UCSC 100-way alignment. The filtered pairwise alignment nets are the input to MULTIZ (25) to build a multiple alignment. We used phyloFit (26) and 4-fold degenerated codon positions as a proxy for neutral sites in the genome to estimate neutral branch lengths in the phylogenetic tree.
Applying CESAR to the 144-vertebrate alignment
We used the longest transcript of the UCSC ‘knownGene’ annotation table, excluding all genes, which have a frameshift in the hg38 genome (polymorphisms or programmed ribosomal frameshifting). For each of the remaining 195 279 coding exons in 19 846 genes, we applied CESAR to realign the exonic sequence. Then, we extracted all exons that have an intact open reading frame and two consensus splice sites (internal exons) or a consensus donor/acceptor splice site (terminal exons). The genomic coordinates of the bases in the query genome that align to the exon boundaries were used to annotate the exon in the query genome. All intact exons of a gene were grouped into a gene model.
RESULTS
To investigate the effect of alignment parameter sensitivity on detecting alignments between exons of orthologous genes, we used lastz (20) and evaluated three different alignment parameter sets (Table 1) that differ in the score threshold of ungapped high-scoring segment pairs (parameter K) and the score threshold of the local alignments after gapped extension (parameter L). Parameter set 1 was used in (27) to obtain the human (hg38 assembly) 100-way alignment and contains the least sensitive parameters. This parameter set uses K = 3000 and L = 3000 to align human to other placental mammals and K = 2200 and L = 6000 to align human to non-placental vertebrates. The second parameter set should increase alignment sensitivity by using K = 2400 and L = 3000 for all comparisons. The third parameter set uses the same parameters as set 2 to detect alignments between the two genomes and then applies a subsequent round of highly sensitive alignments with K = 1500 and L = 2500 to find additional alignments between the already-detected aligning blocks. This subsequent step exploits the fact that conserved genes maintain a co-linear exon order and is therefore able to detect additional exon alignments. While it would be computationally infeasible to apply these highly sensitive parameters in a genome-wide search, it is feasible to apply them only to the un-aligning regions that are flanked by aligning blocks. Thus, of the three parameter sets, set 3 has the highest sensitivity (Table 1). We used these three parameter sets to compute alignments between human (reference) and the following nine query genomes: horse, cow, mouse, opossum, platypus, chicken, lizard, frog and zebrafish. These query species cover different clades within the vertebrates and their evolutionary distance to human ranges from 0.32 to 2.2 substitutions per neutral site.
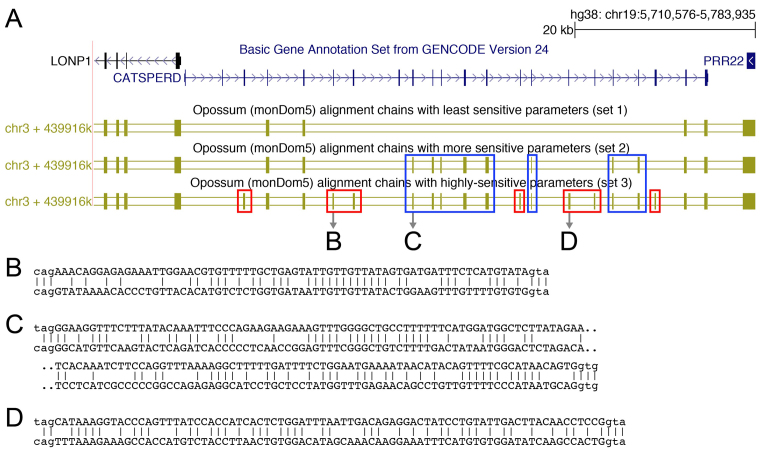
Inspecting the alignment produced with the three different parameter sets revealed many genes for which the sensitivity of parameter set 1 was clearly insufficient to align human exons to their orthologous locus. Figure 1 shows an example were several exon alignments between human and opossum (∼0.75 substitutions per neutral site) can only be found with the more sensitive parameter sets 2 or 3.
Figure 1.
Alignment parameter sensitivity is crucial to align exons to their orthologous genomic locus. (A) UCSC genome browser screenshot showing the CATSPERD (cation channel sperm associated auxiliary subunit delta) gene locus in the human genome and genome alignments (chains of co-linear local alignments) to opossum computed with three different parameter sets (see text). Several exons of this gene only align to the opossum ortholog with more sensitive parameters (blue boxes) or using a subsequent round of highly sensitive alignments in addition (red boxes). (B–D) Three examples of local alignments covering exons of CATSPERD. Exonic bases are in upper case, intronic bases are in lower case.
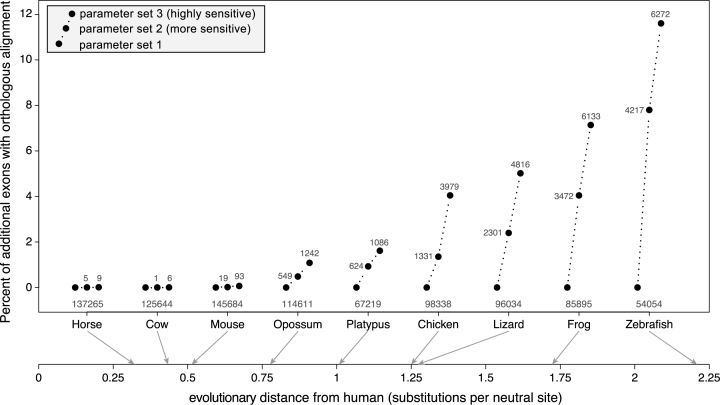
Next, we systematically evaluated if increased sensitivity results in additional exon alignments. To assure that only truly orthologous alignments were considered, we compared the number of human coding exons that align to an exon of the 1:1 orthologous gene. We found that increased alignment sensitivity results in a few additional exon alignments for the three placental mammals with an evolutionary distance of ≤0.5 substitutions per neutral site (Figure 2). However, for the other six species pairs with larger evolutionary distances (>0.75 substitutions per neutral site), more sensitive parameters consistently detected numerous additional exon alignments. For example, while 98 338 human exons align to the chicken ortholog using parameter set 1, highly sensitive parameters detected 3979 additional exon alignments, which is an increase of 4% (Figure 2). For zebrafish, a total of 6272 additional exon alignments can be detected using highly sensitive parameters, which is an increase of 11.6% relative to the 54 054 exons that align using parameter set 1. Figure 2 also shows that the percent of additional exon alignments continuously increases with the evolutionary distance. We conclude that highly sensitive alignment parameters allow the detection of thousands of additional exon alignments if the evolutionary distance between the aligned species exceeds 0.75 substitutions per neutral site.
Figure 2.
Sensitive alignment parameters can uncover thousands of new alignments between exons of orthologous genes. The figure compares the number of exons that align between orthologous genes for nine species at various evolutionary distances to human (axis at the bottom). Three alignment parameter sets were tested that differ in their sensitivity. The Y-axis shows the percent increase relative to the number of aligning exons with parameter set 1. The absolute number of aligning exons with parameter set 1 is given below the black dots, the absolute increase obtained with parameter set 2 and 3 is given alongside or above the black dots.
These results suggest that highly sensitive parameters have the potential to substantially improve the usage of genome alignments to transfer gene annotations with CESAR by detecting exons and even entire genes that would be missed otherwise. To systematically test this, we built a genome alignment of 144 vertebrates using the human hg38 genome assembly as the reference. In this alignment, we included all species that are contained in the UCSC 100-way alignment (27,28), added 44 new species and updated the mouse lemur and platypus assemblies. We used parameter set 2 to align placental mammals and applied highly sensitive alignment parameters (set 3) to align non-placental vertebrates. Since primates share a high degree of genome similarity, we downloaded the primate alignments used for the human-primate multiple alignment (UCSC 20-way) from the UCSC genome browser (29). We computed the remaining 127 pairwise genome alignments and applied the chainCleaner method (30) to improve the specificity. The total runtime of these 127 genome alignments sums to ∼95,000 CPU hours (Supplementary Table S2). The final 144-vertebrate alignment, obtained by MULTIZ (25), includes 73 non-human mammals, 31 birds and 23 teleost fish (Supplementary Table S1), making it the largest vertebrate genome alignment available to date.
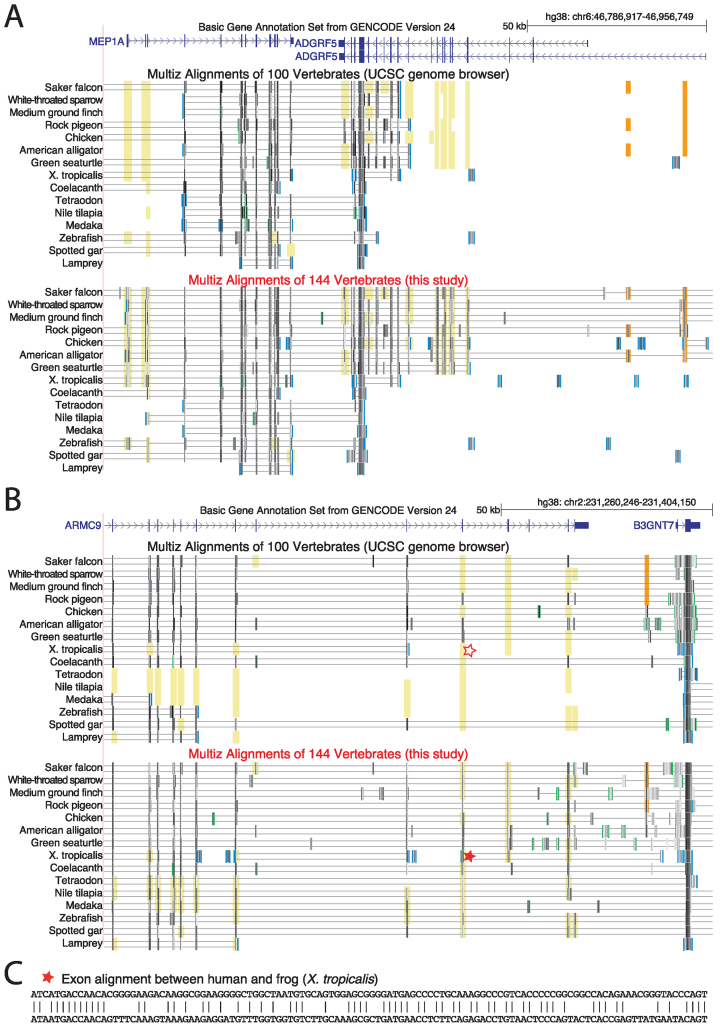
As expected, a comparison of our 144-vertebrate alignment to the UCSC 100-way alignment shows that increased alignment sensitivity results in the detection of additional alignments. Two examples where our alignment adds additional alignments of exons as well as non-exonic conserved regions are shown in Figure 3.
Figure 3.
Highly sensitive alignment parameters detect additional alignments between human and non-mammalian vertebrates. UCSC genome browser screenshots compare the UCSC 100-way alignment (27) with our 144-vertebrate alignment for two genomic loci (A and B). Aligning sequence is visualized by black and grey boxes. The darker the color of the box, the higher is the sequence similarity in the alignment. Double horizontal lines indicate sequence that does not align between the reference (human) and the query species. Yellow background indicates regions where exon alignments can only be detected with sensitive parameters in our 144-way alignment. Orange background indicates additional non-exonic conserved regions. For visualization, only a subset of all 70 non-mammalian vertebrates is shown. (C) Representative additional exon alignment between human and frog that was only detected with highly-sensitive parameters (marked with a star in B).
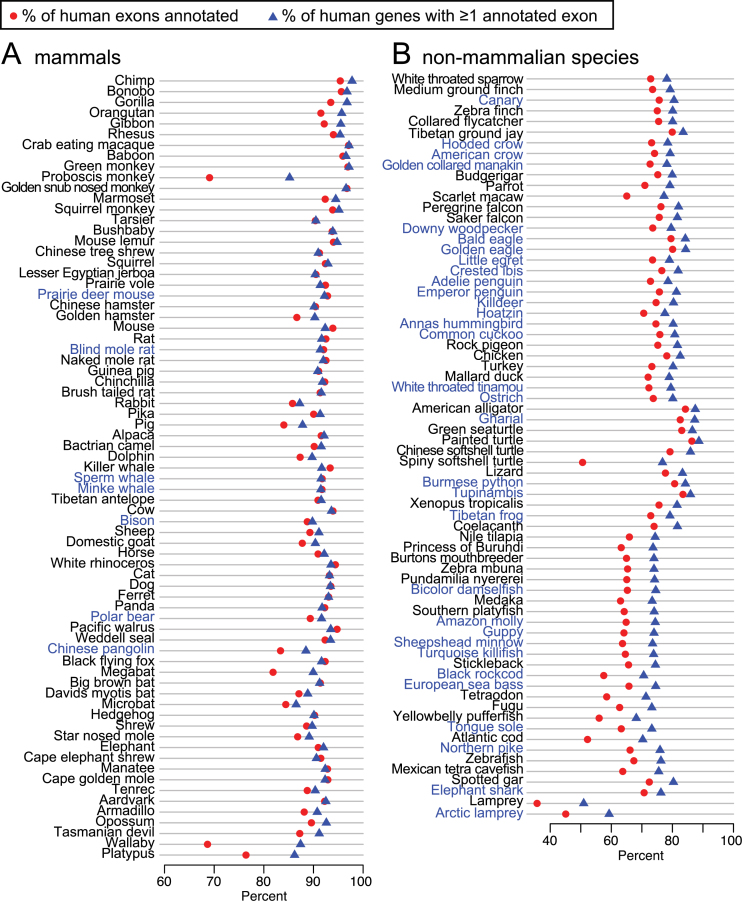
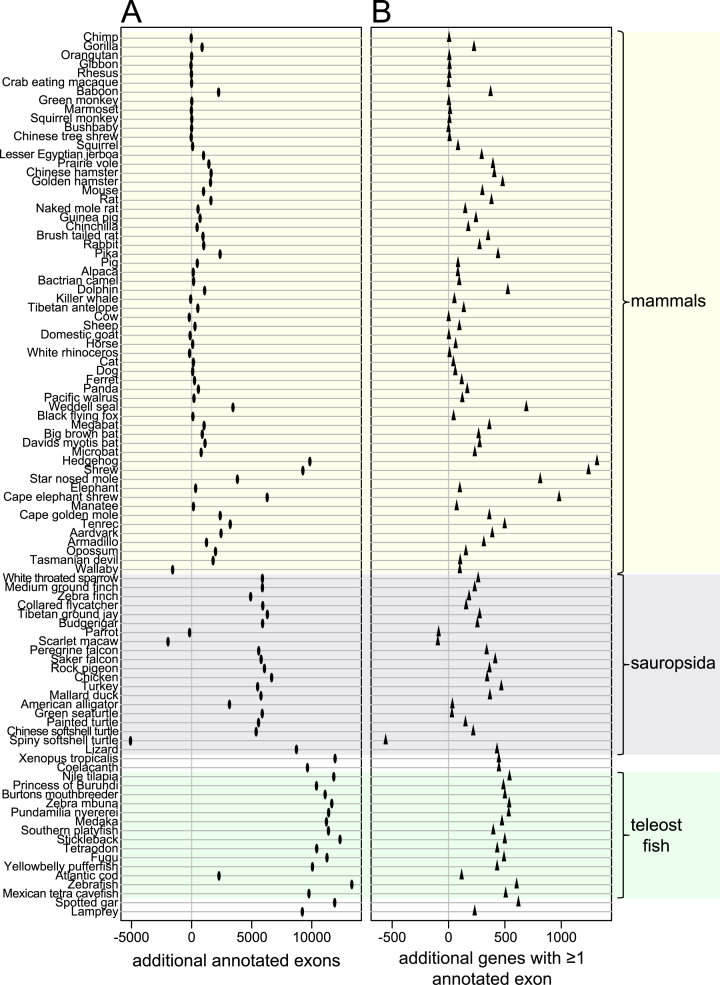
To systematically investigate how many additional exons and genes were detected in our 144-vertebrate alignment, we applied CESAR (19) to realign all 195 279 coding exons of 19 846 human genes and annotate intact exons in the 143 other vertebrate genomes (Figure 4). Then, we compared the number of human genes and exons that were annotated in other species for the UCSC 100-way alignment and our 144-vertebrate alignment. Figure 5 shows that our alignment allowed CESAR to map substantially more exons and genes. On average, we added 2382 exons for mammalian species, 4589 exons for sauropsids and 10 603 exons for teleost fish. Additionally, we added numerous new genes that were entirely missed in the 100-way alignment (on average 117 for mammals, 188 for sauropsids and 468 for teleost fish; Figure 5B). We conclude that higher alignment sensitivity substantially improves comparative gene annotations by detecting new exon alignments, especially between distantly-related species.
Figure 4.
Comparative gene annotation in 143 vertebrate genomes. The X-axis shows the proportion of human exons (red circles) and genes for which CESAR annotated at least one exon (blue triangle) in 73 mammals (A) and 70 non-mammalian vertebrates (B). Species in blue font are not contained in the UCSC 100-way or primate alignment.
Figure 5.
Increased alignment sensitivity detects thousands of additional conserved exons and hundreds of conserved genes between evolutionarily distant species. The figure shows the absolute number of exons (A) and genes (B) that are additionally annotated using our 144-vertebrate alignment, compared to the UCSC 100-way alignment. Only species for which the same assembly is included in both genome alignments are shown. Major clades are highlighted. Wallaby, parrot, scarlet macaw and spiny softshell turtle that have rather incomplete and fragmented genome assemblies are the only species were fewer exons or genes are annotated in our alignment. The reason is that fragmented assemblies result in short and low-scoring co-linear alignments that can be discarded by our more stringent filtering thresholds (see Methods). Manual inspection shows that such short co-linear alignments include paralogous gene alignments that would lead to incorrect gene annotations (Supplementary Figure S1). Given that our approach provides a consistent improvement in comparative gene annotation, better genome assemblies should substantially improve the gene annotation of these four species.
DISCUSSION
Here, we show that more sensitive alignment parameters allow the detection of thousands of novel alignments between orthologous exons that would be missed otherwise. Parameter set 2 appears to be appropriate for comparisons among placental mammals that have an evolutionary distance of up to ∼0.5 substitutions per neutral site. For comparisons of more distantly-related species whose evolutionary distance exceeds ∼0.75 substitutions per neutral site, parameter set 3 is more appropriate, since it consistently improved exon detection (Figure 2). This parameter set differs from set 2 by applying a subsequent round of highly sensitive alignments to find additional alignments between already-aligning regions. This additional step adds very little computational costs to the computationally expensive genome-wide alignment step (Supplementary Table S2). Together with our previous finding that this approach uncovers many additional non-exonic alignments (22), these results suggest that comparisons between distantly-related species could generally benefit from this strategy. The general approach of determining the number of alignments between exons of orthologous genes can be applied to test alignment parameters for species in other clades.
To systematically investigate if higher alignment sensitivity improves comparative gene annotations, we built a genome alignment of 144 vertebrates, which extends the largest currently available vertebrate genome alignment (27,28) by 44 species. This alignment is an important resource for comparative genomics and will facilitate tasks such as reconstructing ancestral genomes (32,33) or detecting patterns of sequence conservation at an unprecedented resolution (13,34,35). By using this alignment to map human coding genes to all 143 aligned vertebrates with CESAR, we show that the increased alignment sensitivity translates into thousands of additional exons and hundreds of additional genes (Figure 5). This enables a comparative gene annotation at a sensitivity that was not available before. Given that many sequenced vertebrate genomes are poorly annotated, CESAR’s comparative gene annotations in 143 vertebrates contribute to reduce the gap between genome sequencing and genome annotation.
AVAILABILITY
The multiple alignment and the comparative gene annotations are available for download and visualization as a track hub (31) in the UCSC genome browser at https://bds.mpi-cbg.de/hillerlab/144VertebrateAlignment_CESAR/. The alignment is also available at the UCSC test genome browser (http://genome-test.cse.ucsc.edu/). All source code is available at https://github.com/hillerlab/GenomeAlignmentTools.
Supplementary Material
ACKNOWLEDGEMENTS
We are grateful to the UCSC genome browser group for providing software, genomes and genome annotations. We thank the genomics community for sequencing and assembling the genomes. We also thank the Computer Service Facilities of the MPI-CBG and MPI-PKS for their support and Katrin Sameith for help with generating figures.
SUPPLEMENTARY DATA
Supplementary Data are available at NAR Online.
FUNDING
Max Planck Society and the German Research Foundation [HI 1423/3-1]. Funding for open access charge: Max Planck Society.
Conflict of interest statement. None declared.
REFERENCES
- 1. Picardi E., Pesole G.. Computational methods for ab initio and comparative gene finding. Methods Mol. Biol. 2010; 609:269–284. [DOI] [PubMed] [Google Scholar]
- 2. Burge C., Karlin S.. Prediction of complete gene structures in human genomic DNA. J. Mol. Biol. 1997; 268:78–94. [DOI] [PubMed] [Google Scholar]
- 3. Parra G., Blanco E., Guigo R.. GeneID in Drosophila. Genome Res. 2000; 10:511–515. [DOI] [PMC free article] [PubMed] [Google Scholar]
- 4. Stanke M., Waack S.. Gene prediction with a hidden Markov model and a new intron submodel. Bioinformatics. 2003; 19(Suppl. 2):ii215–i225. [DOI] [PubMed] [Google Scholar]
- 5. Birney E., Clamp M., Durbin R.. GeneWise and genomewise. Genome Res. 2004; 14:988–995. [DOI] [PMC free article] [PubMed] [Google Scholar]
- 6. Siepel A., Haussler D.. Proc. 8th Int’l Conf. on Research in Computational Molecular Biology. 2004; NY: ACM Press; 177–186. [Google Scholar]
- 7. Gross S.S., Brent M.R.. Using multiple alignments to improve gene prediction. J. Comput. Biol. 2006; 13:379–393. [DOI] [PubMed] [Google Scholar]
- 8. Gotoh O. Direct mapping and alignment of protein sequences onto genomic sequence. Bioinformatics. 2008; 24:2438–2444. [DOI] [PubMed] [Google Scholar]
- 9. Curwen V., Eyras E., Andrews T.D., Clarke L., Mongin E., Searle S.M., Clamp M.. The Ensembl automatic gene annotation system. Genome Res. 2004; 14:942–950. [DOI] [PMC free article] [PubMed] [Google Scholar]
- 10. Cantarel B.L., Korf I., Robb S.M., Parra G., Ross E., Moore B., Holt C., Sanchez Alvarado A., Yandell M.. MAKER: an easy-to-use annotation pipeline designed for emerging model organism genomes. Genome Res. 2008; 18:188–196. [DOI] [PMC free article] [PubMed] [Google Scholar]
- 11. Stanke M., Schoffmann O., Morgenstern B., Waack S.. Gene prediction in eukaryotes with a generalized hidden Markov model that uses hints from external sources. BMC Bioinformatics. 2006; 7:62. [DOI] [PMC free article] [PubMed] [Google Scholar]
- 12. Haas B.J., Salzberg S.L., Zhu W., Pertea M., Allen J.E., Orvis J., White O., Buell C.R., Wortman J.R.. Automated eukaryotic gene structure annotation using EVidenceModeler and the Program to Assemble Spliced Alignments. Genome Biol. 2008; 9:R7. [DOI] [PMC free article] [PubMed] [Google Scholar]
- 13. Lindblad-Toh K., Garber M., Zuk O., Lin M.F., Parker B.J., Washietl S., Kheradpour P., Ernst J., Jordan G., Mauceli E. et al. . A high-resolution map of human evolutionary constraint using 29 mammals. Nature. 2011; 478:476–482. [DOI] [PMC free article] [PubMed] [Google Scholar]
- 14. Stark A., Lin M.F., Kheradpour P., Pedersen J.S., Parts L., Carlson J.W., Crosby M.A., Rasmussen M.D., Roy S., Deoras A.N. et al. . Discovery of functional elements in 12 Drosophila genomes using evolutionary signatures. Nature. 2007; 450:219–232. [DOI] [PMC free article] [PubMed] [Google Scholar]
- 15. Zhu J., Sanborn J.Z., Diekhans M., Lowe C.B., Pringle T.H., Haussler D.. Comparative genomics search for losses of long-established genes on the human lineage. PLoS Comput. Biol. 2007; 3:e247. [DOI] [PMC free article] [PubMed] [Google Scholar]
- 16. Stanke M., Diekhans M., Baertsch R., Haussler D.. Using native and syntenically mapped cDNA alignments to improve de novo gene finding. Bioinformatics. 2008; 24:637–644. [DOI] [PubMed] [Google Scholar]
- 17. Siepel A., Bejerano G., Pedersen J.S., Hinrichs A.S., Hou M., Rosenbloom K., Clawson H., Spieth J., Hillier L.W., Richards S. et al. . Evolutionarily conserved elements in vertebrate, insect, worm, and yeast genomes. Genome Res. 2005; 15:1034–1050. [DOI] [PMC free article] [PubMed] [Google Scholar]
- 18. Cooper G.M., Stone E.A., Asimenos G., Green E.D., Batzoglou S., Sidow A.. Distribution and intensity of constraint in mammalian genomic sequence. Genome Res. 2005; 15:901–913. [DOI] [PMC free article] [PubMed] [Google Scholar]
- 19. Sharma V., Elghafari A., Hiller M.. Coding exon-structure aware realigner (CESAR) utilizes genome alignments for accurate comparative gene annotation. Nucleic Acids Res. 2016; 44:e103. [DOI] [PMC free article] [PubMed] [Google Scholar]
- 20. Harris R.S. Improved pairwise alignment of genomic DNA. 2007; The Pennsylvania State University, Ph.D. Thesis. [Google Scholar]
- 21. Kent W.J., Baertsch R., Hinrichs A., Miller W., Haussler D.. Evolution's cauldron: duplication, deletion, and rearrangement in the mouse and human genomes. Proc. Natl. Acad. Sci. U.S.A. 2003; 100:11484–11489. [DOI] [PMC free article] [PubMed] [Google Scholar]
- 22. Hiller M., Agarwal S., Notwell J.H., Parikh R., Guturu H., Wenger A.M., Bejerano G.. Computational methods to detect conserved non-genic elements in phylogenetically isolated genomes: application to zebrafish. Nucleic Acids Res. 2013; 41:e151. [DOI] [PMC free article] [PubMed] [Google Scholar]
- 23. Kinsella R.J., Kahari A., Haider S., Zamora J., Proctor G., Spudich G., Almeida-King J., Staines D., Derwent P., Kerhornou A. et al. . Ensembl BioMarts: a hub for data retrieval across taxonomic space. Database. 2011; 2011:bar030. [DOI] [PMC free article] [PubMed] [Google Scholar]
- 24. Herrero J., Muffato M., Beal K., Fitzgerald S., Gordon L., Pignatelli M., Vilella A.J., Searle S.M., Amode R., Brent S. et al. . Ensembl comparative genomics resources. Database. 2016; 2016:bav096. [DOI] [PMC free article] [PubMed] [Google Scholar]
- 25. Blanchette M., Kent W.J., Riemer C., Elnitski L., Smit A.F., Roskin K.M., Baertsch R., Rosenbloom K., Clawson H., Green E.D. et al. . Aligning multiple genomic sequences with the threaded blockset aligner. Genome Res. 2004; 14:708–715. [DOI] [PMC free article] [PubMed] [Google Scholar]
- 26. Hubisz M.J., Pollard K.S., Siepel A.. PHAST and RPHAST: phylogenetic analysis with space/time models. Brief. Bioinform. 2011; 12:41–51. [DOI] [PMC free article] [PubMed] [Google Scholar]
- 27. Tyner C., Barber G.P., Casper J., Clawson H., Diekhans M., Eisenhart C., Fischer C.M., Gibson D., Gonzalez J.N., Guruvadoo L. et al. . The UCSC Genome Browser database: 2017 update. Nucleic Acids Res. 2016; 45:D626–D634. [DOI] [PMC free article] [PubMed] [Google Scholar]
- 28. Rosenbloom K.R., Armstrong J., Barber G.P., Casper J., Clawson H., Diekhans M., Dreszer T.R., Fujita P.A., Guruvadoo L., Haeussler M. et al. . The UCSC Genome Browser database: 2015 update. Nucleic Acids Res. 2015; 43:D670–D681. [DOI] [PMC free article] [PubMed] [Google Scholar]
- 29. Speir M.L., Zweig A.S., Rosenbloom K.R., Raney B.J., Paten B., Nejad P., Lee B.T., Learned K., Karolchik D., Hinrichs A.S. et al. . The UCSC Genome Browser database: 2016 update. Nucleic Acids Res. 2016; 44:D717–D725. [DOI] [PMC free article] [PubMed] [Google Scholar]
- 30. Suarez H.G., Langer B.E., Ladde P., Hiller M.. chainCleaner improves genome alignment specificity and sensitivity. Bioinformatics. 2017; 33:1596–1603. [DOI] [PubMed] [Google Scholar]
- 31. Raney B.J., Dreszer T.R., Barber G.P., Clawson H., Fujita P.A., Wang T., Nguyen N., Paten B., Zweig A.S., Karolchik D. et al. . Track data hubs enable visualization of user-defined genome-wide annotations on the UCSC Genome Browser. Bioinformatics. 2014; 30:1003–1005. [DOI] [PMC free article] [PubMed] [Google Scholar]
- 32. Blanchette M., Green E.D., Miller W., Haussler D.. Reconstructing large regions of an ancestral mammalian genome in silico. Genome Res. 2004; 14:2412–2423. [DOI] [PMC free article] [PubMed] [Google Scholar]
- 33. Ma J., Zhang L., Suh B.B., Raney B.J., Burhans R.C., Kent W.J., Blanchette M., Haussler D., Miller W.. Reconstructing contiguous regions of an ancestral genome. Genome Res. 2006; 16:1557–1565. [DOI] [PMC free article] [PubMed] [Google Scholar]
- 34. Eddy S.R. A model of the statistical power of comparative genome sequence analysis. PLoS Biol. 2005; 3:e10. [DOI] [PMC free article] [PubMed] [Google Scholar]
- 35. Lin M.F., Kheradpour P., Washietl S., Parker B.J., Pedersen J.S., Kellis M.. Locating protein-coding sequences under selection for additional, overlapping functions in 29 mammalian genomes. Genome Res. 2011; 21:1916–1928. [DOI] [PMC free article] [PubMed] [Google Scholar]
Associated Data
This section collects any data citations, data availability statements, or supplementary materials included in this article.


