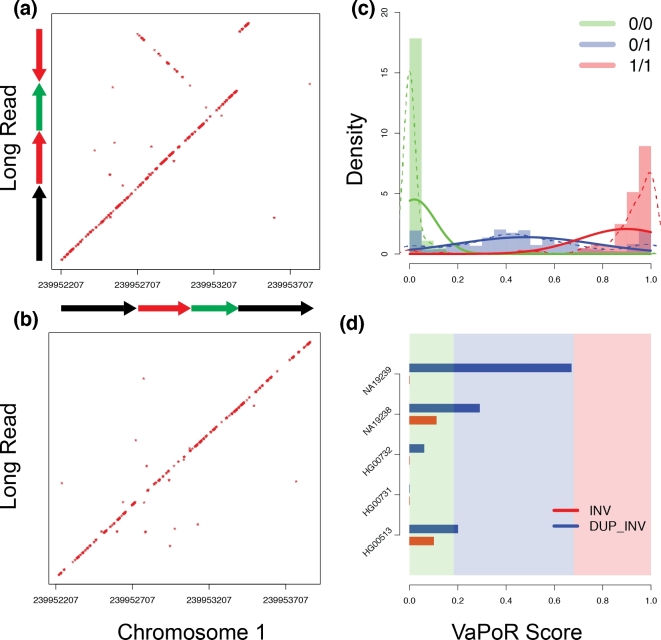
Figure 5:
Validation and genotyping of assessed regions using VaPoR. (a) Dot plot of reference genome (GRCh38) to an aligned long read in NA19239 (m150208_160301_42225_c100732022550000001823141405141504_s1_p0/3831/0_12148) for a reported inversion at position chr1:239952707–239953529. The signature is consistent with an inverted duplication structure. (b) Dot plot of a different read (m150216_212941_42225_c100729442550000001823151505141565_s1_p0/106403/0_13205) against the same location, consistent with a non-variant (reference) structure. (c) Distribution of VaPoR scores on all reported SVs on chr1 in samples HG00513, HG00731, HG00732, NA19238, NA19239, stratified by color (solid) and modeled with a Gaussian mixture model (dashed). (d) VaPoR scores of SV above now stratified by color as indicated in (c) for both reported inversion (red) and predicted inverted duplication (blue).

