Abstract:
Hemodilution is a common perioperative practice. The deleterious effects of excessive hemodilution and subsequent edema formation have been well documented by numerous authors. Colloid oncotic pressure (COP) is a reliable clinical indicator of hemodilution in cardiac surgery. The intent of this study is to determine if a correlation exists between COP and various patient outcome variables. It would also be helpful to know if there is a particular COP value to avoid preventing or limiting patient morbidity. Blood samples from 61 adult patients (mean age = 70 years old) undergoing cardiopulmonary bypass surgery were collected for COP calculation and comparison. Sample collection was performed before heparinization, during cardiopulmonary bypass, at the conclusion of cardiopulmonary bypass, and in the intensive care unit. The resultant values obtained were used to generate a calculated COP. The lowest sustained COP was then compared with various patient outcome variables such as fluid balance, post-operative weight gain, post-operative blood loss, extubation time, length of stay, and blood products administered. A statistically significant difference (p < .05) was found between the COP and each of the monitored continuous variables. The data also suggest that maintaining a patient’s COP at or above 15 mmHg could be desirable. Frequent monitoring of a patient’s COP can provide a potential benefit to clinical decision making.
Keywords: cardiopulmonary bypass (CPB), colloid, colloid oncotic pressure, edema, extubation
In cardiac surgery, fluid administration is a modality of treatment for obvious hypovolemia and for hemodynamic stability. As a result, hemodilution becomes a potential side effect that may occur frequently. A variety of clinicians both in the operating room and the intensive care unit (ICU) make daily decisions on when, how much, and what kind of fluid to give to manage a patient’s hemodynamic stability during the surgical course. These decisions can lead to excessive hemodilution, fluid overload, edema, and possibly the inappropriate administration of blood products, causing a cascade of negative events that can complicate the patient’s outcome or even survival (1–3). Colloid oncotic pressure (COP) plays an important role in the fluid balance between the intra-vascular and interstitial (extravascular) fluid compartments. Starling proposed that the net fluid volume movement across the capillary membrane is based on the interaction between two opposing forces: the difference in hydrostatic pressure and the difference in COP on either side of the membrane between the capillary and interstitial fluid spaces (4). Some have shown that a highly positive fluid balance is related to, or causative of, a lowered COP yielding an increase in post-operative weight gain (2,5). Others measured extravascular lung water and attributed its accumulation to a decreased COP (5,6). Several others indicated that a significant decrease in COP will have a cumulative effect on prolonging a patient’s time on the ventilator (2,6,7), which can then lead to an increased length of stay (1,2,5). A common theme among these studies remains that a depressed COP encourages and/or causes edema formation in the extravascular space of tissues and organs.
This study was undertaken to determine if COP is related to patient morbidity. The null hypothesis states: There is no correlation (correlation = 0) between COP and patient variables such as perfusion fluid balance (Perf fluid), intra-operative fluid balance (IOP fluid), total fluid balance (total fluid), post-operative weight gain, post-operative blood loss, extubation time, blood product usage, ICU length of stay (ICU LOS), and total length of hospital stay (LOS).
MATERIALS AND METHODS
This investigational review board–approved correlational study encompassed the adult cardiac surgical population at St. John Hospital and Medical Center (Detroit, MI). All patients initially qualified. All cases were performed according to the already established hospital protocol for each of the disciplines involved. Perfusion circuits were comprised of Sorin/Gish Total Vision circuits (Arvada, CO) inclusive of an oxygenator, open reservoir, arterial line filter, and tubing. Cardioplegia circuits were Terumo MP4 single pass 4:1 blood or Terumo MP4 (Terumo Cardiovascular Systems Corp., Ann Arbor, MI) recirculation crystalloid sets depending upon surgeon preference. Crystalloid prime amounts vary from 150 to 750 mL depending on the results from retrograde autologous priming and how much colloid was administered. Colloid in the prime is usually 25% albumin 12.5–25 g or 6% Hespan 200 mL and 25% mannitol usually 25 g. Laboratory analysis of arterial blood gases, electrolytes, hemoglobin/hematocrit, and glucose were performed intra-operatively by the perfusion staff with a Radiometer ABL80 Co-Ox analyzer (Radiometer America, West Lake, OH). Activated clotting times and heparin concentrations were performed intra-operatively by the perfusion staff with a Medtronic ACT II and a Medtronic HMS system (Medtronic, Minneapolis, MN). Because an oncometer was not available for this study, the COP was calculated using patient total protein and albumin/globulin (A/G) ratios as described by Nematbakhsh and Moradi (8). This methodology was used because Nematbakhsh’s calculated COP showed no statistically significant difference when compared with an oncometer measured COP (8). Therefore, additional blood samples were sent to the laboratory for analysis of total serum protein and A/G ratios performed on a Roche Modular P Multi-channel Analyzer (Roche Diagnostics, Indianapolis, IN). Laboratory analysis of blood samples were performed according to the already established protocol of two pre-bypass, every 30 minutes on bypass, one to two post-bypass, and then according to the normal ICU protocol. Patient data extracted and collected are described in Table 1. The data were collected from a variety of sources such as e-Care (electronic Patient Record), perfusion records, and the Society of Thoracic Surgeons (STS) database collection sheets.
Table 1.
Patient data extracted and collected.
| Date of surgery | Albumin level |
| Patient age | Total protein level |
| Patient gender | Globulin level |
| Cardiac procedure | A/G ratio |
| Co-morbidities | Fluid balance |
| Surgeon | Post-operative weight gain |
| Patient weight | Post-operative blood loss |
| Cross-clamp time | Extubation time |
| Cardiopulmonary bypass time | Blood products given |
| Hemoglobin/hematocrit | ICU length of stay |
| Temperature | Total length of stay |
A/G ratio, albumin/globulin; ICU, intensive care unit.
Statistical Analysis
PC SAS version 9.2 was used for all summaries and analyses. Study population demographics such as age, weight, cross-clamp time, and cardiopulmonary bypass time were tested for normality using Shapiro–Wilks test. The descriptive statistics (mean and SD for age, median, and interquartile ranges {IQ range} [25th percentile, 75th percentile] for the other continuous variables) were calculated for these variables as well as the frequency and percentages for each gender. Collected patient laboratory data such as total protein, albumin, globulin, and A/G ratio were used to calculate the COP using the formula (8):
The lowest COP was then compared with the other variables collected to determine the relationship between COP and the clinical outcome variables. The following continuous variables were tested for normality using Shapiro–Wilks test: perfusion fluid balance (Perf fluid), IOP fluid balance, total fluid balance (total fluid), post-operative weight gain, post-operative blood loss, extubation time, ICU LOS, LOS, and COP. Spearman’s correlation coefficients and p-values were calculated for COP with each of the above variables (Null Hypothesis: Correlation = 0). A t test was used to test for differences in COP between those given blood products vs. those not given blood products. COP was also divided into two groups: those subjects with COP <15 mmHg and those with COP ≥15 mmHg. This was performed prospectively in an attempt to validate Kerkoff’s findings that edema was present in patients with a COP <15 mmHg (9). The nonparametric Wilcoxon Test was used to test for differences in the continuous variables between COP groups. Frequencies, percentages, and the p-value from the Chi-square test were calculated for each COP level group by blood products given. For all data, a p-value of .05 or less will be considered to indicate statistical significance.
RESULTS
Sixty-one patients completed the study. All off-pump coronary artery bypass surgeries and two emergency aortic dissections were excluded from the study. Table 2 contains descriptive statistics for gender, age, weight, cross-clamp time, and cardiopulmonary bypass time. For gender, the frequencies and percentages are presented. For age, the range was 45–90 years old with the mean and the SD being presented. The median and interquartile ranges are listed for the remaining variables.
Table 2.
Descriptive statistics of demographic variables.
| Variable Name | Units | Descriptive Statistics* |
|---|---|---|
| n = 61 | ||
| Gender | — | |
| Male | 35 (57%) | |
| Female | 26 (43%) | |
| Age | Years | 69.6 (11.8) |
| Weight | kg | 82 (72, 96) |
| XC time | Minutes | 79 (68, 98) |
| CPB time | Minutes | 107 (92, 132) |
CPB, cardiopulmonary bypass; XC, cross-clamp.
*For gender, the frequencies and percentages are presented. For age, the mean and SD are presented. For the remaining variables, the median and interquartile ranges are presented.
Table 3 provides the descriptive statistics for each continuous variable and the Spearman’s correlation coefficients compared with COP. COP is represented by the mean and SD, whereas the remaining continuous variables are described by the median and interquartile ranges. Spearman’s correlation assesses how well the relationship between two variables exists. Targeted correlation coefficients indicating an acceptable correlation were set to be a range of values from .4 to .95. The perfusion fluid balance correlation was .39, which fell just below the range. This indicates a slightly weaker correlation and is because the perfusion fluid balance is just a component part of both the IOP fluid balance and the total fluid balance, both of which had a greater influence on the results as a whole. The Spearman’s correlation coefficients indicate that each variable is negatively correlated with the COP, demonstrating that as COP decreases, the value of each variable increases. The p-values in Table 3 indicate a statistically significant correlation for each continuous variable with COP.
Table 3.
Descriptive statistics for each continuous variable and Spearman's correlation coefficients.
| Variable Name | Units | Descriptive Statistics* | Spearman’s Correlation Analysis | |
|---|---|---|---|---|
| n = 61 | Correlation Coefficient | p-Value | ||
| COP | mmHg | 15.6 (2.3) | — | — |
| Blood loss | mL | 740 (510, 1,210) | −.74 | <.0001 |
| Ext time | h | 10 (7.5, 23) | −.69 | <.0001 |
| ICU LOS | h | 71 (50, 120) | −.49 | <.0001 |
| IOP fluid | mL | 1,055 (750, 1,650) | −.57 | <.0001 |
| LOS | Days | 7 (5, 10) | −.52 | <.0001 |
| Perf fluid | mL | 345 (−950, 850) | −.39 | .0017 |
| Total fluid | mL | 1,350 (1,100, 2,500) | −.78 | <.0001 |
| Weight gain | kg | 2.5 (1.5, 8.5) | −.84 | <.0001 |
COP, colloid oncotic pressure; h, hours; ICU LOS, intensive care unit length of stay; IOP, intra-operative; LOS, total length of stay.
*For COP, the mean and SD are presented. For the remaining variables, the median and interquartile ranges are presented.
Table 4 describes the statistics (mean, SD) of COP and blood product usage along with the p-value from the t test of the comparison. The p-value is statistically significant, indicating that there is a difference in COP between those given blood products vs. those not given blood products. Based on the means, those with a lower COP had a greater probability of receiving blood products.
Table 4.
Descriptive statistics of COP at blood level category and p-value from comparison.
| Blood Given? | p-Value | ||
|---|---|---|---|
| Yes (n = 44) | No (n = 17) | ||
| COP | 15.1 (2.4) | 16.8 (1.6) | .01 |
COP, colloid oncotic pressure.
DISCUSSION
Excessive hemodilution that leads to the formation of edema has been shown to increase a patient’s mortality rate (1). In fact, in relation to edema formation, perioperative weight gain and patient mortality, no patient undergoing a major surgical procedure survived if the perioperative weight gain was more than 20% (10). The COP at which edema occurs is controversial. The range of minimum values is from 12 to 18 mmHg (9). The effect that COP has on the formation of edema was studied by Kerkoff (9). One of the purposes of his study was to determine the COP value that would form edema. Kerkoff found that whenever the COP was <15 mmHg, edema was present.
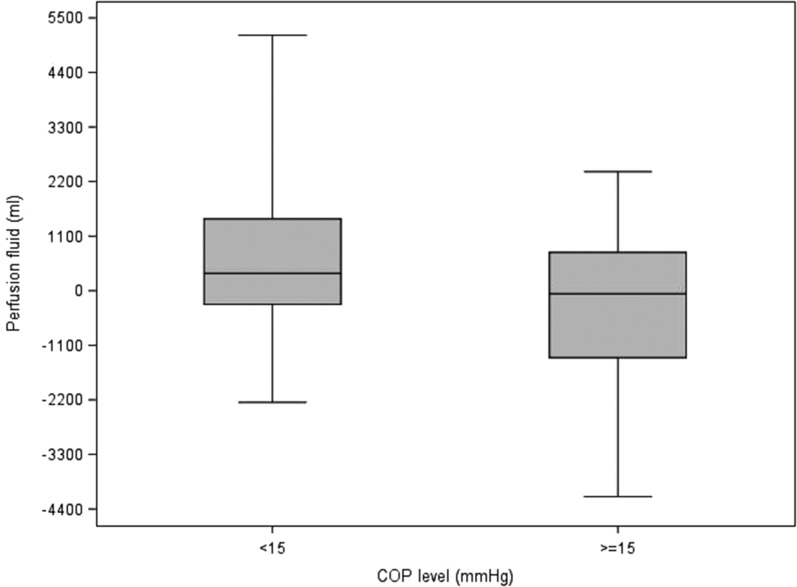
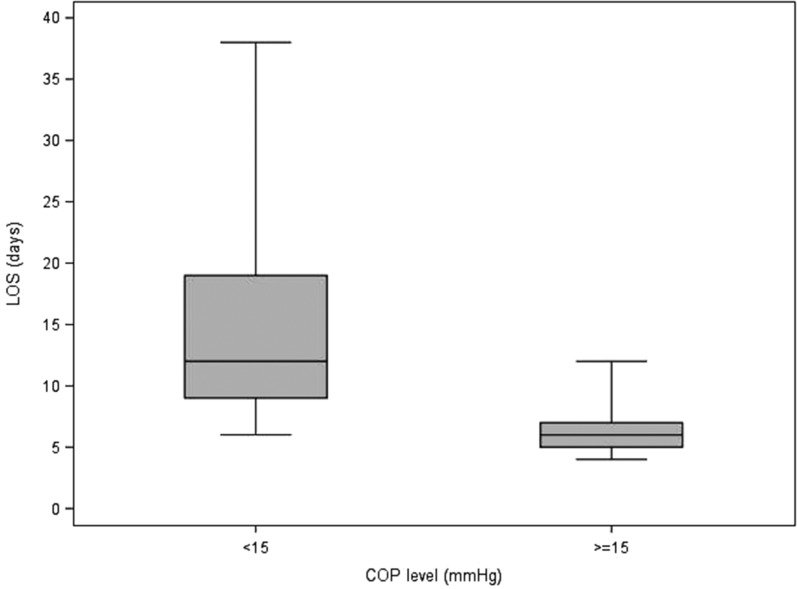
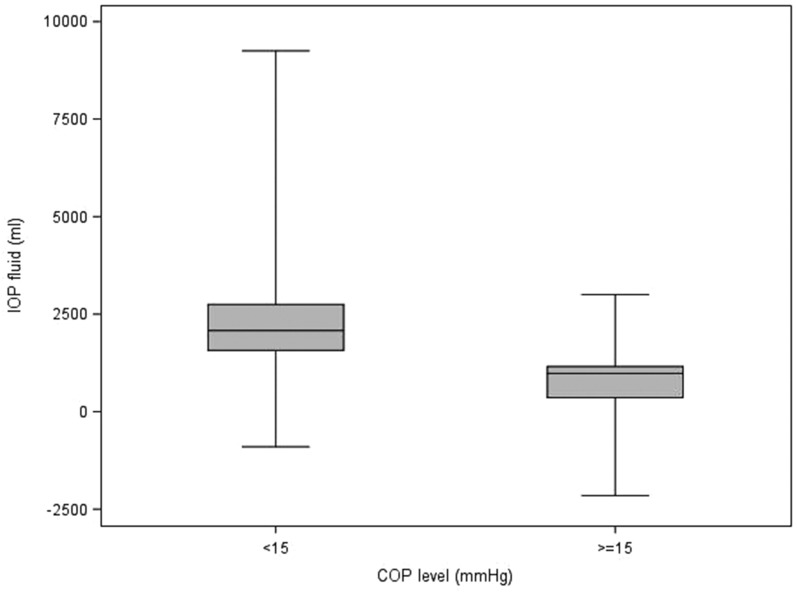
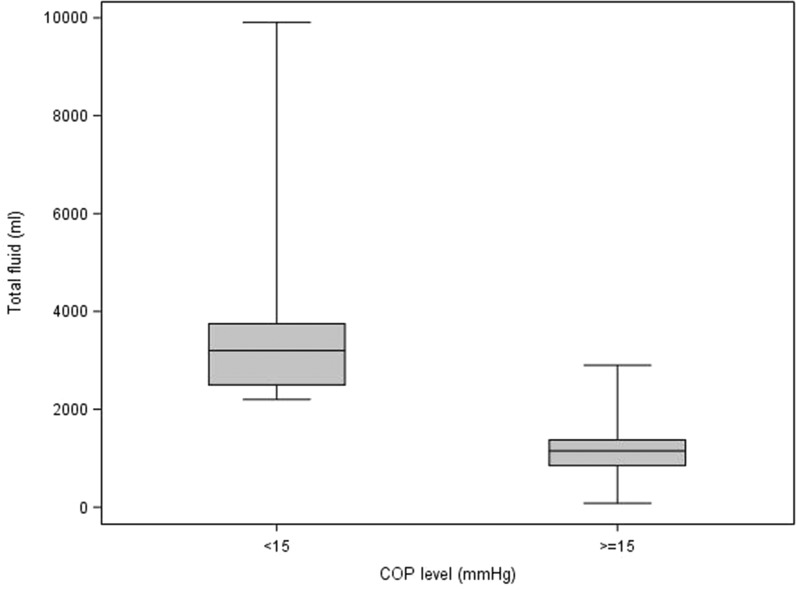
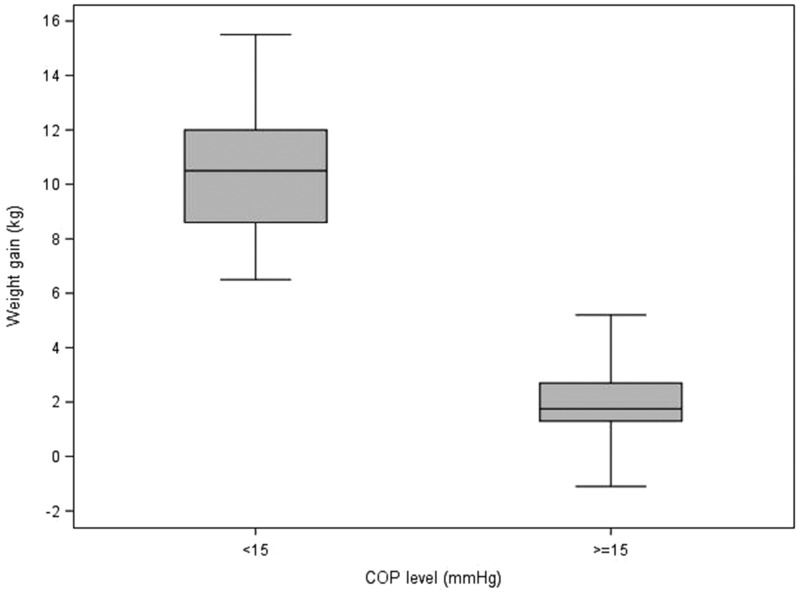
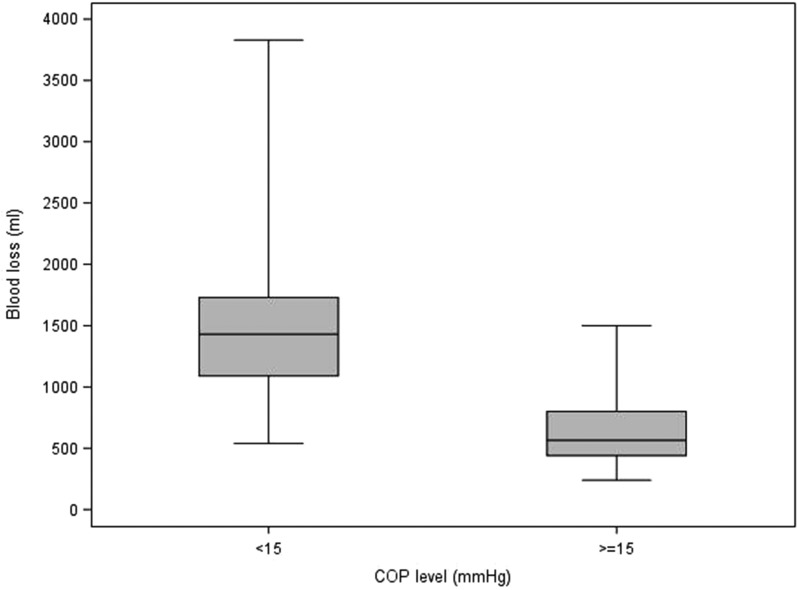
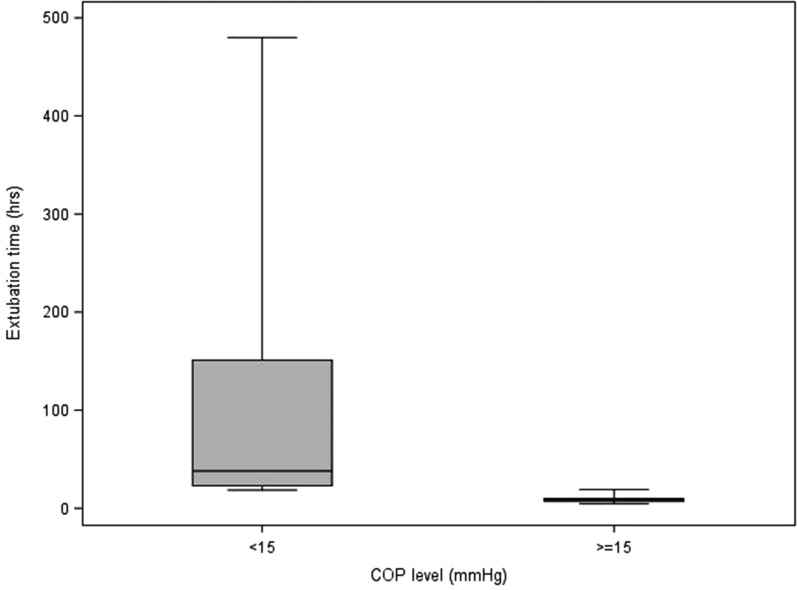
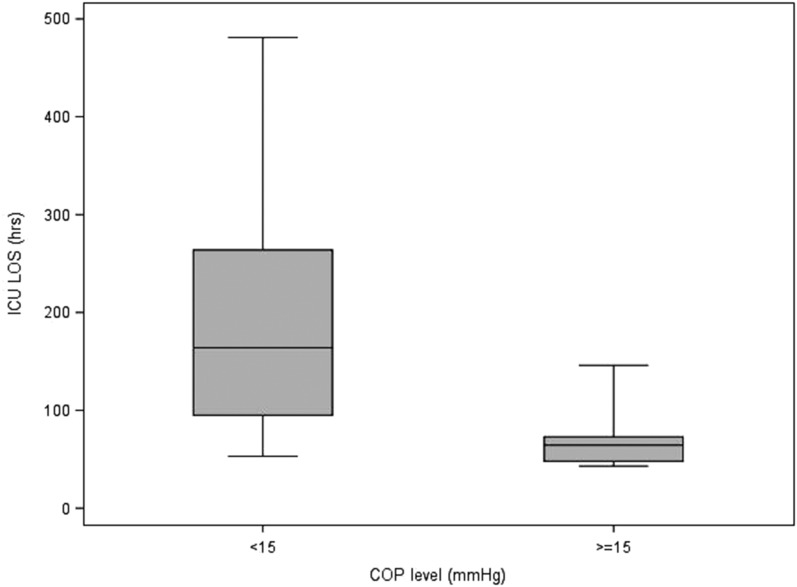
Table 5 describes the statistics of each variable to each of the delineated COP levels (intervals; <15, ≥15). It also contains the p-values from the Wilcoxon and Chi-square tests that compare the COP levels. For blood product usage, the frequency and percentage of those given blood products are presented. For the rest of the continuous variables, the median and interquartile ranges are presented. Values for the continuous patient outcome variables were all significantly higher in the <15 mmHg COP level group compared with the ≥15 mmHg COP level group. The associated p-values indicate statistical significance for the comparison. The <15 mmHg COP level group had a higher percentage of subjects receiving blood products compared with the ≥15 mmHg COP level group. Figures 1–8 contain box plots of each variable at each COP level group as a graphic representation of the data in Table 5.
Table 5.
Descriptive statistics and p-values for parameters at each COP category.
| Variable Name | Units | COP Level | p-Value | |
|---|---|---|---|---|
| <15 mmHg | ≥15 mmHg | |||
| n = 19 | n = 42 | |||
| Blood loss | mL | 1,430 (1,090, 1,730) | 565 (440, 800) | <.0001 |
| Ext time | h | 38 (23, 151) | 8.2 (7, 10) | <.0001 |
| ICU LOS | h | 164 (95, 264) | 64.5 (48, 73) | <.0001 |
| IOP fluid | mL | 2,080 (1,570, 2,750) | 980 (360, 1,160) | .0001 |
| LOS | Days | 12 (9, 19) | 6 (5, 7) | <.0001 |
| Perf fluid | mL | 350 (−275, 1,450) | −62.5 (−1,350, 775) | .0264 |
| Total fluid | mL | 3,200 (2,500, 3,750) | 1,150 (850, 1,375) | <.0001 |
| Weight gain | kg | 10.5 (8.6, 12) | 1.75 (1.3, 2.7) | <.0001 |
| Blood given | – | 19 (100%) | 25 (60%) | .0011 |
COP, colloid oncotic pressure; Ext, extubation, ICU LOS, intensive care unit length of stay; IOP, intra-operative; LOS, total length of stay; Perf, perfusion.
Figure 1.
Perfusion fluid (mL) for each level of COP (mmHg). COP, colloid oncotic pressure.
Figure 8.
LOS (days) for each level of COP (mmHg). COP, colloid oncotic pressure; LOS, total length of stay.
Figure 2.
IOP fluid (mL) for each level of COP (mmHg). COP, colloid oncotic pressure; IOP, intra-operative.
Figure 3.
Total fluid (mL) for each level of COP (mmHg). COP, colloid oncotic pressure.
Figure 4.
Weight gain (kg) for each level of COP (mmHg). COP, colloid oncotic pressure.
Figure 5.
Blood loss (mL) for each level of COP (mmHg). COP, colloid oncotic pressure.
Figure 6.
Extubation time (hours) for each level of COP (mmHg). COP, colloid oncotic pressure.
Figure 7.
ICU LOS (hours) for each level of COP (mmHg). COP, colloid oncotic pressure; ICU LOS, intensive care unit length of stay.
A limitation of this study was that an oncometer was not available to perform direct COP measurements. In lieu of this, a calculated COP using a formula described by Nematbakhsh and Moradi (8) was used because it showed no statistically significant difference when compared with an oncometer measured COP. A larger sample size is always desired as it increases the power of the study and therefore future parallel studies are recommended.
CONCLUSION
The results of this study showed statistical significance to support accepting the hypothesis that COP is inversely correlated with the continuous variables: perfusion fluid balance, IOP fluid balance, total fluid balance, post-operative weight gain, post-operative blood loss, extubation time, blood product usage, ICU LOS, and LOS. Statistical analysis also suggests that regarding COP, it would be prudent to maintain COP at or above 15 mmHg. Complimentary studies utilizing COP as a clinical parameter could assist clinicians in determining cause and effect relationships that exist when comparing different modalities of fluid therapy such as colloids vs. crystalloids. Information such as this could prove to be quite useful both intra-operatively and post-operatively leading to improved patient outcomes.
ACKNOWLEDGMENTS
We thank Valerie K. Shostrom, statistical coordinator for the College of Public Health at the University of Nebraska Medical Center for her expert assistance with statistical analysis and advice.
REFERENCES
- 1.Toraman F, Evrenkaya S, Yuce M. Highly positive intra-operative fluid balance during cardiac surgery is associated with adverse outcome. Perfusion. 2004;19:85–91. [DOI] [PubMed] [Google Scholar]
- 2.Martin G. Fluid balance and colloid osmotic pressure in acute respiratory failure: Emerging clinical evidence. Crit Care. 2000;4(Suppl 2):S21–5. [DOI] [PMC free article] [PubMed] [Google Scholar]
- 3.Fritz HG, Brandes H. Post-operative hypoalbuminemia and procalcitonin elevation for prediction of outcome in cardiopulmonary bypass surgery. Acta Anaesthesiol Scand. 2003;47:1276–83. [DOI] [PubMed] [Google Scholar]
- 4.Starling EH. On the absorption of fluids from the connective tissue spaces. J Physiol. 1896;19:312–26. [DOI] [PMC free article] [PubMed] [Google Scholar]
- 5.Eising GP, Pfauder M, Niemeyer M, et al. Retrograde autologous priming: Is it useful in elective on-pump coronary artery bypass surgery? Ann Thorac Surg. 2003;75:23–7. [DOI] [PubMed] [Google Scholar]
- 6.Verheij J, van Lingen A, Raijmakers P. Pulmonary abnormalities after cardiac surgery are better explained by atelectasis than by increased permeability edema. Acta Anaesthesiol Scand. 2005;49:1302–10. [DOI] [PubMed] [Google Scholar]
- 7.Ali MA, Saleah M. Selection of optimal quantity of hydroxyethyl starch in the cardiopulmonary bypass prime. Perfusion. 2004;19:41–5. [DOI] [PubMed] [Google Scholar]
- 8.Nematbakhsh M, Moradi A. Mathematical model for determination of colloid osmotic pressure: The role of albumin–globulin ratio. J Res Med Sci. 2006;11:364–9. [Google Scholar]
- 9.Kerkoff AC. Plasma colloid osmotic pressure as a factor in edema formation and edema absorption. Ann Intern Med. 1937;11:867–79. [Google Scholar]
- 10.Chappell D, Jacob M, Hofmann-Kiefer K, et al. A rational approach to perioperative fluid management. Anesthesiology. 2008;109:723–40. [DOI] [PubMed] [Google Scholar]


