

SUMMARY
Directing the fate of human pluripotent stem cells (hPSCs) into different lineages requires variable starting conditions and components with undefined activities, introducing inconsistencies that confound reproducibility and assessment of specific perturbations. Here we introduce a simple, modular protocol for deriving the four main ectodermal lineages from hPSCs. By precisely varying FGF, BMP, WNT, and TGFβ pathway activity in a minimal, chemically-defined medium, we show parallel, robust, and reproducible derivation of neuroectoderm, neural crest (NC), cranial placode (CP), and non-neural ectoderm in multiple hPSC lines, on different substrates independently of cell density. We highlight the utility of this system by interrogating the role of TFAP2 transcription factors in ectodermal differentiation, revealing the importance of TFAP2A in NC and CP specification, and performing a small molecule screen that identified compounds which further enhance CP differentiation. This platform provides a simple stage for systematic derivation of the entire range of ectodermal cell types.
Graphical Abstract
INTRODUCTION
Early developmental cell types are difficult to isolate and study in humans. The directed differentiation of pluripotent stem cells (PSCs) offers a model system to access early fate decisions in a systematic manner for applications in basic and translational biology. Several strategies exist to differentiate PSCs into early lineages such as spontaneous differentiation paradigms and directed differentiation strategies based on the in vitro modulation of developmental pathways known to act during development in vivo (Suzuki and Vanderhaeghen, 2015; Tabar and Studer, 2014). Factors that greatly affect outcome across various differentiation platforms include the use of feeder cells, monolayer versus embryoid body based strategies or complex media compositions. For example, many published protocols involve media containing serum or serum-replacement factors such as KSR for deriving a desired fate. Batch-to-batch variability in the manufacturing of those reagents affects reproducibility of differentiation making it often necessary to pursue laborious lot testing in order to generate specific cell types of interest (Blauwkamp et al., 2012; Gadue et al., 2006; Zimmer et al., 2016). While such extensive quality control strategies for complex reagents such as KSR are feasible for any single protocol, they prevent the development of more ambitious strategies aimed at generating dozens or possibly hundreds of defined cell types in a modular fashion.
Our lab has established protocols to derive multiple cell types of the nervous system based on the addition of LDN193189 and SB431542, small molecules that inhibit the BMP and TGFβ signaling pathways, respectively. This inhibitory cocktail combination, termed dual SMAD inhibition (dSMADi), allows for the efficient generation of cells in the central nervous system (CNS) defaulting towards an anterior neuroectoderm (NE) marked by expression of the transcription factor PAX6 (Chambers et al., 2009). Modifications of dSMADi can yield many different neural subtypes along the neuraxis of the embryo including forebrain, midbrain and spinal cord progenitors (Suzuki and Vanderhaeghen, 2015; Tabar and Studer, 2014). In addition, dSMADi can be adapted to generate non-CNS cell types such as neural crest (NC) (Menendez et al., 2011; Mica et al., 2013), cranial placode (CP) and non-neural ectoderm (NNE) (Dincer et al., 2013; Leung et al., 2013). Overall, dSMADi is a robust and widely used platform that will generate a near homogenous layer of PAX6+ NE. However, even for deriving PAX6+ NE under dSMADi, the acquisition of the most anterior, telencephalic marker FOXG1+ in PAX6+ cells, can be affected by KSR batch variability; a problem which may necessitate the addition of an indirect inhibitor of the WNT signaling pathway (XAV09393) to fully restore telencephalic fate potential (Maroof et al., 2013). Therefore, a scalable and fully modular differentiation platform should be devoid of KSR or other complex media factors. Here we set out to establish such a defined platform to access in parallel all major ectodermal lineages (CNS-NE, NC, CP, NNE).
Recently, several alternative base media have been developed that are chemically defined and generated with fewer components. In particular, the development of the Essential 8 (E8) media enables maintenance of hPSCs with just eight defined compounds and lack of any animal proteins (Chen et al., 2011). In addition, removal of 2 components, namely TGFβ1 and FGF2, triggers spontaneous differentiation of hPSCs. Transition from E8 to Essential 6 (E6) can give rise to PAX6+ NE without the addition of any small molecule inhibitors (Lippmann et al., 2014), though addition of TGFβ signaling inhibitors greatly improves speed and efficiency of neural fate acquisition. In this report, we have formulated a directed differentiation system to derive in parallel and with high purity, all major ectodermal lineages from human PSCs under fully defined media conditions. We apply these differentiation strategies to pursue proof of concept studies that either address the effects of genetic perturbation experiments on the entire set of ectodermal lineages (rather than on a specific lineage) or that demonstrate the feasibility of chemical screening to identify molecules that further enhance differentiation towards specific ectodermal fates. The efficiency and versatility of the differentiation platform represents an important step towards the long-term goal of establishing modular directed differentiation conditions to access any human cell type from PSCs on demand in vitro.
RESULTS
dSMADi-based differentiation protocols for deriving the four ectodermal lineages are skewed towards NE fate using a chemically defined system
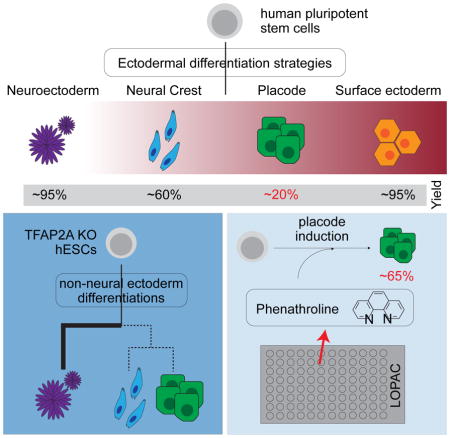
The four major ectodermal lineages comprise the neuroectoderm (NE), neural crest (NC), cranial Placode (CP) and non-neural ectoderm (NNE). Each of those lineages can be generated by modifying dSMADi conditions using traditional KSR (knockout serum replacement)-based protocols as summarized in Figure S1A. Under KSR-conditions, the optimal time point to include or subtract patterning factors is at 48 hours post induction (Dincer et al., 2013; Mica et al., 2013). At this time point, continuation with dSMADi generates anterior NE, activation of WNT signaling with CHIR99021 generates cranial NC, removal of the BMP inhibitor LDN193189 generates cranial placode, or blocking FGF signaling with SU5402 in combination with LDN193189 removal triggers NNE fates. Defined transcription factors and other lineage-specific markers can be used to uniquely identify each of the early ectodermal lineages. The generation of NE is marked by the expression of the SOX1 and PAX6 and the absence of TFAP2A. The expression of TFAP2A in combination with the presence or absence of SOX10 and SIX1 separates the ectoderm from the non-neural ectoderm-derived cell types. In combination with TFAP2A, expression of SOX10 versus SIX1 specifically marks NC versus CP identity, respectively. It remains unclear if there is a specific transcription factor for NNE, however the expression of TFAP2A in the absence of both SOX10 and SIX1 appears to reliably identify NNE under those culture conditions (Figure S1B).
To monitor the acquisition of those various ectodermal lineage markers in defined differentiation media, we used three GFP reporter lines, PAX6::H2B-GFP (Figure S1C,D,E and F) SOX10::GFP (Chambers et al., 2012; Mica et al., 2013) and SIX1::H2B-GFP (Figure S1C,G and H). Differentiation of the lines under KSR-based conditions into specific cell types produced an average of 95%, 50% and 58% of NE, CP and NC, respectively (Figure S1I and S1J). Although overall differentiation efficiencies were quite high, the yield of CP and NC cells was variable across repeat differentiations suggesting that certain factors in the KSR-based conditions may vary and thereby affecting yield. Furthermore, when the regional patterning of the NE was assessed, the expression of PAX6 and SOX1 was very robust (Figure S1I) but the anterior marker FOXG1 was variable even with WNT inhibition in one of the KSR batch tested (Figure S1J), implying that KSR contains components that can alter regional identity during differentiation.
To transition these protocols into the more defined E6 media, we adapted hPSCs in E8 for multiple passages and initially replaced simply the KSR-based medium with an E6-based differentiation while maintaining factors and concentrations as described previously to trigger the 4 major ectodermal lineages (Figure 1A). We found that the original concentrations for some of the small molecules, namely CHIR99021 and SU5402, effectively killed the cells during differentiation and had to be re-titrated (data not shown). After determining an optimal non-toxic concentration for each of the small molecules we observed that NE formation under E6 conditions was equivalent to that obtained with KSR-based conditions. The formation of NE in the absence of small molecules under E6 conditions was demonstrated previously (Lippmann et al., 2014). We compared the efficiency of generating PAX6 positive cells using either no small molecules, using dSMADi or using the single TGFβ inhibitor SB431542 (SB). We found upregulation of PAX6 expression in the absence of dSMADi (~40% of total cells on day 12 post induction). However, the percentage of cells expressing PAX6 was further improved upon addition of SB or complete dSMADi to nearly 90% and 80%, respectively (Figure S2A). PAX6+ NE can efficiently form neural rosettes (Figure S2B) that can be further differentiated into TBR1+ cortical neurons (Figure S2C) indicating that these cells can progress through the early stages of cortical development. Upon further culture (day 50 of differentiation), the resulting neurons displayed responsiveness to glutamate treatment as shown by calcium imaging (Figure S2D). Surprisingly, high percentages of PAX6+ cells were observed in nearly all the treatment groups including in cells maintained under CP or NNE conditions. Although CP cells can express PAX6, these cells did not co-express SIX1 suggesting they are not of CP origin. Additionally, NC induction did not generate either PAX6 nor SOX10 positive cells efficiently (Figure S2E, F), suggesting that WNT activation may alter the regional identity of differentiating, putative NE cells rather than inducing NC. Finally, a comparative gene expression analysis of hPSCs differentiated towards NC under KSR versus E6 conditions revealed a lack of non-neural marker expression under E6 (Figure S2G). Overall, the data suggest that E6 lacked factors to induce non-neural fates under the small molecule conditions developed for KSR based differentiations.
Figure 1. BMP signaling is necessary to obtain non-neural ectoderm.

A. Diagram of differentiation strategies by replacement of KSR for E6. B. Representative immunofluorescence staining of particular lineage markers during the differentiation of hPSCs into the ectodermal lineages. C. Representation of the neural plate border model and important signaling pathways that influence particular cell fates. D. Immunofluorescence staining of differentiating cells treated with various concentrations of BMP4 for 3 days. E. Quantification of TFAP2A positive cells at various BMP4 concentrations after 3 days of treatment. F. The derivation of TFAP2A positive, PAX6 negative, SIX1 negative, and SOX10 negative non-neural ectoderm is achieved by using a high concentration of BMP4 (20ng/ml). G. Immunofluorescence staining of keratinocyte markers K18 and K14 upon further differentiation of the NNE at two different time points. Scale bars 50μm.
BMP signaling through TFAP2A is necessary to generate non-CNS fates
In order to understand why most ectodermal lineage protocols failed to induce non-neural fates, we investigated the induction of Transcription Factor AP2α (TFAP2A). TFAP2A is highly expressed in NC, CP and NNE and is upregulated within a few days of differentiation preceding the expression of other lineage-restricted markers such as SOX10 and SIX1 for NC and CP, respectively (Dincer et al., 2013). Many signaling molecules have been reported to induce the expression of TFAP2A such as retinoids and activators of WNT and BMP signaling (Luo et al., 2003; Xie et al., 1998). Interestingly, under KSR conditions, none of those signaling factors were directly added during induction of the non-CNS fates despite robust TFAP2A expression (Dincer et al., 2013). Therefore, we postulated that KSR-based media could trigger endogenous signals sufficient for the induction of TFAP2A, while E6 lacks those factors. Accordingly, we attempted to restore TFAP2A expression by directly adding relevant signaling molecules.
BMP signaling has been shown to be important for the formation of NNE and Placode (Figure 1C) (Groves and LaBonne, 2014). We sought to induce the expression of TFAP2A and subsequently suppress CNS differentiation by extrinsic stimulation of BMP signaling. We observed that TFAP2A expression is rapidly upregulated within three days of treatment with BMP4 in a dose dependent manner (Figure 1D and E). At a high concentration (20ng/ml) cells become TFAP2A positive and lack the expression of SOX10 and SIX1 implying that NNE is triggered by strong BMP signaling activation (Figure 2F). Additional inhibition of the FGF pathway further blocks CP induction and thereby increases the efficiency of NNE induction (data not shown). When subjecting NNE to terminal differentiation towards keratinocytes using defined conditions, we were able to attain both immature (K14 positive) and mature (K18 positive) epidermal cells (Figure 1G). This data suggests that BMP4 signaling is able to rapidly induce non-neural ectoderm formation.
Figure 2. A BMP gradient is sufficient to derive neural crest and cranial placode cells.

A. The expression of SIX1::GFP positive placode using a gradient of BMP4 each bar within the group represents an independent replicate. B. Quantification of SIX::GFP after treating cells with FGF2 or FGF8 during the differentiation. C. Quantitative PCR of anterior markers PAX6 and SIX3 during two different time points along the differentiation. D. Immunofluorescence staining of CRYAA and CRYAB in lens placode cultures on day 30. E. Immunofluorescence staining of PAX6 positive lens placode in the absence of WNT and PAX3 positive trigeminal placodes after the addition of WNT signals. F. The expression of SOX10::GFP positive neural crest using a gradient of BMP4 each bar within the group represents an independent replicate. G. Immunofluorescence staining of differentiating cells treated with various concentrations of BMP4 with or without 600nM CHIR for 3 days. H. Immunofluorescence staining of spontaneously differentiated neural crest cells for the ability to generate ASCL1 and ISL1 neurons representing autonomic and sensory neurons, respectively. I. Calcium imaging was performed on differentiated sensory and autonomic neurons for a response to glutamate. Scale bars 50μm.
We next asked whether a three-day pulse of BMP signaling was sufficient to generate SIX1 positive placode. Indeed, the addition of BMPs triggered placode induction, but at low efficiencies (Figure 2A and S3A). Dose-response studies showed that moderate concentrations of BMP4 (around 5ng/ml) are optimal for CP induction. Intriguingly, the majority of the cells during placode differentiation resembled NNE indicating that the direct addition of FGF agonists may be necessary to boost the efficiency of placode generation at the expense of NNE. Indeed, the addition of FGF2, but not FGF8, during the differentiation enhanced the formation of SIX1 positive cells to nearly 50% (Figure 2B).
It has previously been shown that in KSR-based media the trigeminal placode is the default placode fate derived from hPSCs (Dincer et al., 2013). We terminally differentiated the SIX1 positive CP and observed expression of the anterior placode marker PAX6 and SIX3 (Figure 2C). Expression of PAX6 in placode cells is compatible with lens, pituitary or olfactory identity. Further differentiation of these cells demonstrated expression of SIX3, CRYAA and CRYAB by immunocytochemistry and suggests that the initial placode identity is likely corresponding to anterior lens rather than the posterior trigeminal placode (Figure 2D, E). Interestingly, these data are in agreement with work in the chick embryo suggesting that lens is the default placode during in vivo development (Bailey et al., 2006).
We next sought to identify factors that promote the derivation of trigeminal placode at the expense of lens placode since these factors are likely in KSR and not in E6. During development, trigeminal placode is induced posterior to the PAX6+ lens, pituitary and olfactory placode. Therefore, we tested whether activation of canonical WNT signaling, known to trigger posterior cell identity during development may be sufficient to shift patterning towards the trigeminal lineage. Exposure to an additional pulse of CHIR99021 during the early stages of differentiation, after the placode-inducing BMP treatment, was capable of triggering PAX3 positive and PAX6 negative expression in placode cells compatible with trigeminal placode fate (Figure 2E). These data show that under minimal media conditions, we were able to closely recapitulate in vivo cell fate choices and regional specification during in vitro placode induction.
Intriguingly, we also observed that activation of WNT signaling in combination with a short pulse of low dose BMP4 (1ng/ml) was capable to generate a nearly homogenous SOX10 positive NC population (Figure 2G and S3B). At this concentration of BMP4, TFAP2A is induced only weakly suggesting that NC may initially arise from early precursor cells expressing no or low levels of TFAP2A. However, the addition of both WNT and BMP act synergistically to activate TFAP2A as well as DLX3, another marker of the non-neural ectodermal fates (Figure 2H). Furthermore, the spontaneous differentiation of the NC can give rise to neurons that express ASCL1 or ISL1 which is compatible with autonomic and sensory neuron fates, respectively (Figure 2I) and the resulting neurons are functionally active upon prolonged culture (Figure 2J and S2D). The data presented here demonstrate that an early, dose-dependent induction of BMP signaling allows for the formation of the non-CNS ectoderm fates including NC several of which with greater efficiencies and lower variability than previously reported.
To address the robustness of the protocol across cell lines we assessed seven additional ES/iPSC lines and quantified yield of ectodermal lineages using validated antibodies (Supplemental Table 1). Each pluripotent stem cell line was capable of inducing appropriate markers for a particular differentiated lineage, but with varying degrees of efficiency (Figure 3A, B). Demarcation of CNS and non-CNS lineages is marked by the expression of TFAP2A. The percentages of TFAP2A+ cells ranged from 0–5% without treatment with BMP4 and 56–95% with the addition of BMP4 in the cell types tested. The generation of anterior NE from the various lines displayed efficiencies ranging from 67–95% (FOXG1) and 56–91% (PAX6). NC displayed 30–58% (SOX10) and CP displayed 10–45% (SIX1). Collectively, these data demonstrate that the defined culture conditions allow access to all the various non-neural ectoderm ectodermal fates across hPSC lines.
Figure 3. Novel differentiation strategies are applicable to a range of human embryonic and induced pluripotent stem cells.

A. Representative images used for high content imaging of validated antibodies to mark the different ectodermal lineages. B. Quantification of the percentage of positive cells during a particular differentiation. Biological replicates (n=4) and technical replicates (n=2 per biological replicate) were performed and quantified. Scale bars 50μm.
Expression analysis of purified cell types from the ectoderm
The four ectodermal lineages represent a typically transient stage during early development and obtaining large numbers of human cells at a highly defined stage is difficult. Typically, our reporter lines are utilized to distinguish a particular cell type, however PAX6 can be found in both NE and CP and SOX10 can be found in both NC and otic placodes (Taylor and Labonne, 2005). We next sought to determine transcriptional expression signatures from purified cells of each of the four ectodermal lineages. With the exception to the NNE lineage, we sorted GFP positive cells using the respective reporter lines (all lines were derived from WA-09 hESCs) and performed RNA sequencing in those purified cells. Unbiased clustering algorithms showed that NE clustered closely with hESCs, while NNE clustered the furthest apart from all other ectodermal lineages. Interestingly, based on principle component analysis, NC and CP clustered closely to each other suggesting that these cells have similar transcriptional profiles (Figure 4A and B), despite efforts in isolating pure NC and CP based on single markers such as SOX10 and SIX1 respectively. Differentially expressed genes were then grouped into those with shared and unique expression profiles (Figure 4C). Such expression patterns were further subjected to gene ontology analysis (Edgar et al., 2013) (Figure 4D). Genes associated with extracellular matrix reorganization were significantly enriched in all non-CNS derived cell types. This implies that the early BMP signal during the differentiation may act in part through ECM or at least induces cell types enriched for ECM related transcripts. Conversely, ontologies associated with NE involve synaptic transmission and nervous system development. Individual ontologies specific for NC include cell adhesion and calcium binding while CP was enriched for synaptic transmission and ion membrane transport. Taken together, the transcriptional expression profiles for the four ectodermal lineages are globally distinct and capture functions associated with each of the specific lineages represented.
Figure 4. RNA-sequencing of purified cell populations.

A. Heatmap and unbiased clustering depicting the differences in gene expression between the four ectodermal lineages. B. Principle component analysis of all samples represented in A. C. Dendrogram and heatmap of genes with two-fold differential expression compared to neuroectoderm. Clusters were then classified as all upregulated, all downregulated, neural crest specific, placode specific and non-neural ectoderm specific. D. Highest enriched gene ontology (GO) terms in all of the classified groups. E. Expression of genes specific to all ectodermal lineages and genes specific to non-CNS formation. G. Expression level of novel genes associated with NE, NC, CP or NNE.
Given the paucity of early human ectodermal lineage data, we next asked whether we could identify more specific markers for each of the ectodermal lineages. Transcripts with significant differential expression among ectodermal lineages as well as uniquely upregulated genes were subjected to further validation. Genes specifically upregulated during ectoderm differentiation that are shared between the CNS and non-CNS fates include ANXA1, LGI1, NR2F2 and ZNF503. Additionally, factors that delineate non-CNS versus CNS are NEUROG1, HAND1, TFAP2A and TFAP2B (Figure 4E). Not surprisingly, in the NE, factors such as Sox1 and Hes5 exclusively identify cells of the CNS while low-level Pax6 transcripts could be found in all other lineages (Figure 4F). Interestingly, we observed high expression of the uncharacterized zinc finger protein ZNF229 specifically in the NC lineage. As for other lineages, we identified ELAVL4 and SMYD1 to be preferentially expressed in placode and NNE, respectively (Figure 4F). Furthermore, we compared our NC dataset to a previously published study focused on identifying NC in chick (Simoes-Costa and Bronner, 2016). Of the genes significant enriched in the NC, we found significant overlap (p-value: 3.56 × 10⁻⁷) between the two datasets (reflecting key conserved NC markers (Figure S4C,D). Interestingly, some candidate markers in our study such as ZNF229 are not conserved in the mouse complicating validation studies. Nevertheless, comparative studies of our datasets, in particular for CP and NNE, would be valuable once additional, appropriate primary cell data become available.
We validated expression of selected lineage markers from the genomics analysis in the additional pluripotent stem cell lines described above. For a subset of the genes we also assessed expression by immunocytochemistry and high content imaging. We found that although, by RNA the expression several genes seemed to be present in multiple lineages, by protein analysis those markers were selectively expressed. SOX1 and ZBTB16 (PLZF) were indeed primarily enriched in the neuroectoderm while factors such as TFAP2B and HAND1 were enriched in either NC or NNE respectively (Figure S4A, B). Identity of placode was defined by the expression of SIX1 and absence of TFAP2B expression. This analysis provides a comprehensive set of both known and novel markers including several still uncharacterized genes such as ZNF229 for the specific identification of each of the major lineages during human ectoderm formation.
Loss of TFAP2A impacts the derivation of non-CNS derivatives
The novel conditions presented here to derive the four major ectodermal lineages are robust and efficient. Therefore, we used the platform to perform perturbation studies to identify key players during ectodermal lineage specification. One prime candidate in our study for commitment to non-CNS fates was TFAP2A as it is highly expressed early during induction. To address whether non-CNS lineages are dependent on TFAP2A expression, we generated TFAP2A knockout hESC lines using the CRISPR/Cas9 system. Two guide RNAs were used to induce frame shift deletions and positive clones were sequenced to determine the extent and the nature of the deletion (Figure S5A and S5B). Ablation of TFAP2A expression on the protein level was confirmed using a short 3-day induction in the presence of high BMPs (Figure 5A and S5C, D). Further comparative studies of TFAP2A versus wild type hESCs showed robust expression of E-cadherin at day 6 of differentiation in wild type but not TFAP2A knockout cells under CP or NNE conditions (Figure 5B). These data suggest that TFAP2A promotes expression of E-cadherin, which may protect cells from an EMT-like transition towards NC fates.
Figure 5. TFAP2A promotes the acquisition of non-CNS ectodermal cells.

A. Immunofluorescence of TFAP2A in wildtype and TFAP2A KO differentiating cells treated with BMP4 for 3 days. B. Analysis of E-cadherin expression during the differentiation of the four ectodermal lineages in wildtype and TFAP2A knockout lines. C. Immunofluorescence staining of PAX6 and SOX1 in wildtype and TFAP2A knockout cells during the differentiation of the ectodermal lineages. D. Quantitative PCR of the differentiation of wildtype and TFAP2A KO cells into the four ectodermal lineages. Asterisks indicate no Ct values were generated. Scale bars 50μm.
Given the E-cadherin data, we postulated that the TFAP2A knockout cells would not be able to transition towards non-CNS lineages and default towards CNS NE. In agreement with this hypothesis, the derivation of the NE was not impacted upon loss of TFAP2A (Figure 5C). CNS-enriched transcription factors such as SOX1 and PAX6 were abundant with little contamination from the other lineages. Furthermore, NC and placode protocols resulted in increased levels of SOX1 and PAX6 expression (Figure 5C and D) in TFAP2A knockout versus wild type cells. Unexpectedly, however, during the derivation of the TFAP2A KO cells towards NC or CP, SOX10 and SIX1 positive cells could be found, albeit in dramatically lower numbers compared to wild type, respectively (Figure S5E, F). This implies that either abolishing TFAP2A expression is not sufficient to suppress non-CNS cell types or other factors are able to weakly compensate and regulate SOX10 or SIX1 independently of TFAP2A. Although the effects on the loss of TFAP2A in the derivation of NC and CP were dramatic, the effect on NNE was not as pronounced. We did not observe expression of PAX6 or SOX1 in the NNE condition, and the expression of NNE related genes such as KRT16 and WISP1 were only marginally impacted (Figure 5C and S5G). These data suggest that the formation of NNE does not solely rely on TFAP2A expression. In fact, previous studies have shown that expression of TFAP2C (AP2γ) is predominant in NNE (Li and Cornell, 2007). Since NNE is the common cell type found in the NC and CP differentiations, we analyzed the expression of TFAP2C in those populations and found little to no expression (Figure S5H). This suggests that expression of TFAP2C is specific to the NNE lineage.
Our novel platform for deriving the human ectodermal lineages has demonstrated an important role for BMP signaling during ectodermal lineage specification that mimics developmental programs in vivo. Additionally, we present a proof-of-concept that the system can be genetically manipulated to uncover the role of defined developmental factors involved in determining fate choice such as TFAP2A.
Small molecule screen for factors to enhance placode formation
In addition to the molecular dissection of neural differentiation, our modular platform has the ability to generate unlimited numbers of cells with excellent yield for all four major early ectoderm lineages thus making drug screening more amenable for these difficult to isolate cell types. However, the derivation efficiency for the CP fate remained relatively low (~40%). To further enhance the efficiency of CP induction and to demonstrate the suitability of our platform in high throughput screening (HTS) assays, we performed a small molecule screen using the Library of Pharmacologically Active Compounds (LOPAC) on the Six1::H2B-GFP reporter line (Figure 6A). The initial screen unveiled 11 compounds that promoted the expression of SIX1 over controls. Based on reproducibility and robustness of the fold changes observed, the list was narrowed down to three potential candidates. These candidate compounds increased expression of SIX1 above the levels observed in control differentiations. BRL-5443 a serotonin receptor agonist; Parthenolide, a plant hormone that has the capacity to inhibit NF-κB and STAT mediated confirmation transcription; and Phenanthroline, a metal chelator that can act as a metalloprotease inhibitor (Figure 6B). Upon further validation of the primary hits, Phenanthroline was confirmed to trigger a robust increase in the percentage of cells expressing SIX1 (Figure 6C, S6A, S6B).
Figure 6. Chemical screen identifies Phenanthroline as a compound that promotes the derivation of cranial placode.

A. A schematic representation of the small molecule screen. B. All compounds with two different concentrations are plotted. Those compounds that enriched the SIX1::GFP signal were used for subsequent validation. C. Dosage gradient of Phenanthroline treatment indicate a narrow window of efficacy that supports SIX1 expression. D. Quantitative PCR analysis of lineage markers SIX1, SOX10, T, MYOD, and SOX17 with the addition of Phenanthroline. E. Quantification of SIX1::GFP positive placode treated with DMSO, Phenanthroline, FGF2, and Phenanthroline plus FGF2 after 12 days. Black spots represent each independent experiment.
Although there was no obvious link between the compound and CP development, we next determined how Phenanthroline may act on specifically enriching placode fate. Differentiation towards CP showed a five-fold increase in SIX1 expression over controls without inducing the expression of other lineage markers such as SOX10, T, MYOD or SOX17 (Figure 6D). We next assessed whether addition of Phenanthroline improved the efficiency of CP induction in an additive or selective manner. Interestingly, there is a nearly 4-fold increase (69% versus 18%) of SIX1 positive cells upon addition of Phenanthroline in the absence of FGF2 (Figure 6E). After the addition of FGF2 or FGF2 plus Phenanthroline, the enrichment of Six1 positive cells was decreased to, 34% and 46%, respectively. These results suggest that Phenanthroline may selectively enrich for SIX1 positive CP cells at the expense of other ectodermal lineages that may not be able to survive in the presence of the compound except in the presence of FGF2. In conclusion, the small molecule screen demonstrates the feasibility of using our ectodermal lineage platform to identify novel factors that can further improve the efficiency of hPSC differentiation towards lineages of choice.
Our modified approach for the modular generation under defined media conditions, i.e. E6 of the NC, CP and NNE relied on a dose-dependent BMP signaling response whereas the generation of NE was robust in either system without modification (Figure 7A) The initial pulse of BMP signaling allowed for the increased efficiencies and reduced variability in the generation of NC and to a lesser extent, CP when compared to KSR-based differentiation conditions (Figure 7B versus Figure 1D).
Figure 7. Improved efficiency and strategy in the generation of the four ectodermal lineages.

A. Quantification of all data points generated in this study. CP formation was quantified with the presence of FGF2. Each dot represents independent experiments B. General schematic of all the differentiation protocols to induce the ectoderm. Yellow demonstrates the duration of the BMP signal and purple the duration of the WNT signal during the various protocols.
Our main focus of this study was to establish a highly robust and modular ectodermal differentiation platform that eliminates the variability caused by media-related factors such as KSR. However, there are additional potential sources of variability such as coating substrate and cell density. Matrigel is a commonly used coating substrate composed of thousands of proteins whereas Vitronectin, is a single recombinant protein. To determine whether use of Matrigel instead of Vitronectin could negatively affect robustness of ectodermal lineage specification, we tested eleven batches of Matrigel in comparison to our standard Vitronectin-based protocol. Surprisingly, all but two batches yielded highly robust induction efficiencies (Figure S7A). Another potential factor known to affect ectodermal lineage choice is cell density. Namely, the generation of PAX6 positive NE versus SOX10 positive NC was shown to depend on the starting hPSC plating density (Chambers et al., 2009). We performed differentiations using 50,000 to 300,000 cells/cm2 using both Matrigel and Vitronectin (Figure S7B) and found that cell density did not play an obvious role in cell fate determination Finally, growth factors such as recombinant BMP4 can exhibit technical variability in potency. To address this concern, the effective dose of BMP4 can be titrated by determining the threshold concentration required to activate TFAP2A. BMP4 titration should prove useful for the generation of the various non-CNS lineages where low levels of TFAP2A generate NC (in combination with WNT activation) while moderate levels of promote CP and NNE fates. In conclusion, our data illustrate the robustness our differentiation platform that shows minimal dependence on coating substrate or cell density for acquisition of the four key ectodermal lineages.
DISCUSSION
The goal of deriving a multitude of specific cell types on demand from hPSCs is dependent on the availability of a suitable differentiation platform. Currently available protocols often use undefined media components prone to introducing variability and not suitable for ultimate clinical translation. Furthermore, such protocols offer access to only individual ectodermal lineages under conditions that each vary in cell density, in the use of embryoid body (EB)- versus monolayer cultures and in the application of a broad range of media composition. Therefore, in past studies it was nearly impossible to define the impact of a specific genetic or chemical perturbation across all four lineages given the large number of confounding factors that differed for each lineage-specific protocol.
Here, we present a strategy to derive all four major ectodermal lineages using a robust, modular and chemically defined system. The application of in vivo developmental cues greatly enhances the success of differentiation in this system, and we show that the modulation of four signaling pathways is sufficient to recreate the full diversity of early ectodermal lineage choice. The delineation of CNS versus non-CNS fates relies on the dose-dependent treatment with BMPs. The specific BMP concentration to promote any specific lineage such as NC, CP and NNE is very precise. BMPs act at least in part via upregulating TFAP2A that can work in concert with WNT activation to generate NC, with FGF activation to generate CP and with FGF inhibition to generate NNE. Our results demonstrate that in a minimal media system, one can recapitulate ectodermal cell fate decision by mimicking in vivo development using a handful of small molecules. The resulting system is technically simple and yields a near homogenous population of specific ectodermal lineages that does not need additional sorting or selection. Beyond improving reproducibility and technical ease, the use of highly defined media such as E6 will greatly facilitate the production of clinical grade cells for future translational applications.
We demonstrate that the ectodermal differentiation platform is amenable for genetic dissection of developmental pathways as well as small molecule screening. In our proof-of-concept study we demonstrate that the loss of TFAP2A does not affect the formation of NE or NNE, but greatly affects the derivation of NC and CP fates. Our data are in agreement with reports in TFAP2A knockout mice that display perinatal lethality with neural tube defects and defects in sensory organ development, yet non-neural fates were not affected (Schorle et al., 1996). There is likely compensation for TFAP2A loss via other TFAP proteins such as TFAP2C (Li and Cornell, 2007). Preliminary data suggest that TFAP2C is not upregulated during any of the ectodermal differentiations. However, TFAP2B was strongly upregulated suggesting a possible compensatory function in the formation of non-neural ectoderm.
The use of our differentiation platform in small molecule screens could involve the identification of compounds for the directed differentiation towards particular region-specific precursor populations or specific classes of neurons. Here, we have demonstrated the feasibility of performing such a screen for the enrichment of the placode lineage. While our defined differentiation platform was significantly more efficient in generating NC or NNE lineages, even compared to conditions that used optimized KSR lots (Fig. S1G, Fig. 7B), the efficiency of deriving SIX1+ CP precursors was not improved. However, in the presence phenanthroline (Fig. 6E), the main hit compound in our small molecule screen; we were able to trigger CP marker expression in the large majority of cells. The mechanism by which Phenanthroline acts remains to be determined. However, the data suggest that this drug primarily acts via positive selection of SIX1+ cells. Future studies will be required to address the mechanism of action for Phenanthroline during placode development and subtype specification.
We envisage that beyond the derivation of the four major ectodermal lineages, the next step will be the systematic derivation of regionally biased lineages as illustrated in the switch from a PAX6+ lens to a PAX3+ trigeminal placode. The ability of generating regional specific CNS lineages is well known in the field and similar strategies are currently under development for generating specific NC lineages such as the switch from the default cranial to vagal and enteric NC (Fattahi et al., 2016). The final step in a human ectodermal lineage project will be the induction, isolation and molecular characterization of the various neural and non-neuronal subtypes generated from each region specific ectodermal lineage. The goal of developing systematic differentiation conditions for each germ-layer is further illustrated by a recent effort at recreating mesodermal lineage diversity from human PSCs (Loh et al., 2016). Combining such germ-layer specific efforts may ultimately yield a uniform platform to access any human cell type on demand.
In conclusion, our study offers a resource for the field that represents a blueprint for generating ectodermal lineage diversity and the dissection of molecular pathways involved in development of the four major ectodermal lineages in parallel. The study lays the foundation for many potential applications; including mechanistic studies for understanding the molecular mechanisms associated with cell fate decisions such as determining optimal chromatin stages for regional patterning and terminal fate specification. It also sets the stage for deriving a broad range of ectodermal lineages under conditions suitable for future clinical translation including applications aimed at developing novel cell therapies for human disorders.
CONTACT FOR REAGENT AND RESOURCE SHARING
Further information and requests for reagents may be directed to the Lead Contact, Lorenz Studer (studerl@mskcc.org).
EXPERIMENTAL MODEL AND SUBJECT DETAILS
Human embryonic stem cell (hESC) lines H9 (XX, p31–40), H1 (XY, p35–40), MEL1 (XY, p40–46), HUES6 (XX, p25–35), HUES8 (XY, p64–68) and induced pluripotent stem cell (iPSC) lines BJ1, Sev6 and MRC5 were cultured on a mouse embryonic feeder layer in hESC media containing DMEM-F12, non-essential amino acids, L-glutamine, 20% knockout serum replacement (KSR) and 10ng/ml FGF2. The PAX6 H2B::GFP, SOX10 GFP and SIX1 H2B::GFP parental line is H9. Cells were adapted to Essential 8 (E8, Thermo Fisher Scientific) by dissociating the pluripotent stem cells with 0.5mM EDTA and plating them on Vitronectin coated dishes. Lines that did not initially adapt well were thrown out and attempted again on Matrigel coated dishes and transitioned to Vitronectin at the next passage. Cells were considered adapted after 3–4 weeks of culture (~6–8 passages). All cells were cultured at 37C with 5% CO2. Media was changed every day. All cell lines are periodically authenticated using STR analysis, periodically tested for karyotype abnormalities, and routinely checked for mycoplasma.
METHOD DETAILS
Experimental Design
To ensure the reproducibility of the differentiation strategies provided, several members of the Studer lab independently performed particular aspects of the chemically defined ectodermal differentiations and all of them are currently used in the laboratory. No specific methods were used for randomization ad investigators were not blinded to the methods of differentiation. No statistical methods were utilized to determine sample size.
Differentiation Nomenclature and timing
For both types of differentiation (KSR and E6) based, a set of abbreviations and timing are used listed in a table below:
Small molecule abbreviations
| Small molecule | Abbreviation |
|---|---|
| LDN193189 | LDN |
| SB431542 | SB |
| Y-27632 | ROCKi |
| XAV939 | XAV |
| CHIR99021 | CHIR |
| SU5402 | SU |
Differentiation days relative to time of exposure
| Day | Duration (hrs) |
|---|---|
| Day 0 | 0–24 |
| Day 1 | 24–48 |
| Day 2 | 48–72 |
| Day 3 | 72–96 |
| Day 4 | 96–120 |
| Day 5 | 120–144 |
| Day 6 | 144–168 |
| Day 7 | 168–192 |
| Day 8 | 192–216 |
| Day 9 | 216–240 |
| Day 10 | 240–264 |
| Day 11 | 264–288 |
KSR based differentiation (10–12 days)
Differentiation days relative to media gradient
| % KSR differentiation media | % N2 media |
|---|---|
| 100 | 0 |
| 100 | 0 |
| 100 | 0 |
| 100 | 0 |
| 75 | 25 |
| 75 | 25 |
| 50 | 50 |
| 50 | 50 |
| 25 | 75 |
| 25 | 75 |
| 0 | 100 |
| 0 | 100 |
Preparation before start of differentiation
Dilute Matrigel (1:50) with DMEMF12 base media and coat tissue culture treated dishes. Parafilm and store dishes at 4 degrees overnight.
Media composition (found in the STAR resources table)
KSR differentiation media (1L)
820ml Knockout DMEM (1X) medium
150ml Knockout Serum Replacement
10ml Pen Strep
10ml L-Glutamine 200mM
10ml MEM Non-Essential Amino Acids 100x
1 ml 2-mercaptoethanol 1000x
N2 media (1L)
1L DMEM/F12 (1:1) 1X medium
1ml 2-mercaptoethanol 1000x
2.0g Sodium Bicarbonate
1.56g D-(+)- Glucose
20ul progesterone (Stock: dissolve 0.032g Progesterone in 100ml 100% ethanol)
Add 10ml N2 supplement B 100x
Day -1 of differentiation
hPSC culture should be 70–80% confluent before beginning differentiation. Detach cells with Accutase dissociation buffer (30 minutes at 37 degrees C) and gently dissociate the cells off the plate. Pass the cells through a 45-micron cell strainer and pellet the cells (200 x g for 5 minutes). Wash cells gently with PBS and pellet again. Plate 250-300,000 cells per cm2 in hESC medium with 10μM ROCKi. Incubate the cells overnight in 37 degrees C incubator.
Day 0 of differentiation
hPSCs should be appear as a high density monolayer. No plastic should be visible. Wash cells with PBS or KSR differentiation media before starting the particular differentiation below:
A. Neuroectoderm differentiation
Day 0 (0–24hrs) Add KSR differentiation media containing 500nM LDN + 10μM SB to cells. To skew the differentiation more toward an anterior neuroectoderm, add KSR differentiation media containing 500nM LDN + 10μM SB + 5μM XAV to cells.
Day 1 (24–48hrs) Change media to KSR differentiation media containing 500nM LDN + 10μM SB to cells. If differentiating toward an anterior neuroectoderm, maintain KSR differentiation media containing 500nM LDN + 10μM SB + 5μM XAV to cells.
Day 2 (48–72hrs) Change media to KSR differentiation media containing 500nM LDN + 10μM SB to cells. If differentiating toward an anterior neuroectoderm, maintain KSR differentiation media containing 500nM LDN + 10μM SB + 5μM XAV to cells.
Day 3 (72–96hrs) Change media to KSR differentiation media containing 500nM LDN + 10μM SB to cells. If differentiating toward an anterior neuroectoderm, maintain KSR differentiation media containing 500nM LDN + 10μM SB + 5μM XAV to cells.
Day 4 (96–120hrs) Change media to 75% KSR differentiation media and 25% N2 media containing 500nM LDN + 10μM SB to cells. If differentiating toward an anterior neuroectoderm, 75% KSR differentiation media and 25% N2 media containing 500nM LDN + 10μM SB + 5μM XAV to cells.
Day 5 (120–144hrs) Change media to 75% KSR differentiation media and 25% N2 media containing 500nM LDN + 10μM SB to cells. If differentiating toward an anterior neuroectoderm, remove XAV and continue treating cells with 75% KSR differentiation media and 25% N2 media 500nM LDN + 10μM SB.
Day 6–11 Change media every day following the media gradient containing 500nM LDN + 10μM SB.
B. Neural Crest differentiation
Day 0 (0–24hrs) Add KSR differentiation media containing 500nM LDN + 10μM SB to cells.
Day 1 (24–48hrs) Change media with KSR differentiation media containing 500nM LDN + 10μM SB to cells + 3μM CHIR to cells.
Day 2–11 Change media every other day with media gradient containing 10μM SB + 3μM CHIR to cells.
C. Trigeminal Placode differentiation
Day 0 (0–24hrs) Add KSR differentiation media containing 500nM LDN +10μM SB to cells.
Day 1 (24–48hrs) Change media with KSR differentiation media containing 500nM LDN + 10μM SB to cells.
Day 2 (48–72hrs) Change media with KSR differentiation media containing 10μM SB to cells.
Day 3–11 Change media every other day with media gradient containing 10μM SB to cells.
E. Non-neural ectoderm differentiation
Day 0 (0–24hrs) Add KSR differentiation media containing 500nM LDN + 10μM SB to cells.
Day 1 (24–48hrs) Change media with KSR differentiation media containing 500nM LDN + 10μM SB to cells.
Day 2 (48–72hrs) Change media with KSR differentiation media containing 500nM LDN + 10μM SB to cells.
Day 3–11 Change media every other day with media gradient containing 10μM SB + 10μM SU to cells.
Essential 6 based differentiation (10–12 days)
Preparation before start of differentiation
Dilute Matrigel (1:50) with DMEMF12 base media or Vitronectin (1:100) with PBS and coat tissue culture treated dishes. Parafilm and store dishes at 4 degrees overnight.
Day -1 of differentiation
hPSC culture should be 70–80% confluent before beginning differentiation. Detach cells with EDTA dissociation buffer (5 minutes at 37 degrees C) and gently dissociate the cells off the plate. Pass the cells through a 45-micron cell strainer and pellet the cells (200 x g for 5 minutes). Wash cells gently with PBS and pellet again. Plate 250–300,000 cells per cm2 in E8 medium with 10μM ROCKi. Incubate the cells overnight in 37 degrees C incubator.
Day 0 of differentiation
hPSCs should be appear as a high density monolayer. No plastic should be visible. Wash cells with PBS or E6 media before starting the particular differentiation below:
A. Neuroectoderm differentiation
Day 0 (0–24hrs) Add E6 media containing 500nM LDN + 10μM SB to cells. To skew the differentiation more toward an anterior neuroectoderm, add E6 media containing 500nM LDN + 10μM SB + 5μM XAV to cells.
Day 3 (72–96hrs) Change media to E6 media containing 500nM LDN + 10μM SB to cells. If differentiating toward an anterior neuroectoderm, remove XAV and continue treating cells with 500nM LDN + 10μM SB.
Day 4–12 Change media every other day with E6 media containing 500nM LDN + 10μM SB.
B. Neural Crest differentiation
Day 0 (0–24hrs) Add E6 media containing 1ng/ml BMP4 + 10μM SB + 600nM CHIR to cells.
Day 1 (24–48hrs) Change media with E6 media containing 1ng/ml BMP4 + 10μM SB + 600nM CHIR to cells.
Day 2 (48–72hrs) Change media with E6 media containing 1ng/ml BMP4 + 10μM SB + 600nM CHIR to cells.
Day 3 (72–96hrs) Change media with E6 media containing 10μM SB + 1.5μM CHIR to cells.
Day 4–12 Change media every other day with E6 media containing 10μM SB + 1.5μM CHIR to cells
C. Cranial Placode differentiation
Day 0 (0–24hrs) Add E6 media containing 5ng/ml BMP4 + 10μM SB to cells.
Day 1 (24–48hrs) Change media with E6 media containing 5ng/ml BMP4 + 10μM SB to cells.
Day 2 (48–72hrs) Change media with E6 media containing 5ng/ml BMP4 + 10μM SB to cells.
Day 3 (72–96hrs) Change media with E6 media containing 10μM SB + 50ng/ml FGF2 to cells.
Day 4–12 Change media every day with E6 media containing 10μM SB + 50ng/ml FGF2 to cells
D. Trigeminal Placode differentiation
Day 0 (0–24hrs) Add E6 media containing 5ng/ml BMP4 + 10μM SB to cells.
Day 1 (24–48hrs) Change media with E6 media containing 5ng/ml BMP4 + 10μM SB to cells.
Day 2 (48–72hrs) Change media with E6 media containing 5ng/ml BMP4 + 10μM SB + 600nM CHIR to cells.
Day 3 (72–96hrs) Change media with E6 media containing 10μM SB + 600nM CHIR to cells.
Day 4 (96–120hrs) Change media with E6 media containing 10μM SB
Day 5–12 Change media every day with E6 media containing 10μM SB to cells.
E. Non-neural ectoderm differentiation
Day 0 (0–24hrs) Add E6 media containing 10ng/ml BMP4 + 10μM SB + 10μM SU to cells.
Day 1 (24–48hrs) Change media with E6 media containing 10ng/ml BMP4 + 10μM SB + 10μM SU to cells.
Day 2–12 Change media every other day with E6 media containing 5ng/ml BMP4 + 10μM SB to cells.
Differentiation of progenitor cells from the ectodermal lineages
NE differentiation into neurons
Starting at d10, cultures are maintained an extra 10 days in N2 media with B27 supplement and dissociated with Accutase, passed through a 0.45-micron cell strainer and the cells were washed 2 times in media or PBS. Cells were seeded at low density ~50K cells/cm2 in Neuron differentiation media (Neurobasal, B27, BDNF, AA, GDNF with 10μM DAPT). DAPT is removed when the cultures look neuronal (~5–6 days).
NC differentiation into sensory and autonomic neurons
Differentiated neural crest cells were dissociated at d10 with Accutase and resuspended at 2 million/ml in Neurobasal media supplemented with N2, B27, FGF2 (10ng/ml) and CHIR99021 (3mM). Cell suspension is transferred to ultra low attachment plates for suspension culture to form NC spheres. Spheres are maintained in Neurobasal media supplemented with N2, B27, FGF2 (10ng/ml) and CHIR99021 (3mM) until d15, then plated at a 1:1 ratio on PO/LM/FN coated plates in Neurobasal media supplemented with N2, B27 and GDNF (10ng/ml) to spontaneously differentiate into sensory and autonomic neurons.
CP differentiation into lens placode and trigeminal neurons
Lens placode: Starting at d10, cranial placode cultures where maintained an extra 10 days in E6 with 10 μM SB431542. Starting at d20, SB431542 was removed from the medium and cultures where maintained in E6 only for the rest of the differentiation. Medium was changed 3 times a week (Monday, Wednesday, Friday).
Trigeminal neurons: On d10, trigeminal placode clusters were manually picked using a 200μl pipette. Picked clusters were transferred to N2 media with B27 supplement, 10 μM DAPT, BDNF, GDNF, NGF and AA). Approximately 10–20 clusters/cm2 were plated on Matrigel. Medium was changed 3 times a week (Monday, Wednesday, Friday).
NNE differentiation into keratinocytes
On d10 of differentiation, cells were dissociated using Accutase, passed through a 0.45-micron cell strainer and the cells were washed once in media or PBS. Cells were passaged 1:2 onto cell culture plastic previously coated using the Coating Matrix Kit Protein according to the manufacturers specification in E6 with 10μM SB431542, 10ng/ml BMP4 and 10μM SU5402. After 2 days, medium was changed to 75% Essential6/25% EpiLife with S7 supplement. After additional 2 days medium was changed to 50% Essential6/50% EpiLife with S7 supplement. 2 days later medium was changed to 25% Essential6/75% EpiLife with S7 supplement. Another 2 days later medium was changed to 100% EpiLife with S7 supplement. From now on medium (EpiLife with S7 supplement) was changed 3 times a week (Monday, Wednesday, Friday).
Generation of the Pax6 and Six1 H2B GFP reporter lines
Donor plasmids were constructed and cloned into pUC19 using the Infusion Cloning System (Clontech). TALEN sequences were predicted using the TAL Effector Nucleotide Targeter software (Cermak et al., 2011; Doyle et al., 2012). Pax6 TALENS: TGTCCTGTATTGTACCACT and TGTATACAAAGGTCCTTGT SIX1 TALENS: TCTCTGCTCGGCCCCCTCA and TTGGGGTCCTAAGTGGGGA. TALENs were generated using the TALEN Toolbox (Addgene) (Sanjana et al., 2012) and performed as described. The donor plasmid (20ug) and TALEN pairs (5ug each) were nucleofected (Lonza Kit V using the B-016 program) into H9 hESCs (passage 32–36). Nucleofected cells were seeded onto a MEF feeder layer in KSR media plus 10μM ROCK inhibitor. After 48 hours, puromycin (1μg/ml) was added to select for positive clones. Puromycin resistant colonies were then isolated, genomic DNA was extracted and targeting was confirmed using PCR. Further validation included directed differentiation and co-labeling GFP with either PAX6 or SIX1 antibody.
Generation of a TFAP2A knockout hESC line
The CRISPR/Cas9 system was used to generate the knockout hESC lines. Briefly, two guide RNAs were predicted using the CRISPR design tool (Cong et al., 2013) and cloned into the TOPO-Blunt vector. Cas9-GFP (5ug) and both guide RNAs (1ug each) were nucleofected into H9 hESCs (Lonza Kit V using the B-016 program) and seeded on a Matrigel coated dish in KSR media with ROCK inhibitor. After 24 hours, the cells were sorted for GFP and seeded on a MEF feeder layer in KSR media with ROCK inhibitor. Colonies were then isolated and the targeted region of TFAP2A was amplified by PCR and cloned into the TOPO TA vector and sequenced to identify frame shift mutants.
High content image analysis
Human embryonic (H9, H1, HUES8, HUES6 and MEL1) and induced pluripotent stem cells (BJ1, MRC5 and SeV6) were adapted in the Essential 8 media for a minimum of 4 passages (~ 2 weeks) and induced to differentiate into the four ectodermal lineages. Bulk differentiations were dissociated using Accutase for 30 minutes at 37C at day 10 of differentiation and seeded in 96 well imaging plates. Cells were fixed two days later using 4% paraformaldehyde and permeabilized using 0.5% Triton-X and maintained in 0.2% Tween. Cells were then stained using antibodies against various markers indicative of the ectodermal lineages. Plates were scanned and measurements recorded using an IN Cell Analyzer 6000 (GE) and quantified using the Columbus image analysis software (PerkinElmer). Experiments involving these cell lines were biologically replicated (n=4) and technically replicated (n=2 per biological replicate).
RNA sequencing and analysis
Total RNA (Trizol) was isolated from GFP sorted cells (NE, NC and CP) or in bulk (NNE) at day 12 of differentiation in at least duplicates. RNA sequencing libraries underwent ribosome depletion and roughly sixty million reads were generated and aligned to hg19 using Tophat v1.2 (Trapnell et al., 2012). Reads were then counted using HTseq (Anders et al., 2015) and differentially expressed genes were calculated using DESeq (Anders and Huber, 2010). Differentially expressed groups analyzed for their gene ontology classification and signaling pathway enrichment using LifeMap Gene Analytics (Edgar et al., 2013). Resulting RNA sequencing datasets are uploaded to GEO (GSE101661) and significant differentially expressed gene sets are in Supplemental Table 1.
Small molecule screen for enhancers of placode fate
H9 SIX1 H2B::GFP cells were differentiated into lens placode as described earlier and plated on 96 well plates coated with Matrigel. On day 3 (day before SIX1 H2B::GFP can be detected in individual cells) the medium was additionally supplemented with compounds from the LOPAC library. 2 different concentrations (1 μM and 10 μM) per compound were used. Medium was not changed until day 6 of differentiation. On day 6 of differentiation plates were washed once with PBS and cells were fixed with 4% PFA. To increase the signal intensity over background, the cells were stained using an antibody against GFP. After labeling with an appropriate Alexa488-conjugated secondary antibody and the nuclear counterstain DAPI, cells were analyzed using the Meta Express software (Metamorph) by calculating the percent nuclear GFP signal over DAPI positive cells.
Calcium Imaging of cortical and sensory neurons
Cortical neurons derived from NE and sensory neurons derived from NC (described above) were plated on Ibidi plates coated with Poly-ornithine, Laminin and Fibronectin. The cells were loaded with 2 μmol/L Fluo-4 AM dissolved in 1:1 (v/v) amount of 20% Pluronic®-F127 and DMSO with stock concentration of 1 mmol/L for 45 min at RT in Tyrode solution consisting of (mmol/L): 140 NaCl, 5.4 KCl, 1 MgCl2, 1.8 CaCl2, 10 glucose and 10 HEPES at pH 7.4. The calcium transients in the cells were recorded on a heated stage using an inverted wide field imaging system (Zeiss AxioObserver Inverted Wide field/Fluorescence Microscope) at intervals of 250 ms (4 frames per second). The regions of interest (ROIs) were then quantified as the background subtracted fluorescence intensity changes normalized to the background subtracted baseline fluorescence using MetaXpress software.
QUANTIFICATION AND STATISTICAL ANALYSIS
During the development of the strategies to derive the various ectodermal lineages, over 80 differentiations (biological and technical) were performed to assess reproducibility and robustness of the protocols by FACS analysis for the lineage specific GFP. All the data is plotted in the boxplots represented for that particular experiment. Specifically, Figure 1E (n=3), Figure 2A, G (n=3), Figure 2B (n=2), Figure 3 (n=2 biological replicates, n=4 technical replicates), Figure 6C (n=3), Figure 6D (n=2), Figure 6E (n=6) and Figure 7A (n=8). Supplemental Figure 1H (n=5 biological, n=2 technical), Supplemental Figure 4 (n=2 biological replicates, n=4 technical replicates), Supplemental Figure 6 (n=3), Supplemental Figure 7 (n=3).
DATA AND SOFTWARE AVAILABILITY
The RNA sequencing data generated in this paper is uploaded to GEO with accession number GSE101661. This dataset includes the counts-table output from HTSeq and quantification of fold changes of each cell type compared to the starting hESCs.
KEY RESOURCES TABLE
The table highlights the genetically modified organisms and strains, cell lines, reagents, software, and source data essential to reproduce results presented in the manuscript. Depending on the nature of the study, this may include standard laboratory materials (i.e., food chow for metabolism studies), but the Table is not meant to be comprehensive list of all materials and resources used (e.g., essential chemicals such as SDS, sucrose, or standard culture media don’t need to be listed in the Table). Items in the Table must also be reported in the Method Details section within the context of their use. The number of primers and RNA sequences that may be listed in the Table is restricted to no more than ten each. If there are more than ten primers or RNA sequences to report, please provide this information as a supplementary document and reference this file (e.g., See Table S1 for XX) in the Key Resources Table.
Please note that ALL references cited in the Key Resources Table must be included in the References list. Please report the information as follows:
REAGENT or RESOURCE: Provide full descriptive name of the item so that it can be identified and linked with its description in the manuscript (e.g., provide version number for software, host source for antibody, strain name). In the Experimental Models section, please include all models used in the paper and describe each line/strain as: model organism: name used for strain/line in paper: genotype. (i.e., Mouse: OXTRfl/fl: B6.129(SJL)-Oxtrtm1.1Wsy/J). In the Biological Samples section, please list all samples obtained from commercial sources or biological repositories. Please note that software mentioned in the Methods Details or Data and Software Availability section needs to be also included in the table. See the sample Table at the end of this document for examples of how to report reagents.
SOURCE: Report the company, manufacturer, or individual that provided the item or where the item can obtained (e.g., stock center or repository). For materials distributed by Addgene, please cite the article describing the plasmid and include “Addgene” as part of the identifier. If an item is from another lab, please include the name of the principal investigator and a citation if it has been previously published. If the material is being reported for the first time in the current paper, please indicate as “this paper.” For software, please provide the company name if it is commercially available or cite the paper in which it has been initially described.
-
IDENTIFIER: Include catalog numbers (entered in the column as “Cat#” followed by the number, e.g., Cat#3879S). Where available, please include unique entities such as RRIDs, Model Organism Database numbers, accession numbers, and PDB or CAS IDs. For antibodies, if applicable and available, please also include the lot number or clone identity. For software or data resources, please include the URL where the resource can be downloaded. Please ensure accuracy of the identifiers, as they are essential for generation of hyperlinks to external sources when available. Please see the Elsevier list of Data Repositories with automated bidirectional linking for details. When listing more than one identifier for the same item, use semicolons to separate them (e.g. Cat#3879S; RRID: AB_2255011). If an identifier is not available, please enter “N/A” in the column.
A NOTE ABOUT RRIDs: We highly recommend using RRIDs as the identifier (in particular for antibodies and organisms, but also for software tools and databases). For more details on how to obtain or generate an RRID for existing or newly generated resources, please visit the RII or search for RRIDs.
Please use the empty table that follows to organize the information in the sections defined by the subheading, skipping sections not relevant to your study. Please do not add subheadings. To add a row, place the cursor at the end of the row above where you would like to add the row, just outside the right border of the table. Then press the ENTER key to add the row. You do not need to delete empty rows. Each entry must be on a separate row; do not list multiple items in a single table cell. Please see the sample table at the end of this document for examples of how reagents should be cited.
KEY RESOURCES TABLE.
| REAGENT or RESOURCE | SOURCE | IDENTIFIER |
|---|---|---|
| Antibodies | ||
| Rabbit Anti-PAX6 | Biolegend | 901301, RRID: AB_256503 |
| Goat Anti-SOX10 | Santa Cruz | sc-17342, RRID: AB_2195374 |
| Rabbit Anti-SIX1 | Sigma Aldrich | HPA001893, RRID: AB_611788 |
| Mouse Anti-TFAP2A | DSHB | 3B5, RRID: AB_2313948 |
| Rabbit Anti-TFAP2A (western blot) | Abcam | ab108311, RRID: AB_10861200 |
| Goat Anti-SOX2 | Santa Cruz | sc-17320, RRID: AB_2286684 |
| Rabbit Anti-SOX2 | Biolegend | 630802, RRID:AB_2195784 |
| Mouse Anti-PAX6 | BD Biosciences | 561462, RRID:AB_10715442 |
| Rabbit Anti-HAND1 | Sigma Aldrich | HPA040925, RRID:AB_10796126 |
| Goat Anti-SOX1 | R&D | AF3369, RRID:AB_2239879 |
| Mouse Anti-OCT4 | Santa Cruz | sc-5279, RRID:AB_628051 |
| Mouse Anti-ZO-1 | BD Biosciences | 610966, RRID:AB_398279 |
| Mouse Anti-PLZF | R&D | MAB2944, RRID:AB_10718564 |
| Mouse Anti-TFAP2B | Sigma Aldrich | SAB1404460, RRID:AB_10738939 |
| Rabbit Anti-DLX3 | Santa Cruz | sc-98522, RRID:AB_2090691 |
| Rabbit Anti-TFAP2C | Sigma Aldrich | HPA055179, RRID:AB_2686902 |
| Rabbit Anti-K14 | Gift from T.Oro | |
| Rabbit Anti-K18 | Gift from T.Oro | |
| Mouse Anti-CRYAA | OriGene | CF505577, RRID: AB_2623199 |
| Mouse Anti-CRYAB | OriGene | CF500680, RRID: AB_11125660 |
| Chicken Anti-βIII-Tubulin (TUJ1) | Abcam | ab107216, RRID:AB_10899689 |
| Mouse Anti-ISL1 | DSHB | 39.4D5, RRID:AB_2314683 |
| Mouse Anti-ASCL1 | BD Biosciences | 556604, RRID:AB_396479 |
| Mouse Anti-Nestin | Neuromics | MO15012-100, RRID:AB_2148919 |
| Goat Anti-OTX2 | Neuromics | GT15095-100, RRID:AB_2157174 |
| Rabbit Anti-E-Cadherin | Cell Signaling Technologies | 3195, RRID:AB_2291471 |
| Chicken Anti-GFP | Abcam | ab13970, RRID:AB_300798 |
| AlexaFluor Donkey Anti-Goat 488 | Thermo Fisher Scientific | A-11055, RRID:AB_2534102 |
| AlexaFluor Donkey Anti-Goat 568 | Thermo Fisher Scientific | A-11057, RRID:AB_142581 |
| AlexaFluor Donkey Anti-Goat 647 | Thermo Fisher Scientific | A-21447, RRID:AB_141844 |
| AlexaFluor Donkey Anti-Rabbit 488 | Thermo Fisher Scientific | A-21206, RRID:AB_141708 |
| AlexaFluor Donkey Anti-Rabbit 555 | Thermo Fisher Scientific | A-31572, RRID:AB_162543 |
| AlexaFluor Donkey Anti-Rabbit 647 | Thermo Fisher Scientific | A-31573, RRID:AB_2536183 |
| AlexaFluor Donkey Anti-Mouse 488 | Thermo Fisher Scientific | R37114, RRID:AB_2556542 |
| AlexaFluor Donkey Anti-Mouse 555 | Thermo Fisher Scientific | A-31570, RRID:AB_2536180 |
| AlexaFluor Donkey Anti-Mouse 647 | Thermo Fisher Scientific | A-21235, RRID:AB_141693 |
| Bacterial and Virus Strains | ||
| Biological Samples | ||
| Chemicals, Peptides, and Recombinant Proteins | ||
| Knockout DMEM | Thermo Fisher Scientific | 10829-018 |
| DMEM-F12 w high glucose | Thermo Fisher Scientific | 11320-033 |
| Neurobasal | Thermo Fisher Scientific | 21103-049 |
| L-Glutamine (100X) | Thermo Fisher Scientific | 25030-081 |
| Non-essential Amino Acids (100X) | Thermo Fisher Scientific | 11140-050 |
| Penicillin Streptomycin | Thermo Fisher Scientific | 15140-122 |
| 2-mercaptoethanol | Thermo Fisher Scientific | 21985-023 |
| Sodium Bicarbonate | Sigma Aldrich | S5761 |
| D-(+)- Glucose | Sigma Aldrich | G7021 |
| Progesterone | Sigma Aldrich | P8783 |
| Recombinant human FGF2 | R&D | 233-FB-001MG/CF |
| Recombinant human BMP4 | R&D | 314-BP-010 |
| CHIR99021 (CHIR) | R&D | 4423 |
| Y-27632 (ROCKi) | R&D | 1254 |
| SB431542 (SB) | R&D | 1614 |
| LDN193189 (LDN) | Stemgent | 04-0074 |
| XAV-939 (XAV) | R&D | 3746 |
| SU-5402 (SU) | Biovision | 1645-1 |
| Brain derived neurotrophic factor | R&D | 248-BD |
| Glial derived neurotrophic factor | Peprotech | 450-10 |
| Ascrobic Acid (AA) | Sigma Aldrich | 4034-100g |
| DAPT | R&D | 2634 |
| Poly-L-Ornithine (PO) | Sigma Aldrich | P3655 |
| Mouse Laminin I (LAM) | R&D | 3400-010-1 |
| Fibronectin (FN) | Thermo Fisher Scientific | 356008 |
| Essential 8 (E8) | Thermo Fisher Scientific | A1517001 |
| Essential 6 (E6) | Thermo Fisher Scientific | A1516401 |
| 0.5M EDTA, pH 8.0 | Thermo Fisher Scientific | 15575020 |
| Accutase | Innovative Cell Technologies | AT104-500 |
| Fluo4-AM | Thermo Fisher Scientific | F14201 |
| BRL 54443 maleate salt | Sigma Aldrich | B173 |
| Pathenolide | Sigma Aldrich | P0667 |
| 1,10-Phenanthroline | Sigma Aldrich | 131377 |
| 50X B27 supplement w/o Vit A | Thermo Fisher Scientific | 17504044 |
| N2 supplement B | Stem Cell Technologies | 07156 |
| EpiLife Basal medium | Thermo Fisher Scientific | MEPI500CA |
| Supplement S7 | Thermo Fisher Scientific | S0175 |
| Critical Commercial Assays | ||
| RNeasy Mini Kit | Qiagen | 74104 |
| SsoFast™ EvaGreen® Supermix | Bio-Rad | 172-5202 |
| iScript™ Reverse Transcription Supermix | Bio-Rad | 170-8841 |
| TOPO TA cloning Kit | Thermo | K450001 |
| Deposited Data | ||
| RNA-Seq | This study | NCBI GEO: GSE101661 |
| RNA-Seq expression changes | This study | Table S1 |
| Experimental Models: Cell Lines | ||
| H9 (WA-09) hESC line | WiCell Research Institute | NIHhESC-10-0062 |
| H1 (WA-01) hESC line | WiCell Research Institute | NIHhESC-10-0043 |
| MEL-1 hESC line | Stem Cells Ltd | NIHhESC-11-0139 |
| HUES 6 hESC line | HSCI iPS Core | NIHhESC-09-0019 |
| HUES 8 hESC line | HSCI iPS Core | NIHhESC-09-0021 |
| BJ1 iPSC line | HSCI iPS Core | Felgentreff et al 2014 |
| MRC5 iPSC line | MSKCC Stem Cell Core | Miller et al 2013 |
| SeV6 iPSC line | MSKCC Stem Cell Core | Kriks et al 2011 |
| Experimental Models: Organisms/Strains | ||
| Oligonucleotides | ||
| TFAP2A guide 1 (AP2A-88) | This study | GGAGTAAGGATCTTGCGACT |
| TFAP2A guide 2 (AP2A-92) | This study | AGTAAGGATCTTGCGACTGG |
| Recombinant DNA | ||
| pCas9_GFP | Addgene: 44719 | |
| Software and Algorithms | ||
| Tophat | https://ccb.jhu.edu/software/tophat/index.shtml | |
| HTSeq | http://htseq.readthedocs.io/en/release_0.9.0/ | |
| DESeq | http://www-huber.embl.de/users/anders/DESeq/ | |
| R | https://cran.r-project.org/ | |
Supplementary Material
Data are provided as Reads per Kilobase per Million mapped reads (RPKM), fold changes and fold changes in log2 for each cell type versus hESC, p-values and adjusted p-values calculated according to DESeq2 (see STAR key resources table).
Acknowledgments
We are grateful to the members of the Integrated Genomics Operation Core (MSKCC) for help with the RNA-sequencing and the Flow Cytometry Core (MSKCC) for the cell sorting applications. We are also thankful to Myles Fennell from the RNAi core at MSKCC for his help in analyzing the high content screening data and members of the Studer lab for their advice and support of this project. J.T. was supported by the Tri-I Starr Stem Cell Scholars postdoctoral training fellowship. B.Z. was supported by a NYSTEM post-doctoral training fellowship. N.Z. is supported by a fellowship from the Swiss National Science Foundation. The work was supported in part by a grant from the Starr Foundation (2014-001), NYSTEM contract C026446, NINDS/NIH grant R01NS072381 and by the NCI/NIH center core grant P30CA008748. The authors thank for obtaining the K14 and K18 antibodies from Tony Oro, Stanford University and for the TFAP2A antibody (3B5) developed by Williams, T.J. and obtained from the Developmental Studies Hybridoma Bank, created by the NICHD of the NIH and maintained at The University of Iowa, Department of Biology, Iowa City, IA 52242.
Footnotes
AUTHOR CONTRIBUTIONS
Conceptualization, J.T., B.Z. and L.S.; Methodology, J.T., B.Z., F.F.; Investigation and Validation, J.T., B.Z., F.F., S.A., N.Z.; Writing – Original Draft, J.T. and L.S; Writing – Review & Editing, J.T. and L.S.; Funding Acquisition, L.S.; Resources, S.C. and L.S.; Supervision, S.C. and L.S.
Publisher's Disclaimer: This is a PDF file of an unedited manuscript that has been accepted for publication. As a service to our customers we are providing this early version of the manuscript. The manuscript will undergo copyediting, typesetting, and review of the resulting proof before it is published in its final citable form. Please note that during the production process errors may be discovered which could affect the content, and all legal disclaimers that apply to the journal pertain.
References
- Anders S, Huber W. Differential expression analysis for sequence count data. Genome biology. 2010;11:R106. doi: 10.1186/gb-2010-11-10-r106. [DOI] [PMC free article] [PubMed] [Google Scholar]
- Anders S, Pyl PT, Huber W. HTSeq--a Python framework to work with high-throughput sequencing data. Bioinformatics. 2015;31:166–169. doi: 10.1093/bioinformatics/btu638. [DOI] [PMC free article] [PubMed] [Google Scholar]
- Bailey AP, Bhattacharyya S, Bronner-Fraser M, Streit A. Lens specification is the ground state of all sensory placodes, from which FGF promotes olfactory identity. Developmental cell. 2006;11:505–517. doi: 10.1016/j.devcel.2006.08.009. [DOI] [PubMed] [Google Scholar]
- Blauwkamp TA, Nigam S, Ardehali R, Weissman IL, Nusse R. Endogenous Wnt signalling in human embryonic stem cells generates an equilibrium of distinct lineage-specified progenitors. Nature communications. 2012;3:1070. doi: 10.1038/ncomms2064. [DOI] [PMC free article] [PubMed] [Google Scholar]
- Cermak T, Doyle EL, Christian M, Wang L, Zhang Y, Schmidt C, Baller JA, Somia NV, Bogdanove AJ, Voytas DF. Efficient design and assembly of custom TALEN and other TAL effector-based constructs for DNA targeting. Nucleic acids research. 2011;39:e82. doi: 10.1093/nar/gkr218. [DOI] [PMC free article] [PubMed] [Google Scholar]
- Chambers SM, Fasano CA, Papapetrou EP, Tomishima M, Sadelain M, Studer L. Highly efficient neural conversion of human ES and iPS cells by dual inhibition of SMAD signaling. Nature biotechnology. 2009;27:275–280. doi: 10.1038/nbt.1529. [DOI] [PMC free article] [PubMed] [Google Scholar]
- Chambers SM, Qi Y, Mica Y, Lee G, Zhang XJ, Niu L, Bilsland J, Cao L, Stevens E, Whiting P, et al. Combined small-molecule inhibition accelerates developmental timing and converts human pluripotent stem cells into nociceptors. Nature biotechnology. 2012;30:715–720. doi: 10.1038/nbt.2249. [DOI] [PMC free article] [PubMed] [Google Scholar]
- Chen G, Gulbranson DR, Hou Z, Bolin JM, Ruotti V, Probasco MD, Smuga-Otto K, Howden SE, Diol NR, Propson NE, et al. Chemically defined conditions for human iPSC derivation and culture. Nature methods. 2011;8:424–429. doi: 10.1038/nmeth.1593. [DOI] [PMC free article] [PubMed] [Google Scholar]
- Cong L, Ran FA, Cox D, Lin S, Barretto R, Habib N, Hsu PD, Wu X, Jiang W, Marraffini LA, et al. Multiplex genome engineering using CRISPR/Cas systems. Science. 2013;339:819–823. doi: 10.1126/science.1231143. [DOI] [PMC free article] [PubMed] [Google Scholar]
- Dincer Z, Piao J, Niu L, Ganat Y, Kriks S, Zimmer B, Shi SH, Tabar V, Studer L. Specification of functional cranial placode derivatives from human pluripotent stem cells. Cell reports. 2013;5:1387–1402. doi: 10.1016/j.celrep.2013.10.048. [DOI] [PMC free article] [PubMed] [Google Scholar]
- Doyle EL, Booher NJ, Standage DS, Voytas DF, Brendel VP, Vandyk JK, Bogdanove AJ. TAL Effector-Nucleotide Targeter (TALE-NT) 2.0: tools for TAL effector design and target prediction. Nucleic acids research. 2012;40:W117–122. doi: 10.1093/nar/gks608. [DOI] [PMC free article] [PubMed] [Google Scholar]
- Edgar R, Mazor Y, Rinon A, Blumenthal J, Golan Y, Buzhor E, Livnat I, Ben-Ari S, Lieder I, Shitrit A, et al. LifeMap Discovery: the embryonic development, stem cells, and regenerative medicine research portal. PloS one. 2013;8:e66629. doi: 10.1371/journal.pone.0066629. [DOI] [PMC free article] [PubMed] [Google Scholar]
- Fattahi F, Steinbeck JA, Kriks S, Tchieu J, Zimmer B, Kishinevsky S, Zeltner N, Mica Y, El-Nachef W, Zhao H, et al. Deriving human ENS lineages for cell therapy and drug discovery in Hirschsprung disease. Nature. 2016;531:105–109. doi: 10.1038/nature16951. [DOI] [PMC free article] [PubMed] [Google Scholar]
- Gadue P, Huber TL, Paddison PJ, Keller GM. Wnt and TGF-beta signaling are required for the induction of an in vitro model of primitive streak formation using embryonic stem cells. Proc Natl Acad Sci U S A. 2006;103:16806–16811. doi: 10.1073/pnas.0603916103. [DOI] [PMC free article] [PubMed] [Google Scholar]
- Groves AK, LaBonne C. Setting appropriate boundaries: fate, patterning and competence at the neural plate border. Dev Biol. 2014;389:2–12. doi: 10.1016/j.ydbio.2013.11.027. [DOI] [PMC free article] [PubMed] [Google Scholar]
- Leung AW, Kent Morest D, Li JY. Differential BMP signaling controls formation and differentiation of multipotent preplacodal ectoderm progenitors from human embryonic stem cells. Dev Biol. 2013;379:208–220. doi: 10.1016/j.ydbio.2013.04.023. [DOI] [PMC free article] [PubMed] [Google Scholar]
- Li W, Cornell RA. Redundant activities of Tfap2a and Tfap2c are required for neural crest induction and development of other non-neural ectoderm derivatives in zebrafish embryos. Dev Biol. 2007;304:338–354. doi: 10.1016/j.ydbio.2006.12.042. [DOI] [PMC free article] [PubMed] [Google Scholar]
- Lippmann ES, Estevez-Silva MC, Ashton RS. Defined human pluripotent stem cell culture enables highly efficient neuroepithelium derivation without small molecule inhibitors. Stem cells. 2014;32:1032–1042. doi: 10.1002/stem.1622. [DOI] [PubMed] [Google Scholar]
- Loh KM, Chen A, Koh PW, Deng TZ, Sinha R, Tsai JM, Barkal AA, Shen KY, Jain R, Morganti RM, et al. Mapping the Pairwise Choices Leading from Pluripotency to Human Bone, Heart, and Other Mesoderm Cell Types. Cell. 2016;166:451–467. doi: 10.1016/j.cell.2016.06.011. [DOI] [PMC free article] [PubMed] [Google Scholar]
- Luo T, Lee YH, Saint-Jeannet JP, Sargent TD. Induction of neural crest in Xenopus by transcription factor AP2alpha. Proc Natl Acad Sci U S A. 2003;100:532–537. doi: 10.1073/pnas.0237226100. [DOI] [PMC free article] [PubMed] [Google Scholar]
- Mali P, Yang L, Esvelt KM, Aach J, Guell M, DiCarlo JE, Norville JE, Church GM. RNA-guided human genome engineering via Cas9. Science. 2013;339:823–826. doi: 10.1126/science.1232033. [DOI] [PMC free article] [PubMed] [Google Scholar]
- Maroof AM, Keros S, Tyson JA, Ying SW, Ganat YM, Merkle FT, Liu B, Goulburn A, Stanley EG, Elefanty AG, et al. Directed differentiation and functional maturation of cortical interneurons from human embryonic stem cells. Cell stem cell. 2013;12:559–572. doi: 10.1016/j.stem.2013.04.008. [DOI] [PMC free article] [PubMed] [Google Scholar]
- Menendez L, Yatskievych TA, Antin PB, Dalton S. Wnt signaling and a Smad pathway blockade direct the differentiation of human pluripotent stem cells to multipotent neural crest cells. Proc Natl Acad Sci U S A. 2011;108:19240–19245. doi: 10.1073/pnas.1113746108. [DOI] [PMC free article] [PubMed] [Google Scholar]
- Mica Y, Lee G, Chambers SM, Tomishima MJ, Studer L. Modeling neural crest induction, melanocyte specification, and disease-related pigmentation defects in hESCs and patient-specific iPSCs. Cell reports. 2013;3:1140–1152. doi: 10.1016/j.celrep.2013.03.025. [DOI] [PMC free article] [PubMed] [Google Scholar]
- Sanjana NE, Cong L, Zhou Y, Cunniff MM, Feng G, Zhang F. A transcription activator-like effector toolbox for genome engineering. Nature protocols. 2012;7:171–192. doi: 10.1038/nprot.2011.431. [DOI] [PMC free article] [PubMed] [Google Scholar]
- Schorle H, Meier P, Buchert M, Jaenisch R, Mitchell PJ. Transcription factor AP-2 essential for cranial closure and craniofacial development. Nature. 1996;381:235–238. doi: 10.1038/381235a0. [DOI] [PubMed] [Google Scholar]
- Simoes-Costa M, Bronner ME. Reprogramming of avian neural crest axial identity and cell fate. Science. 2016;352:1570–1573. doi: 10.1126/science.aaf2729. [DOI] [PMC free article] [PubMed] [Google Scholar]
- Suzuki IK, Vanderhaeghen P. Is this a brain which I see before me? Modeling human neural development with pluripotent stem cells. Development. 2015;142:3138–3150. doi: 10.1242/dev.120568. [DOI] [PubMed] [Google Scholar]
- Tabar V, Studer L. Pluripotent stem cells in regenerative medicine: challenges and recent progress. Nature reviews Genetics. 2014;15:82–92. doi: 10.1038/nrg3563. [DOI] [PMC free article] [PubMed] [Google Scholar]
- Taylor KM, Labonne C. SoxE factors function equivalently during neural crest and inner ear development and their activity is regulated by SUMOylation. Developmental cell. 2005;9:593–603. doi: 10.1016/j.devcel.2005.09.016. [DOI] [PubMed] [Google Scholar]
- Trapnell C, Roberts A, Goff L, Pertea G, Kim D, Kelley DR, Pimentel H, Salzberg SL, Rinn JL, Pachter L. Differential gene and transcript expression analysis of RNA-seq experiments with TopHat and Cufflinks. Nature protocols. 2012;7:562–578. doi: 10.1038/nprot.2012.016. [DOI] [PMC free article] [PubMed] [Google Scholar]
- Xie WF, Kondo S, Sandell LJ. Regulation of the mouse cartilage-derived retinoic acid-sensitive protein gene by the transcription factor AP-2. The Journal of biological chemistry. 1998;273:5026–5032. doi: 10.1074/jbc.273.9.5026. [DOI] [PubMed] [Google Scholar]
- Zimmer B, Piao J, Ramnarine K, Tomishima MJ, Tabar V, Studer L. Derivation of Diverse Hormone-Releasing Pituitary Cells from Human Pluripotent Stem Cells. Stem Cell Reports. 2016;6:858–872. doi: 10.1016/j.stemcr.2016.05.005. [DOI] [PMC free article] [PubMed] [Google Scholar]
Associated Data
This section collects any data citations, data availability statements, or supplementary materials included in this article.
Supplementary Materials
Data are provided as Reads per Kilobase per Million mapped reads (RPKM), fold changes and fold changes in log2 for each cell type versus hESC, p-values and adjusted p-values calculated according to DESeq2 (see STAR key resources table).