. 2017 Dec 4;6:e24192. doi: 10.7554/eLife.24192

Figure 1. Shisa7 is a type-I transmembrane protein interacting with AMPA-type receptors.

(a) Shisa7 is closely related to the AMPAR auxiliary subunit Shisa6 and Shisa9, bearing a signal peptide (SP; 22 amino acids), an extracellular domain with conserved cysteine-rich motif, a single transmembrane region (TM), and an intracellular domain with a type II PDZ-ligand motif (EVTV). Exon4 (Ex) is an alternative-splice region in Shisa7 and Shisa9, whereas this is Exon3 in Shisa6. The predicted molecular weight of the two mature Shisa7 protein variants is ~56 and ~54 kDa, and that of Shisa6 ~59 and~55 kDa (Klaassen et al., 2016). (b) Shisa7 is highly enriched in the cortex, olfactory bulb and hippocampus, and absent in cerebellum, as measured in crude synaptic membrane fractions. Despite the presence of both transcript variants (see Figure 1—figure supplement 1), the indicated protein band (~68 kDa; arrow head) is dominant in the hippocampus. Lower panel depicts the loading control, that is, total crude synaptic membrane protein. (c) Immunohistochemistry of primary Shisa7 KO hippocampal neurons (DIV14) after viral overexpression of Flag-Shisa7 shows Shisa7 expression (green) in endogenous Homer1-positive puncta (red). The lower panels show a zoom-in (white box in upper panel). The overlay of the two channels is shown, scale bars are indicated. (d) Biochemical fractionation (homogenate (H), crude synaptic membranes (P2; with and without microsomes (M)), synaptosomes (SS), synaptic membranes (SM) and postsynaptic density fraction (PSD; Triton X-100 insoluble fraction) of mature mouse hippocampus reveals an enrichment of Shisa7 in the PSD together with GluA2, GluN2B, PSD-95, and this pattern is distinct from the presynaptic marker Synaptophysin (Syp). (e) Precipitation of Flag-Shisa7 (~60 kDa) from HEK293 cells using a Flag antibody shows that upon co-expression it binds directly to homomeric GluA1, GluA2 and GluA3 receptors, whereas having minimal affinity for GluK2. For complete blots, in addition to those with higher exposure, see Figure 1—figure supplement 3. The input controls represent 2% of the total lysate.

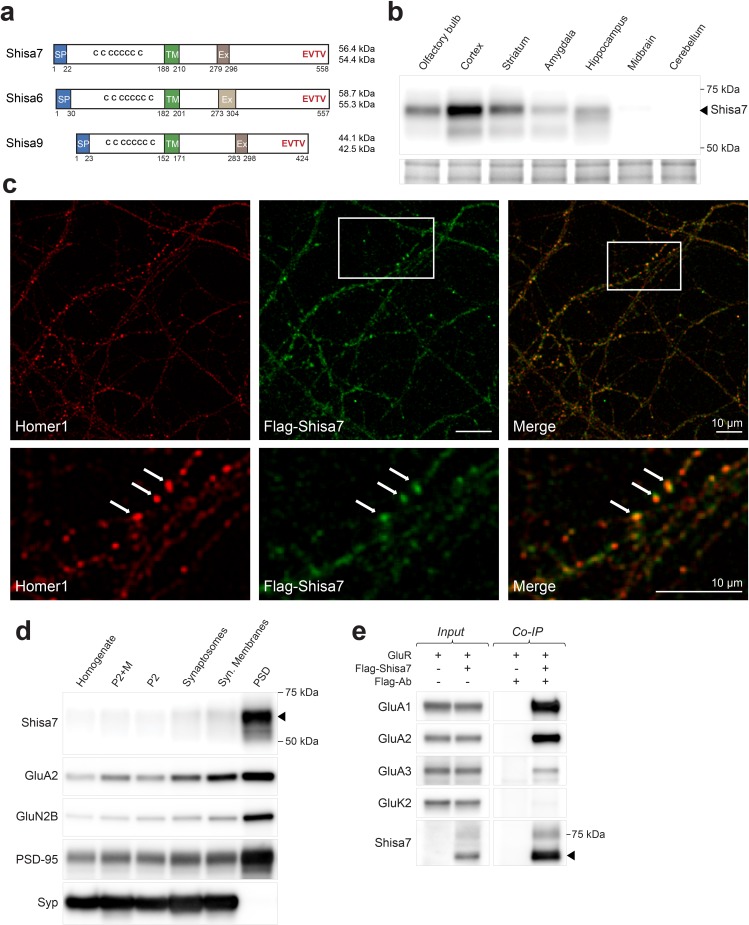
Figure 1—source data 1. Sequence of DNA primers.
Primers were used for PCR experiments to detect the presence or absence of exon 4 in Shisa7, as well as for real-time PCR. The forward and reverse primers, as well as the size of the amplicon generated, are indicated.
DOI: 10.7554/eLife.24192.006

Figure 1.

Figure 1—figure supplement 1. Shisa7 gene expression.

Figure 1—figure supplement 1.

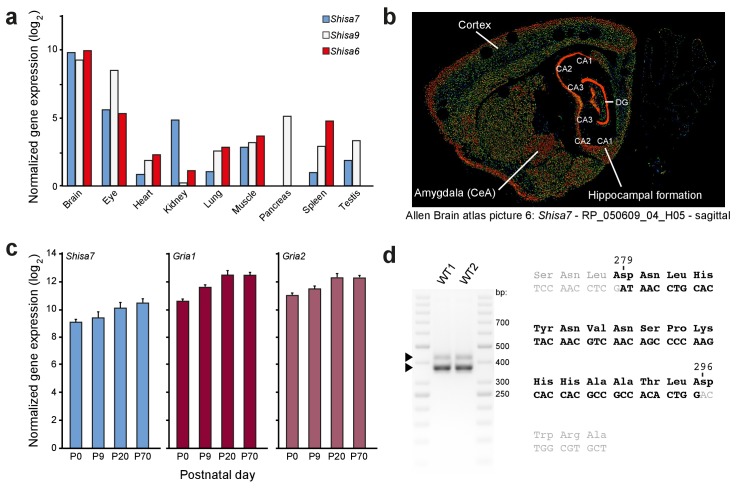
(a) Quantitative PCR shows that the Shisa7 gene expression is specifically enriched within the brain (note the log2-scale), and is virtually absent in the pancreas (pooled from three adult mice). For comparison, gene expression of Shisa9 and Shisa6 was taken along. Primers are indicated in Figure 1—source data 1. (b) Representative example of Shisa7 in situ hybridization signal (picture 6, probe RP_050609_04_H05) from the Allen Brain Atlas (Nesvizhskii et al., 2003; Lein et al., 2007; Wenger and Coon, 2013) showing Shisa7 expression in the entire forebrain, with high expression in the hippocampus, and no expression in the cerebellum. Specific brain regions are indicated. (c) Hippocampal gene expression of Shisa7 and AMPAR subunits Gria1 and Gria2 increases during postnatal development and stabilizes after ~3 weeks, as measured by quantitative PCR (n = 3 independent biological samples, pooled from two mice). (d) RT-PCR on cDNA generated from hippocampal RNA using primers flanking exon 4 of Shisa7 (Figure 1—source data 1). Using this RT-PCR on WT mice in duplicate, we observed two bands (425, 375 nts) corresponding to the two Shisa7 transcripts, of which the exon 4-less transcript showed highest expression. Sequence analysis of these PCR products confirmed the presence of exon 4 (black letters) between exons 3 and 5 (gray letters) in the Shisa7 sequence. The amino acid sequence is indicated above the nucleotide sequence. Importantly, the Shisa7 tryptic peptides NLYNTMKPSNLDNHYNVNSPK (derived from exon 3 and 4) was identified using mass spectrometric analysis of native hippocampal Shisa7 complexes (Table 1).

Figure 1—figure supplement 2. Generation of Shisa7 KO mice and antibody testing.

Figure 1—figure supplement 2.

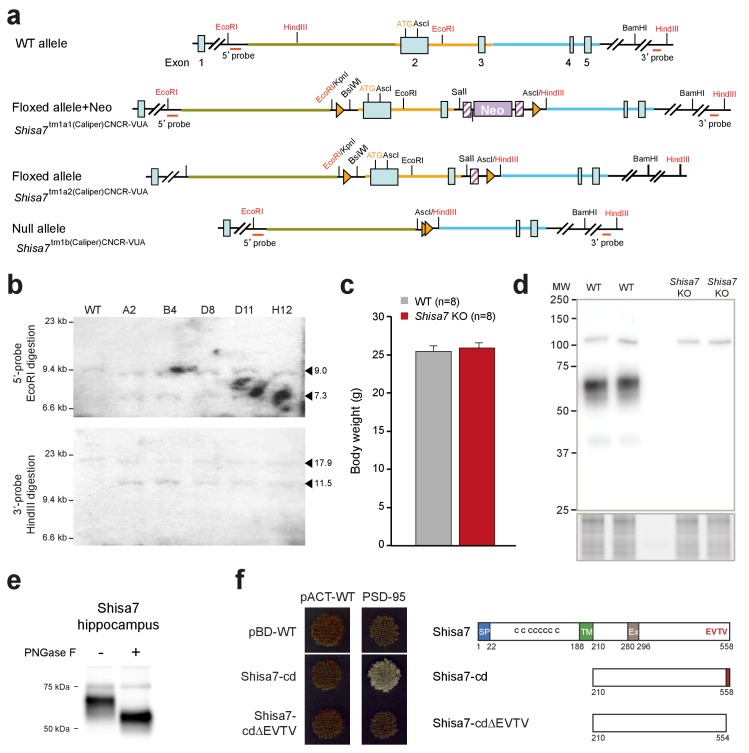
(a) Representation of Shisa7-null mouse generation: The Shisa7 locus around exon 1, encoding the N-terminal part of the Shisa7 protein including the start-site (ATG), with essential restriction sites (red), the 5’-end PCR primer combination and the 3’-probe (and size of fragment) used for Southern blotting, are shown (top) for the Shisa7tm1a1(Caliper)CNCR-VUA mouse line, containing the NEO cassette, the LoxP and FRT sites. The mouse line with the Neo cassette deleted (Shisa7tm1a2(Caliper)CNCR-VUA) and the line with the null-allele (Shisa7tm1b(Caliper)CNCR-VUA; hereafter named Shisa7 KO) are indicated. (b) Correct homologous recombination in ES clones (Shisa7tm1a1(Caliper)CNCR-VUA) was checked by PCR (not shown), and by Southern blot analysis for the 5’- and 3’-end after EcoRI and HindIII digestion, respectively. The 5’-probe (upper panel) generated a 9.0 kB fragment in WT and mutants, and a 7.3 kB fragment in mutants (indicated by triangles). The 3’-probe (lower panel) generated a 17.9 kB fragment in WT and mutants, and a 11.5 kB fragment in mutants (indicated by triangles). (c) Gene deletion of Shisa7 did not affect growth, as indicated by similar body weight at an age of 10–12 weeks (unpaired t-test, p=0.565). (d) The in-house raised Shisa7 antibody was specific as immunoblotting detected Shisa7 in the range of 60–70 kDa in hippocampal crude synaptic membrane fractions, and this band was absent in samples from Shisa7 KO animals. Depending on the sample preparation, non-specific bands of 55 (see Figure 1), 75 and 110 kDa were observed. (e) The observed molecular weight of hippocampal Shisa7 under reduced and denatured (SDS-PAGE) conditions (~68 kDa) was higher than expected based on theoretical protein size alone (predicted mature molecular weight of 56.4 and 54.4 kDa), potentially due to protein glycosylation. Treatment with PNGase-F reduced the observed molecular weight substantially to a single band of ~56 kDa, confirming the presence of N-linked glycans on native Shisa7 (for complete blots, see Figure 1—figure supplement 3). (f) Direct two-hybrid assay of the C-terminal part of Shisa7 (amino acids 210–558; Shisa7-cd), or with a deletion of the last four amino acids (Shisa7-cd∆EVTV; right panel), with the first two PDZ domains of PSD-95. Empty vectors (pBD-WT, pACT-WT) were used as controls. Strong cell growth (left panel) was observed for the Shisa7-cd + PSD-95 condition, indicating a direct interaction. Conditions without successful bait-prey (protein-protein) interaction yielded non-growing yeast cells (red color).

Figure 1—figure supplement 3. Whole immunoblot compilation.

Figure 1—figure supplement 3.

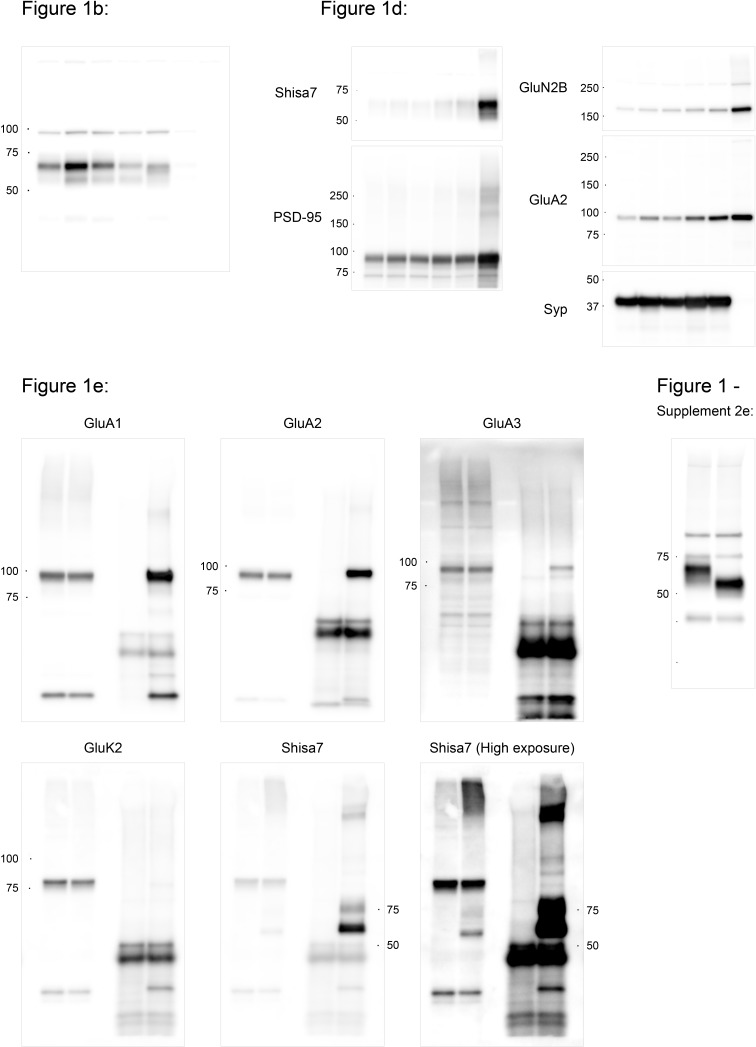
Whole immunoblots are presented from which sections are included in Figure 1b–e, and Figure 1—figure supplement 2e. Numbers represent apparent molecular weights in kDa. Black dots indicate the center of marker bands for the indicated molecular weights.