Abstract
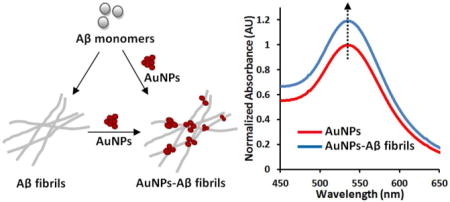
The process of amyloid-β (Aβ) amyloid formation is pathologically linked to Alzheimer’s disease (AD). The identification of Aβ amyloids and intermediates that are crucial players in the pathology of AD is critical for exploring the underlying mechanism of Aβ aggregation and the diagnosis of the disease. Herein, we performed a gold nanoparticle (AuNP)-based study to detect the formation of Aβ amyloid fibrils and oligomers. Our results demonstrate that the intensity of the surface plasmon resonance (SPR) absorption band of the AuNPs is sensitive to the quantity of Aβ40 amyloids. This allows the SPR assay to be used for detection and semi-quantification of Aβ40 amyloids, and characterization of the kinetics of Aβ amyloid formation. Furthermore, our study demonstrates that the SPR band intensity of the AuNPs is sensitive to the presence of oligomers of both Aβ40 and an Aβ40 mutant, which forms more stable oligomers. The kinetics of the stable oligomer formation of the Aβ40 mutant can also be monitored following the SPR band intensity change of AuNPs. Our results indicate that this nanoparticle based method can be used for mechanistic studies of early protein self-assembly and fibrillogenesis.
Graphical abstract
INTRODUCTION
Aberrant protein aggregation, including amyloidogenesis, is associated with a series of late-onset neurodegenerative diseases, such as Alzheimer’s and Parkinson’s.1–2 In Alzheimer’s disease (AD), the most common human neurodegenerative disorder, β-and γ-secretase mediated endoproteolysis of the amyloid precursor protein (APP) produces a family of short peptides collectively referred to as amyloid-β (Aβ), of which the 40 and 42 residue variants (Aβ40 and Aβ42) are the most common. Compelling genetic, biochemical and pathological evidence indicates that the etiology of AD is mechanistically linked to the production and aggregation of Aβ,3–4 although neither the neurotoxicity mechanism of Aβ nor the specific aggregate species responsible for proteotoxicity is well established. Previous studies suggested that the extracellular amyloid plaques are principally responsible for the neuronal dysfunction and loss.5–6 Over the past two decades, a growing body of evidence has indicated that the oligomeric, diffusible assemblies of Aβ peptides formed in the early stage of aggregation, rather than the mature amyloid fibrils, may be the primary neurotoxic species in AD.7–10
While the understanding of Aβ aggregation mechanism has advanced steadily,11–14 the mechanistic details of protein self-assembly, especially the early stage of protein aggregation to form metastable oligomers, still remain largely elusive. The amyloid fibrils containing characteristic cross-β-sheet structure can be detected by commonly used thioflavin T (ThT) and other amyloid binding dyes. However, these fibril-specific dyes are not sensitive to the early formed oligomers, limiting their use in detecting oligomeric species. Identification of protein oligomeric intermediates still remains a challenge. To the best of our knowledge, a continuous assay to sensitively monitor the formation of oligomers is scarce. Sensitive molecular tools or methods are thus desired for exploring the kinetics of protein oligomerization and fibrillization in order to advance the understanding of the fundamental mechanisms of protein aggregation. Furthermore, Aβ peptides have emerged as one of the leading diagnostic biomarkers for AD.15–17 There is evidence showing that the quantity of Aβ aggregates in cerebrospinal fluid (CSF) correlates with the severity of AD.16 Detection and quantification of Aβ aggregates will therefore facilitate the application of Aβ biomarkers towards the early diagnosis of AD, which is critical for the efficacious treatment to the disease.
Gold nanoparticles (AuNPs) have received enormous attention for their potential use in therapeutics and biomedical applications.18–19 AuNPs are non-toxic, inert, biocompatible, and easily visible using microscopic and spectroscopic techniques as a result of their density and optical properties, respectively.20 AuNPs with the size of a few to tens of nanometers exhibit a strong surface plasmon resonance (SPR) absorption band, primarily due to the coherent oscillation of nearly free conduction electrons.21 The attributes of the SPR band are dependent on the size and shape of the nanoparticles themselves in addition to their surrounding media.22–23 AuNP based spectroscopic and colorimetric sensors have been widely developed for identifying analytes, such as proteins, carbohydrates, and nucleic acids.24–27 Over the past two decades, there has been considerable research interest in the use of nanoparticles for studying proteins associated with amyloid diseases.28–33 AuNPs present an enormous surface area and possess strong adsorption capacity for binding of proteins. The effect of protein‒nanoparticle interaction on protein amyloidogenesis is intensively influenced by the structural properties of nanoparticles. AuNPs have also been conjugated with antibodies for detection of amyloidogenic proteins. For example, Neely et al. reported that anti tau antibody coated AuNPs can be used for sensitively detecting the tau protein.34 Their finding indicates the potential application of nanoparticles in the detection of biomarker proteins in AD. In the present work, we use AuNPs as an optical probe for identification and semi-quantification of Aβ amyloids based on characteristic SPR spectral changes in the presence of Aβ aggregates. We also monitor the Aβ40 aggregation kinetics using the AuNP SPR band in combination with a series of spectroscopic and microscopic techniques. Furthermore, our results demonstrate that the assay is suitable for detection of Aβ40 oligomers and the oligomers of an Aβ mutant Aβ40-K16Nle, which forms stable aggregation intermediates. The assay is simple, low cost, and label-free. It may provide an attractive alternative for exploring mechanistic properties of protein self-assembly. This method may also contribute to the development of nano-based diagnostic approaches of AD.
EXPERIMENTAL METHODS
Preparation of Aβ40 and Aβ40-K16Nle Peptides
The Aβ40 and Aβ40-K16Nle peptides were synthesized on a PS3 solid phase peptide synthesizer (Protein Technologies Inc., Woburn, MA) using the standard Fmoc strategy. The resulting crude peptides were purified by reversed phase high performance liquid chromatography (RP-HPLC) using a C18 column and then characterized by matrix-assisted laser desorption ionization (MALDI) mass spectrometry. The peptides were monomerized as described previously before being used.35 Briefly, lyophilized peptide powder was dissolved in aqueous NaOH solution (2 mM) and the pH was adjusted to ~11 by using 100 mM NaOH solution. The solution was sonicated for 1 h in an ice-water bath, then filtered through a 0.22-μm filter (Millipore) and kept on ice before use. The concentration of the peptide solution was determined by using the tyrosine UV absorbance at 280 nm (ε = 1,280 M−1cm−1).
Preparation of Oligomers and Fibrils of Aβ40 and Aβ40-K16Nle
The Aβ40 oligomer samples (maximum concentration 20 μM) were prepared by incubating Aβ40 monomer in pH 7.4 phosphate buffer (50 mM Na phosphate, 150 mM NaCl) at room temperature for 8 h and were used immediately to avoid further aggregation. The Aβ40 amyloid fibril samples (maximum concentration 20 μM) were prepared by incubating Aβ40 monomer in pH 7.4 phosphate buffer (50 mM Na phosphate, 150 mM NaCl) at 37°C for 45 h during which the samples were shaken every 10 min for 5 s. Aβ40-K16Nle oligomers were prepared by incubating Aβ40-K16Nle monomer in pH 7.4 phosphate buffer (50 mM Na phosphate, 150 mM NaCl) at 37°C for 24 h.
Synthesis of AuNPs
AuNPs were synthesized following a bottom-up approach reported by Kumar et al.36 Briefly, 1 mL of 12.7 mM chloroauric acid solution was added to 49 mL Milli-Q water in a clean glass flask with a stir bar. The apparatus was transferred on top of a hot plate and allowed to boil while stirring. Once boiling, 0.9 mL of 38.8 mM trisodium citrate solution was added to the gold solution. The colour of the solution changed from yellow to dark violet after 60 s, and finally to a brilliant red after 120 s. The solution was boiled for 5 min and then allowed to cool to room temperature. The AuNP solution was stored at room temperature in a brown, light impermeable Greiner centrifuge tube.
Ultraviolet-visible (UV-Vis) Spectroscopy of AuNPs
The AuNPs stock solution was diluted to 0.31 nM in pH 7.4 phosphate buffer (16.5 mM Na phosphate, 50 mM NaCl), and the UV-Vis spectra were recorded using a HP Agilent 8453 Diode Array UV-Vis-NIR spectrophotometer and a 100 μL ultra-micro quartz cuvette. A known quantity of the peptide solution (monomer, oligomer, or amyloid) was also added to the AuNPs solution (final concentration 0.31 nM) for UV-Vis spectra measurement.
Kinetic Aggregation Assay of Aβ40 using ThT
The aggregation kinetics followed by ThT fluorescence were conducted as described previously.37 In brief, the monomerized Aβ40 peptide solution was diluted to a specific final concentration in pH 7.4 phosphate buffer (50 mM Na phosphate, 150 mM NaCl). The solution also contained ThT with a final concentration of 25 μM. 100 μL solution was transferred into a well of a 96-well microplate (Costar black, clear bottom). The plate was sealed with a microplate cover and loaded into a Gemini SpectraMax EM fluorescence plate reader (Molecular Devices, Sunnyvale, CA), where it was incubated at 37°C. The fluorescence of ThT was measured every 10 min after shaking for 5 s with an excitation wavelength of 440 nm and an emission wavelength of 480 nm. The same procedure was used for monitoring the kinetics of Aβ40-K16Nle aggregation.
Transmission Electron Microscopy (TEM)
TEM images were obtained using Philips PW 6061 transmission electron microscopy system (model CM 200, Eindhoven, The Netherlands). The 400 Mesh Copper grids coated by FORMVAR carbon film (FCF 400-Cu, Electron Microscopy Sciences, Hatfield, Pennsylvania, USA) were used. Briefly, the grids were gently washed with 10 μL Milli-Q water, and the water was absorbed from the grids using filter paper. Then, 5 μL droplets of AuNP samples were drop deposited immediately on the grids and were allowed to dry in a clean environment at room temperature overnight.
Atomic Force Microscopy (AFM)
The 20 μL aliquots of the sample were adsorbed onto the surface of freshly cleaved mica (5×5 mm) for 5 min at room temperature. The liquid was wicked off using filter paper. Salts and unbound materials were removed by washing with 20 μL Milli-Q water for three times. The samples were dried overnight and AFM images were acquired in tapping mode using an Asylum Research MFP 3D AFM system with MikroMasch NSC15/Al BS cantilevers.
Circular Dichroism (CD)
Peptide samples were prepared in pH 7.4 phosphate buffer (50 mM Na phosphate, 150 mM NaCl). Then 200 μL aliquot was transferred into a 1 mm quartz cuvette. CD spectra were collected on a J-810 JASCO spectrometer.
RESULTS AND DISCUSSION
Detection of Aβ40 Amyloids using AuNPs
The citrate based AuNPs were prepared following a bottom-up approach previously reported by Kumar et al.36 The diameter of the synthesized nanoparticle is ~23 nm (Figure S1). The zeta potential value of the AuNPs is −22 mV. This suggests that the nanoparticles are covered and stabilized by negatively charged citrates on the surface. The UV-Vis spectrum of the nanoparticles shows a characteristic SPR band with a maximum absorbance at 535 nm (Figure 1a).
Figure 1.
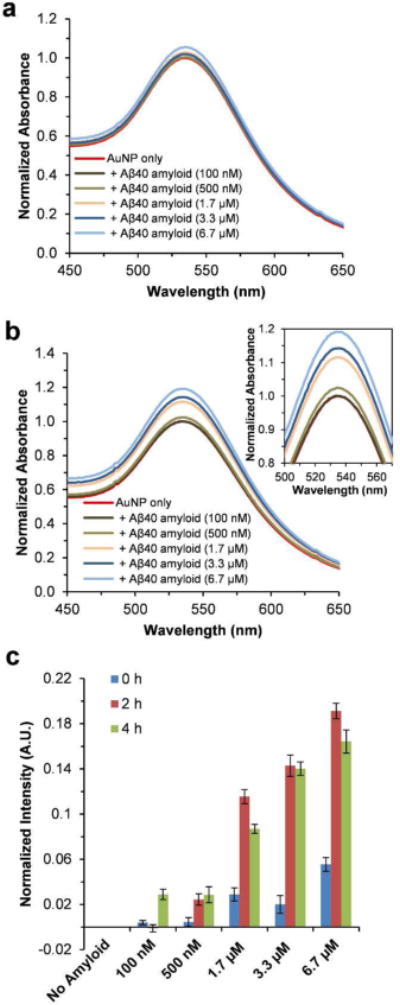
UV-Vis spectra of AuNPs. The AuNPs were co-incubated with the indicated amount of preformed Aβ40 amyloids in pH 7.4 phosphate buffer, and the UV-Vis spectra were measured at 0 h (a), and after 2 h (b). The spectra were normalized by setting the maximum intensity of the SPR band of the AuNP only sample to 1. The inset in (b) shows the amplified SPR band. (c) The SPR band intensity difference at 535 nm calculated by subtracting the UV-Vis spectrum of AuNP only sample from those of AuNP‒Aβ40 amyloid mixtures (spectra measured at 0 h, and after 2 h and 4 h incubation). Data are reported as means ± the standard deviation of triplicate results.
To evaluate the spectroscopic sensitivity of the AuNPs in the presence of Aβ40 amyloids, the preformed Aβ40 amyloid fibrils were added to the nanoparticle solution (final AuNP concentration 0.31 nM). As shown in Figure 1a, the SPR band intensity of the AuNPs exhibits a slight change immediately after adding different amounts of Aβ40 amyloid fibrils. Here, the quantity of Aβ40 amyloids is simply represented using the concentration of equivalent amount of Aβ40 monomer (100 nM–6.7 μM). After 2 h incubation, the SPR band shows a more significant intensity increase in the presence of increasing amounts of Aβ40 amyloids (Figure 1b). There is no observable absorbance in the SPR band region of the UV-Vis spectra of Aβ40 amyloid fibrils, (Figure S2), suggesting that the SPR band change is not directly due to UV-Vis absorbance of Aβ40 amyloids. The SPR band intensity increase at 535 nm, which was calculated by subtracting the UV-Vis spectrum of AuNP control sample from those of AuNP‒Aβ40 mixture samples, shows a dose-dependent trend proportional to the amount of Aβ40 amyloids (Figure 1c). This quantitative relationship makes the assay valuable as a potential method to detect and semi-quantify the amount of Aβ40 amyloid fibrils. A longer incubation time of 4 h does not further magnify the intensity change of the SPR band in the assay (Figure 1c). A similar study was also carried out using a higher concentration of AuNPs (0. 41 nM). The sensitivity of the assay is not significantly improved by increasing the concentration of AuNPs (Figure 1b vs. Figure S3). Furthermore, the ThT dye was used to monitor the fibril formation of Aβ40. As shown in Figure S4, the fluorescence signal of ThT is weak with 3.3 μM Aβ40 compared to that with10 μM Aβ40, and no signal is observed with 1.7 μM Aβ40. This suggests that the sensitivity of the ThT assay for probing Aβ40 fibrils under this condition is in micromolar regime. For the AuNP assay reported here, the results show that it has sub micromolar sensitivity for identification and semi-quantification of Aβ40 amyloids (Figure 1c).
To gain better insight into the interactions between AuNPs and Aβ40 amyloids, AFM images were taken for the AuNPs with or without Aβ40 amyloids. As shown in Figure 2a, clusters of AuNPs with a diameter of ~0.15–0.3 μm were observed under the AFM experimental condition. In the presence of Aβ40 amyloids, the AuNPs largely co-localized with the amyloid fibers (Figure 2b). The effect of Aβ40 amyloids on the distribution properties of AuNPs was further studied using TEM imaging. In order to avoid the interference of additional negative staining regents such as uranyl acetate on the distribution properties of AuNPs, the TEM images were acquired without negative staining. As shown in Figure 3a, the AuNPs were randomly dispersed in the TEM image in the absence of Aβ40 fibrils. When Aβ40 amyloids were added, the nanoparticles co-localized with Aβ40 amyloid gel like structures (Figure 3b–d). The fibrillar morphology of Aβ40 is not observed in the images because of the lack of negative staining. At the highest concentration of 6.7 μM Aβ40 amyloids, some AuNPs were embedded in the Aβ40 amyloid gel structures and appeared blurred in the image (Figure 3d). These results demonstrate that the nanoparticles are prone to be adsorbed onto the Aβ fibrillar structures, leading to peptide‒nanoparticle interactions which may be directly related to change in SPR band intensity of AuNPs.
Figure 2.
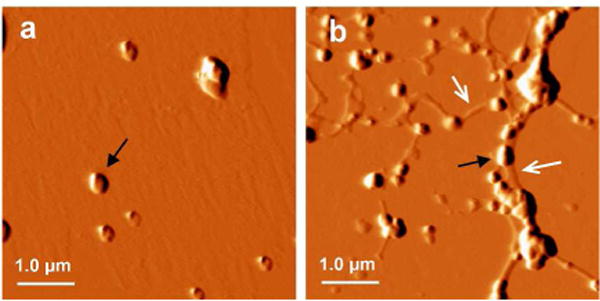
Tapping mode AFM images of AuNPs in the absence or presence of preformed Aβ40 amyloids. The AuNPs were incubated in pH 7.4 phosphate buffer alone (a), or with additional 1.7 μM Aβ40 amyloids (b). The black arrow indicates the AuNP cluster. The white arrow indicates the fibrils.
Figure 3.
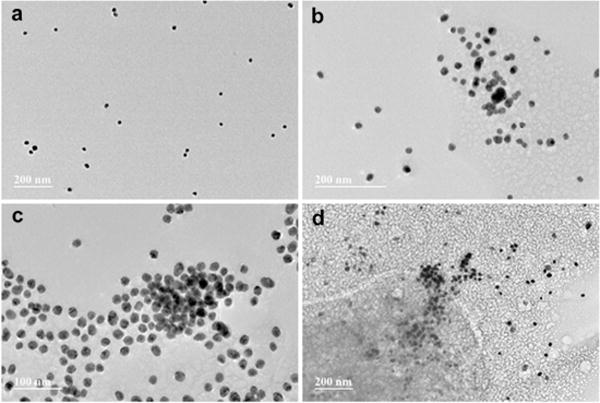
TEM images of AuNPs in the absence or presence of preformed Aβ40 amyloids. The AuNPs were incubated in pH 7.4 phosphate buffer alone (a), or with additional 1.7 μM Aβ40 amyloids (b), 3.3 μM Aβ40 amyloids (c), or 6.7 μM Aβ40 amyloids (d) for 24 h before being scanned.
Protein‒AuNP interactions are aided by several forces such as hydrogen bonds, solvation forces, Van der Waals interactions, and electrostatic interactions.38 Among these, electrostatic interactions have been identified as one of the crucial physical forces in binding of protein and AuNPs.39–40 Aβ is an amphiphilic peptide, containing three positively charged residues (R5, K16, and K28). The aligned side chains of the charged residues in the fibrillar structure form local positive charge rich patches.41 Negatively charged AuNPs therefore can be favorably adsorbed on the positive regions at the fiber surface via attractive electrostatic interactions, facilitating the formation of nucleation sites for further assembly of nanoparticles. In addition, Aβ amyloid fibrils also contain hydrophobic patches on their surfaces, and hydrophobic interactions also play an important role in the interaction with the AuNP surface.42 The SPR band intensity depends on nanoparticle surface morphology and size, concentration, dielectric environment, and the refractive index of the media.22–23, 43 The interactions between nanoparticles and proteins at the metal/water interface changes the local refractive index and dielectric properties, and thus render the SPR band property, allowing for sensitive measurement of the protein‒nanoparticle interactions.44 Here, the position of the intensity maximum of the AuNP SPR band does not shift noticeably after addition of Aβ amyloids, suggesting that the change in optical density is not likely a result of a change in particle size, which is also confirmed from TEM imaging.
Aβ40 Aggregation Kinetics Monitored using AuNPs
The aggregation of amyloidogenic proteins is generally understood as a nucleated-polymerization process,11, 45–47 manifested by an apparent initial lag phase followed by a rapid conversion of the monomeric or oligomeric protein to the terminal fibrillar forms. The influence of nanoparticles on protein misfolding and aggregation has long been recognized.29, 48 However, the reported kinetic effects of nanoparticles on protein amyloid formation appear to be contradictory in the literature. Some reports describe nanoparticles as inhibitors of Aβ fibril formation,28, 32, 49 while some others suggest that nanoparticles facilitate Aβ fibrillogenesis.50 This indicates that the influence of nanoparticles on fibrillization is strongly dependent on the physical characteristics of nanoparticles including their size, shape, and surface properties.51–53 Therefore, we first tested the effect of the synthesized AuNPs on the kinetics of Aβ amyloid formation using a ThT binding assay. As shown in Figure 4a, the presence of AuNPs (0.31 nM) increases the ThT fluorescence intensity of the final plateau phase of Aβ40 (10 μM) aggregation. The lag phase of the aggregation traces remains little changed in the presence of AuNPs, suggesting that AuNPs do not influence the early nucleation reactions significantly. The aggregation rate shows a slight change, with the aggregation half time (t50) shortened from ~7.8 h to ~7.2 h in the presence of the nanoparticles. Here, t50 is defined as the time at which the fluorescence intensity reaches the midpoint between the pre- and post-aggregation baselines. These results suggest that the AuNPs under the current condition do not influence the kinetics of Aβ40 aggregation dramatically.
Figure 4.
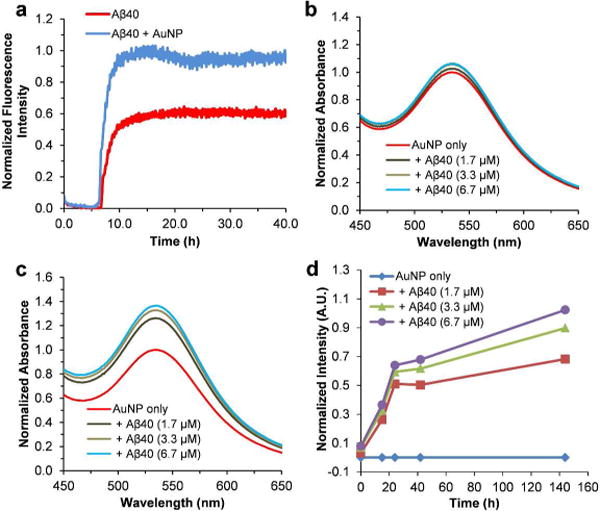
Aβ40 aggregation kinetics in the presence of AuNPs. (a) Aβ40 (10 μM) aggregation kinetics in the absence or presence of AuNPs followed by ThT fluorescence (pH 7.4, 37°C). (b) UV-Vis spectra of AuNPs in the absence or presence of different amount of Aβ40 monomers in pH 7.4 phosphate buffer measured at 0 h. The spectra were normalized by setting the maximum intensity of the SPR band of the AuNP only sample to 1. (c) UV-Vis spectra of AuNPs measured after 24 h incubation. The spectra were normalized by setting the maximum intensity of the SPR band of the AuNP only sample to 1. (d) Aβ40 aggregation kinetics followed by the SPR band intensity change at 535 nm. The values of the band intensity change were calculated by subtracting the UV-Vis spectrum of AuNP only sample from those of AuNP‒Aβ40 mixtures measured at each time point.
The aggregation kinetics of Aβ40 monomers were then monitored by following the time-dependent SPR band intensity. At 0 h, the SPR band of AuNPs is similar to that of the AuNPs co incubated with differing amounts of Aβ40 monomers (Figure 4b). After 24 h incubation, the intensity of the SPR bands appears to show a significant difference between the AuNP sample and the AuNP‒Aβ40 mixtures (Figure 4c), likely caused by Aβ40 aggregation. For example, the intensity of the SPR band of the AuNP‒Aβ40 (6.7 μm) sample at 535 nm is ~37% stronger than that of the AuNP only sample. The relative intensity of the band increases in an Aβ40 concentration dependent manner (Figure 4c). The time dependent SPR band intensity difference at 535 nm between the samples of AuNP and the AuNP-Aβ40 mixtures was displayed using the nanoparticle only solution as a reference at each time point. As depicted in Figure 4d, the SPR band intensity change shows an increasing transition over time, in accord with the fibrillization kinetics of Aβ40 peptide. The final SPR band intensity change is proportional to the concentration of Aβ40. These results suggest that the nanoparticles used in this study can follow fibrillogenesis of Aβ40 peptide in a kinetics assay. This assay can also be used to probe the quantity of amyloids. Interestingly, the SPR band intensity of the AuNP‒Aβ40 mixture samples increases quickly (Figure 4d), without an observable lag phase. This is not consistent with the results of Aβ40 aggregation kinetics following ThT fluorescence. As shown in Figure S4, there is no ThT fluorescence signal with the concentration of Aβ40 at 1.7 μM. With higher concentration of Aβ40, the aggregation kinetics show a characteristic sigmoid transition including an apparent initial lag phase followed by a rapid growth phase. The lag phase of the kinetics of 3.3 μM Aβ40 is ~9.3 h, and the lag phase is shortened to ~6.2 h for Aβ40 with an increased concentration of 10 μM. The kinetic difference between the two methods suggests that the fast kinetic phase observed in the AuNP assay is not likely initiated by binding of AuNPs with late-formed amyloid fibrils. In addition, there is lack of strong concentration dependence of the fast kinetic rate in the AuNP assay (Figure 4d). These results suggest that the nanoparticles may also be sensitive to the oligomeric structures formed at the early stage of Aβ aggregation. The fast oligomerization rate at the measured concentration range (1.7–6.7 μM) may be responsible for the weak concentration dependence of the kinetic rate shown in Figure 4d.
Detection of Non-Fibrillar Oligomeric Intermediates Using AuNPs
Although recent converging lines of evidence suggest that the oligomeric assemblies of Aβ peptides appear to be the major toxic species in AD,7–9 the mechanistic insight into Aβ oligomer formation is still very limited. Recently, Lee et al. reported a fluorescence method for monitoring distinct oligomerization and fibrillization process of a double cysteine-labeled Aβ using a FlAsH dye.12 Garai et al. monitored the full time course of Aβ aggregation including the formation of low-molecular-weight oligomers using the tetramethylrhodamine-labeled Aβ.54 Despite such pioneering studies, the means for kinetically probing protein oligomer formation still remain limited.
In order to test the sensitivity of AuNP SPR band on the Aβ40 oligomers, the AuNPs were mixed with the preformed Aβ40 oligomers (AFM images of time dependent Aβ40 oligomer formation in Figure S5), and the UV-Vis spectra were measured accordingly (Figure 5). There is a slight while noticeable SPR band intensity change immediately after adding different amounts of Aβ40 oligomers (Figure 5b). After 1 h incubation, the SPR band intensity of the AuNP‒peptide mixtures is significantly higher compared to that of the AuNP only sample (Figure 5a and 5b). The intensity of the SPR band increases in an oligomer concentration dependent manner (Figure 5b). These results suggest that the AuNPs can also interact with the oligomeric species of Aβ40. It is conceivable that the AuNP‒oligomer interaction will influence the local environment of AuNPs as well, resulting in the SPR band intensity change.
Figure 5.
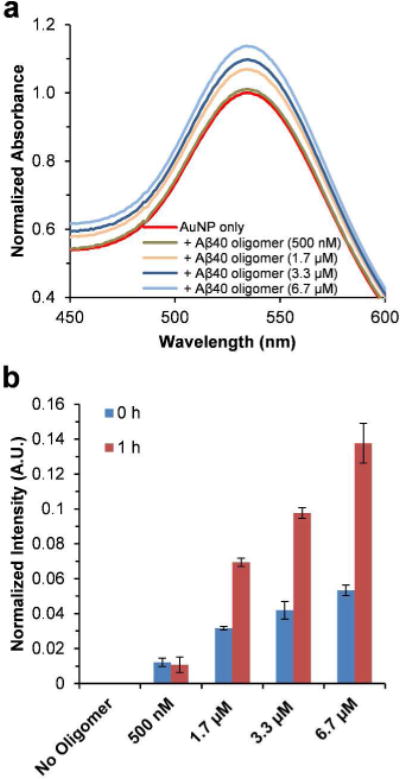
Effect of preformed Aβ40 oligomers on UV-Vis spectra of AuNPs. (a) UV-Vis spectra of AuNPs in the absence or presence of different amounts of preformed Aβ40 oligomers in pH 7.4 phosphate buffer measured after 1 h incubation. The spectra were normalized by setting the maximum intensity of the SPR band of the AuNP only sample to 1. (b) The SPR band intensity difference at 535 nm calculated by subtracting the UV-Vis spectrum of AuNP only sample from those of AuNP‒Aβ40 oligomer mixtures (spectra measured at 0 h and after 1 h incubation). Data are reported as means ± the standard deviation of triplicate results.
To expand the potential application of AuNPs in identification of the formation of protein oligomeric aggregates, we also studied an Aβ40 mutant, Aβ40-K16Nle, by replacing the Lys16 residue with an unnatural amino acid norleucine (Nle) (Figure 6a). This mutation neutralizes the positive charge of the Lys side chain. Interestingly, aggregation of Aβ40-K16Nle produces stable oligomers which do not proceed to form fibrils. The CD spectrum of Aβ40-K16Nle (40 μM), after 5 d incubation in pH 7.4 phosphate buffer (50 mM Na phosphate) at 37°C, shows the lack of a typical β sheet structure, compared to a β sheet conformation of Aβ40 after 5 d incubation (Figure 6b). There is negligible ThT fluorescence intensity after 40 h of incubation of Aβ40-K16Nle, in contrast to that of Aβ40 at a lower concentration (Figure 6c). Furthermore, no fibers were observed in AFM imaging after 5 d of incubation of Aβ40-K16Nle (Figure 6d); instead, appreciable amount of smaller oligomeric aggregates formed. This is distinct from the typical fibrillar structures of Aβ40 (Figure S6). The Aβ40-K16Nle mutant therefore may be used as a favorable model protein for studying biophysical characteristics of oligomers.
Figure 6.
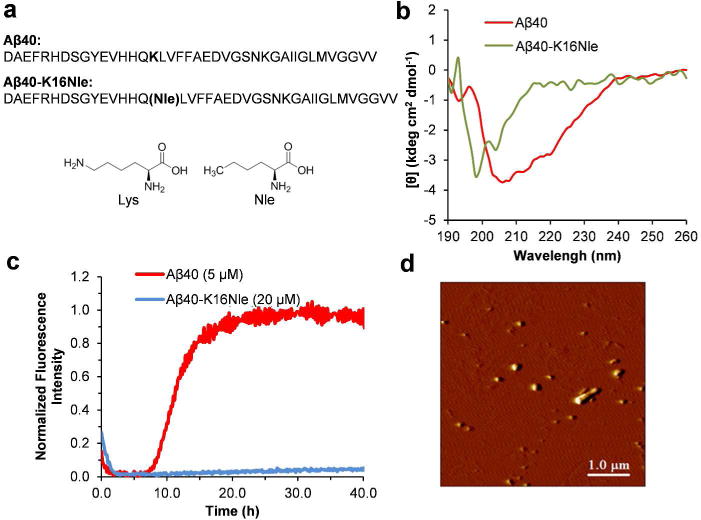
Aggregation of Aβ40-K16Nle. (a) The primary sequence of Aβ40 and Aβ40-K16Nle. The chemical structures of Lys and Nle are shown for comparison. (b) CD spectra of Aβ40 (50 μM) and M1 (40 μM) after 5 d incubation in pH 7.4 phosphate buffer at 37°C. (c) Aggregation kinetics of Aβ40 and Aβ40-K16Nle followed by ThT fluorescence in pH 7.4 phosphate buffer at 37°C. (d) AFM image of Aβ40-K16Nle (40 μM) incubated for 5 d in pH 7.4 phosphate buffers at 37°C.
To test the sensitivity of the AuNP SPR band on the Aβ40-K16Nle oligomers, the AuNPs were co-incubated with the preformed Aβ40-K16Nle oligomers. The SPR band of the AuNP‒ peptide mixtures shows higher intensity compared to that of the AuNP only sample after 2 h incubation (Figure 7a). The value of the SPR band intensity increase at 535 nm shows a dose-dependent trend proportional to the amount of Aβ40-K16Nle oligomers (Figure 7b). These are similar to what were observed for Aβ40 oligomers.
Figure 7.
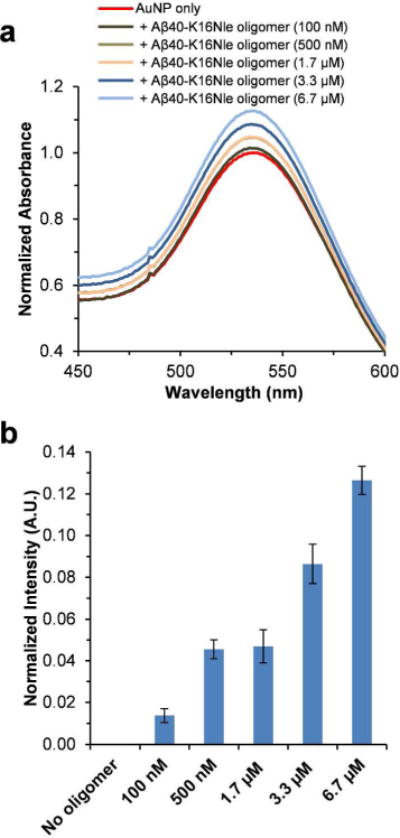
Effect of preformed Aβ40-K16Nle oligomers on UV-Vis spectra of AuNPs. (a) UV-Vis spectra of AuNPs in the absence or presence of different amounts of preformed Aβ40-K16Nle oligomers in pH 7.4 phosphate buffer measured after 2 h incubation. The spectra were normalized by setting the maximum intensity of the SPR band of the AuNP only sample to 1. (b) The SPR band intensity difference at 535 nm calculated by subtracting the UV-Vis spectrum of AuNP only sample from those of AuNP‒Aβ40-K16Nle oligomer mixtures. Data are reported as means ± the standard deviation of triplicate results.
We further measured the time-dependent SPR band intensity change of the AuNPs co-incubated with Aβ40-K16Nle monomers (1.7–6.7 μM), in order to examine the kinetics of Aβ40-K16Nle oligomer formation using AuNPs. Because the aggregation of Aβ40-K16Nle does not form fibrillar structures, ThT fluorescence is not capable to probe the kinetic information of Aβ40-K16Nle aggregation (Figure 6c). The value of the time-dependent SPR band intensity change, in contrast, shows a quick increase within 6 h (Figure 8a), indicating a fast oligomerization rate of Aβ40-K16Nle. The fast oligomerization process of Aβ40-K16Nle is also validated by the AFM results. As shown in Figure 8b, after 1 h of incubation, an appreciable amount of Aβ40-K16Nle oligomers was observed in the AFM image. The SPR band increasing phase of Aβ40-K16Nle is faster than that of the wild type Aβ40 (Figure 8a vs. Figure 4d), suggesting a higher propensity of Aβ40-K16Nle for forming oligomers compared to that of Aβ40. It has been recognized that the central hydrophobic core “LVFFA” (residues 17–21) region in Aβ sequence is crucial in the early steps of Aβ aggregation and fibril formation.55–56 Considering the close proxomity of the substituted hydrophobic Nle16 residue to this hydrophobic center, it is likely that the Nle16 residue in Aβ40-K16Nle contributes in forming stronger intermolecular hydrophobic interactions in the early self-assembly, leading to a faster oligomerization rate. The strong hydrophobic interactions in the oligomers of Aβ40-K16Nle may significantly stabilize the oligomeric structures, and prevent a subsequent conformational transition of spherical oligomers to form amyloid fibrils.12 A latter transition at ~80 h observed in the SPR intensity change kinetics (Figure 8a) may likely be caused by further conformational rearrangement of the aggregated structures, and/or changes of nanoparticle‒Aβ40-K16Nle interactions. Our results suggest that the characteristic SPR band of AuNPs may be used as a valuable means for monitoring the kinetics of protein oligomerization, which is important for understanding the underlying mechanistic characteristics of protein self-assembly. In the future, AuNPs may also be further conjugated with designed ligands, such as short peptides and aptamers that bind specifically to Aβ, to render the assay more practical and selective. Aptamers have been used for decorating the surface of nanoparticles and nanorods for enhanced colorimetric and spectroscopic sensing applications.57–58 Such approach may also be valuable for the development of nanoparticle-based diagnostic tool for AD targeting on Aβ biomarkers. In addition, future studies of investigation of the AuNP method for probing the aggregates of other amyloidogenic proteins will be valuable for potential application of the approach as a general alternative in studying protein amyloidogenesis.
Figure 8.
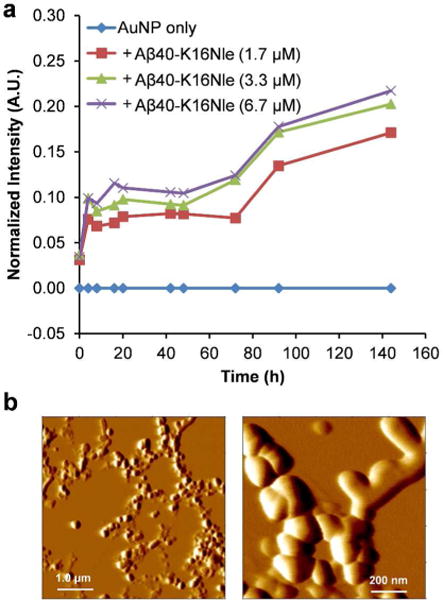
Aggregation kinetics of Aβ40-K16Nle. (a) Aβ40-K16Nle aggregation kinetics followed by the SPR band intensity change at 535 nm. The values of the band intensity change were calculated by subtracting the UV-Vis spectrum of AuNP only sample from those of AuNP‒Aβ40-K16Nle mixtures measured at each time point. (b) AFM image of Aβ40-K16Nle (6.7 μM) incubated with AuNP in pH 7.4 phosphate buffer at 37°C for 1 h.
CONCLUSION
In the present work, we report a simple, low cost, and label-free AuNP-based assay for probing Aβ oligomer and amyloid fibril formation. Our results show that the intensity of the SPR band of the AuNPs is sensitive to the presence of Aβ40 amyloids. The value of the SPR band intensity change shows a dose-dependent trend proportional to the amount of Aβ40 amyloids. The change of SPR band intensity of AuNPs can also be used to follow the kinetics of Aβ40 fibril formation. Furthermore, our results show that the SPR band intensity of AuNPs is also sensitive to the oligomeric structures of both Aβ40 and the Aβ40-K16Nle mutant. The process of the formation of stable oligomers of Aβ40-K16Nle can be monitored following the SPR band intensity change of AuNPs. Our results demonstrate that this AuNP-based method is uniquely useful in detecting Aβ oligomers and monitoring the kinetic information of oligomer formation. It provides an attractive alternative for mechanistic studies of early protein self-assembly and fibrillogenesis.
Supplementary Material
Acknowledgments
We gratefully acknowledge the financial support from the National Institutes of Health (R15GM116006).
Footnotes
Supporting Information. TEM image of AuNPs, UV-Vis spectra of Aβ40 amyloids, SPR spectra of AuNPs, ThT kinetics of Aβ40, AFM images of Aβ40 oligomers and fibrils, and experimental methods.
This material is available free of charge via the Internet at http://pubs.acs.org.
Notes
The authors declare no competing financial interest.
References
- 1.Chiti F, Dobson CM. Protein misfolding, functional amyloid, and human disease. Annu Rev Biochem. 2006;75:333–366. doi: 10.1146/annurev.biochem.75.101304.123901. [DOI] [PubMed] [Google Scholar]
- 2.Selkoe DJ, Hardy J. The amyloid hypothesis of Alzheimer’s disease at 25 years. EMBO Mol Med. 2016;8:595–608. doi: 10.15252/emmm.201606210. [DOI] [PMC free article] [PubMed] [Google Scholar]
- 3.Tanzi RE, Bertram L. Twenty years of the Alzheimer’s disease amyloid hypothesis: a genetic perspective. Cell. 2005;120:545–555. doi: 10.1016/j.cell.2005.02.008. [DOI] [PubMed] [Google Scholar]
- 4.Hardy J, Selkoe DJ. The amyloid hypothesis of Alzheimer’s disease: Progress and problems on the road to therapeutics. Science. 2002;297:353–356. doi: 10.1126/science.1072994. [DOI] [PubMed] [Google Scholar]
- 5.Lorenzo A, Yankner BA. β-Amyloid neurotoxicity requires fibril formation and is inhibited by Congo red. Proc Natl Acad Sci USA. 1994;91:12243–12247. doi: 10.1073/pnas.91.25.12243. [DOI] [PMC free article] [PubMed] [Google Scholar]
- 6.Pike CJ, Walencewicz AJ, Glabe CG, Cotman CW. In vitro aging of β-amyloid protein causes peptide aggregation and neurotoxicity. Brain Res. 1991;563:311–314. doi: 10.1016/0006-8993(91)91553-d. [DOI] [PubMed] [Google Scholar]
- 7.Billings LM, Oddo S, Green KN, McGaugh JL, LaFerla FM. Intraneuronal Aβ causes the onset of early Alzheimer’s disease-related cognitive deficits in transgenic mice. Neuron. 2005;45:675–688. doi: 10.1016/j.neuron.2005.01.040. [DOI] [PubMed] [Google Scholar]
- 8.Haass C, Selkoe DJ. Soluble protein oligomers in neurodegeneration: lessons from the Alzheimer’s amyloid β-peptide. Nat Rev Mol Cell Biol. 2007;8:101–112. doi: 10.1038/nrm2101. [DOI] [PubMed] [Google Scholar]
- 9.Walsh DM, Klyubin I, Fadeeva JV, Cullen WK, Anwyl R, Wolfe MS, Rowan MJ, Selkoe DJ. Naturally secreted oligomers of amyloid β protein potently inhibit hippocampal long-term potentiation in vivo. Nature. 2002;416:535–539. doi: 10.1038/416535a. [DOI] [PubMed] [Google Scholar]
- 10.Benilova I, Karran E, De Strooper B. The toxic Abeta oligomer and Alzheimer’s disease: an emperor in need of clothes. Nat Neurosci. 2012;15:349–357. doi: 10.1038/nn.3028. [DOI] [PubMed] [Google Scholar]
- 11.Teplow DB. Structural and kinetic features of amyloid β-protein fibrillogenesis. Amyloid. 1998;5:121–142. doi: 10.3109/13506129808995290. [DOI] [PubMed] [Google Scholar]
- 12.Lee J, Culyba EK, Powers ET, Kelly JW. Amyloid-β forms fibrils by nucleated conformational conversion of oligomers. Nat Chem Biol. 2011;7:602–609. doi: 10.1038/nchembio.624. [DOI] [PMC free article] [PubMed] [Google Scholar]
- 13.Shim SH, Gupta R, Ling YL, Strasfeld DB, Raleigh DP, Zanni MT. Two-dimensional IR spectroscopy and isotope labeling defines the pathway of amyloid formation with residue specific resolution. Proc Natl Acad Sci USA. 2009;106:6614–6619. doi: 10.1073/pnas.0805957106. [DOI] [PMC free article] [PubMed] [Google Scholar]
- 14.O’Nuallain B, Williams AD, Westermark P, Wetzel R. Seeding specificity in amyloid growth induced by heterologous fibrils. J Biol Chem. 2004;279:17490–17499. doi: 10.1074/jbc.M311300200. [DOI] [PubMed] [Google Scholar]
- 15.Tapiola T, Alafuzoff I, Herukka SK, Parkkinen L, Hartikainen P, Soininen H, Pirttila T. Cerebrospinal fluid β-amyloid 42 and tau proteins as biomarkers of Alzheimer type pathologic changes in the brain. Arch Neurol. 2009;66:382–389. doi: 10.1001/archneurol.2008.596. [DOI] [PubMed] [Google Scholar]
- 16.Sunderland T, Linker G, Mirza N, Putnam KT, Friedman DL, Kimmel LH, Bergeson J, Manetti GJ, Zimmermann M, Tang B, et al. Decreased β-amyloid1–42 and increased tau levels in cerebrospinal fluid of patients with Alzheimer disease. JAMA. 2003;289:2094–2103. doi: 10.1001/jama.289.16.2094. [DOI] [PubMed] [Google Scholar]
- 17.Perrin RJ, Fagan AM, Holtzman DM. Multimodal techniques for diagnosis and prognosis of Alzheimer’s disease. Nature. 2009;461:916–922. doi: 10.1038/nature08538. [DOI] [PMC free article] [PubMed] [Google Scholar]
- 18.Dreaden EC, Alkilany AM, Huang X, Murphy CJ, El-Sayed MA. The golden age: gold nanoparticles for biomedicine. Chem Soc Rev. 2012;41:2740–2779. doi: 10.1039/c1cs15237h. [DOI] [PMC free article] [PubMed] [Google Scholar]
- 19.Dreaden EC, Mackey MA, Huang X, Kang B, El-Sayed MA. Beating cancer in multiple ways using nanogold. Chem Soc Rev. 2011;40:3391–3404. doi: 10.1039/c0cs00180e. [DOI] [PMC free article] [PubMed] [Google Scholar]
- 20.Zhang M, Mao X, Yu Y, Wang CX, Yang YL, Wang C. Nanomaterials for reducing amyloid cytotoxicity. Adv Mater. 2013;25:3780–3801. doi: 10.1002/adma.201301210. [DOI] [PubMed] [Google Scholar]
- 21.Link S, El-Sayed MA. Optical properties and ultrafast dynamics of metallic nanocrystals. Annu Rev Phys Chem. 2003;54:331–366. doi: 10.1146/annurev.physchem.54.011002.103759. [DOI] [PubMed] [Google Scholar]
- 22.Burda C, Chen X, Narayanan R, El Sayed MA. Chemistry and properties of nanocrystals of different shapes. Chem Rev. 2005;105:1025–1102. doi: 10.1021/cr030063a. [DOI] [PubMed] [Google Scholar]
- 23.Underwood S, Mulvaney P. Effect of the solution refractive index on the color of gold colloids. Langmuir. 1994;10:3427–3430. [Google Scholar]
- 24.Elghanian R, Storhoff JJ, Mucic RC, Letsinger RL, Mirkin CA. Selective colorimetric detection of polynucleotides based on the distance-dependent optical properties of gold nanoparticles. Science. 1997;277:1078–1081. doi: 10.1126/science.277.5329.1078. [DOI] [PubMed] [Google Scholar]
- 25.Li H, Rothberg L. Colorimetric detection of DNA sequences based on electrostatic interactions with unmodified gold nanoparticles. Proc Natl Acad Sci USA. 2004;101:14036–14039. doi: 10.1073/pnas.0406115101. [DOI] [PMC free article] [PubMed] [Google Scholar]
- 26.Wang Z, Lévy R, Fernig DG, Brust M. Kinase-catalyzed modification of gold nanoparticles: A new approach to colorimetric kinase activity screening. J Am Chem Soc. 2006;128:2214–2215. doi: 10.1021/ja058135y. [DOI] [PubMed] [Google Scholar]
- 27.Hone DC, Haines AH, Russell DA. Rapid, quantitative colorimetric detection of a lectin using mannose-stabilized gold nanoparticles. Langmuir. 2003;19:7141–7144. [Google Scholar]
- 28.Cabaleiro-Lago C, Quinlan-Pluck F, Lynch I, Lindman S, Minogue AM, Thulin E, Walsh DM, Dawson KA, Linse S. Inhibition of amyloid β protein fibrillation by polymeric nanoparticles. J Am Chem Soc. 2008;130:15437–15443. doi: 10.1021/ja8041806. [DOI] [PubMed] [Google Scholar]
- 29.Linse S, Cabaleiro-Lago C, Xue W-F, Lynch I, Lindman S, Thulin E, Radford SE, Dawson KA. Nucleation of protein fibrillation by nanoparticles. Proc Natl Acad Sci USA. 2007;104:8691–8696. doi: 10.1073/pnas.0701250104. [DOI] [PMC free article] [PubMed] [Google Scholar]
- 30.Colvin VL, Kulinowski KM. Nanoparticles as catalysts for protein fibrillation. Proc Natl Acad Sci USA. 2007;104:8679–8680. doi: 10.1073/pnas.0703194104. [DOI] [PMC free article] [PubMed] [Google Scholar]
- 31.Shaw CP, Middleton DA, Volk M, Lévy R. Amyloid derived peptide forms self-assembled monolayers on gold nanoparticle with a curvature-dependent β-sheet structure. ACS Nano. 2012;6:1416–1426. doi: 10.1021/nn204214x. [DOI] [PubMed] [Google Scholar]
- 32.Yoo SI, Yang M, Brender JR, Subramanian V, Sun K, Joo NE, Jeong SH, Ramamoorthy A, Kotov NA. Inhibition of amyloid peptide fibrillation by inorganic nanoparticles: Functional similarities with proteins. Angew Chem Int Ed. 2011;50:5110–5115. doi: 10.1002/anie.201007824. [DOI] [PMC free article] [PubMed] [Google Scholar]
- 33.Fernández C, González-Rubio G, Langer J, Tardajos G, Liz-Marzán LM, Giraldo R, Guerrero-Martínez A. Nucleation of amyloid oligomers by RepA-WH1-prionoid-functionalized gold nanorods. Angew Chem Int Ed. 2016;55:11237–11241. doi: 10.1002/anie.201604970. [DOI] [PubMed] [Google Scholar]
- 34.Neely A, Perry C, Varisli B, Singh AK, Arbneshi T, Senapati D, Kalluri JR, Ray PC. Ultrasensitive and highly selective detection of Alzheimer’s disease biomarker using two-photon Rayleigh scattering properties of gold nanoparticle. ACS Nano. 2009;3:2834–2840. doi: 10.1021/nn900813b. [DOI] [PMC free article] [PubMed] [Google Scholar]
- 35.Ojha B, Liu H, Dutta S, Rao PP, Wojcikiewicz EP, Du D. Poly (4-Styrenesulfonate) as an Inhibitor of Aβ40 Amyloid Fibril Formation. J Phys Chem B. 2013;117:13975–13984. doi: 10.1021/jp4065467. [DOI] [PubMed] [Google Scholar]
- 36.Kumar S, Aaron J, Sokolov K. Directional conjugation of antibodies to nanoparticles for synthesis of multiplexed optical contrast agents with both delivery and targeting moieties. Nat Protoc. 2008;3:314–320. doi: 10.1038/nprot.2008.1. [DOI] [PubMed] [Google Scholar]
- 37.Liu H, Ojha B, Morris C, Jiang M, Wojcikiewicz EP, Rao PP, Du D. Positively charged chitosan and N trimethyl chitosan inhibit Aβ40 fibrillogenesis. Biomacromolecules. 2015;16:2363–2373. doi: 10.1021/acs.biomac.5b00603. [DOI] [PubMed] [Google Scholar]
- 38.Xia XR, Monteiro-Riviere NA, Riviere JE. An index for characterization of nanomaterials in biological systems. Nat Nanotechnol. 2010;5:671–675. doi: 10.1038/nnano.2010.164. [DOI] [PubMed] [Google Scholar]
- 39.Lundqvist M, Stigler J, Elia G, Lynch I, Cedervall T, Dawson KA. Nanoparticle size and surface properties determine the protein corona with possible implications for biological impacts. Proc Natl Acad Sci USA. 2008;105:14265–14270. doi: 10.1073/pnas.0805135105. [DOI] [PMC free article] [PubMed] [Google Scholar]
- 40.Wang A, Perera YR, Davidson MB, Fitzkee NC. Electrostatic interactions and protein competition reveal a dynamic surface in gold nanoparticle-protein adsorption. J Phys Chem C. 2016;120:24231–24239. doi: 10.1021/acs.jpcc.6b08469. [DOI] [PMC free article] [PubMed] [Google Scholar]
- 41.Wälti MA, Ravotti F, Arai H, Glabe CG, Wall JS, Böckmann A, Güntert P, Meier BH, Riek R. Atomic-resolution structure of a disease-relevant Aβ(1–42) amyloid fibril. Proc Natl Acad Sci USA. 2016;113:E4976–E4984. doi: 10.1073/pnas.1600749113. [DOI] [PMC free article] [PubMed] [Google Scholar]
- 42.Monopoli MP, Walczyk D, Campbell A, Elia G, Lynch I, Baldelli Bombelli F, Dawson KA. Physical–chemical aspects of protein corona: relevance to in vitro and in vivo biological impacts of nanoparticles. J Am Chem Soc. 2011;133:2525–2534. doi: 10.1021/ja107583h. [DOI] [PubMed] [Google Scholar]
- 43.Evanoff DD, Chumanov G. Synthesis and optical properties of silver nanoparticles and arrays. Chemphyschem. 2005;6:1221–1231. doi: 10.1002/cphc.200500113. [DOI] [PubMed] [Google Scholar]
- 44.Banerjee V, Das K. Interaction of silver nanoparticles with proteins: a characteristic protein concentration dependent profile of SPR signal. Colloids Surf B Biointerfaces. 2013;111:71–79. doi: 10.1016/j.colsurfb.2013.04.052. [DOI] [PubMed] [Google Scholar]
- 45.Harper JD, Lansbury PT. Models of amyloid seeding in Alzheimier’s disease and scrapie: Mechanistic truths and physiological consequences of the time-dependent solubility of amyloid proteins. Annu Rev Biochem. 1997;66:385–407. doi: 10.1146/annurev.biochem.66.1.385. [DOI] [PubMed] [Google Scholar]
- 46.Ferrone FA. Nucleation: The connections between equilibrium and kinetic behavior. Methods Enzymol. 2006;412:285–299. doi: 10.1016/S0076-6879(06)12017-0. [DOI] [PubMed] [Google Scholar]
- 47.Powers ET, Powers DL. Mechanisms of protein fibril formation: Nucleated polymerization with competing off-pathway aggregation. Biophys J. 2008;94:379–391. doi: 10.1529/biophysj.107.117168. [DOI] [PMC free article] [PubMed] [Google Scholar]
- 48.Mahmoudi M, Lynch I, Ejtehadi MR, Monopoli MP, Bombelli FB, Laurent S. Protein–nanoparticle interactions: opportunities and challenges. Chem Rev. 2011;111:5610–5637. doi: 10.1021/cr100440g. [DOI] [PubMed] [Google Scholar]
- 49.Liao YH, Chang YJ, Yoshiike Y, Chang YC, Chen YR. Negatively charged gold nanoparticles inhibit Alzheimer’s amyloid-β fibrillization, induce fibril dissociation, and mitigate neurotoxicity. Small. 2012;8:3631–3639. doi: 10.1002/smll.201201068. [DOI] [PubMed] [Google Scholar]
- 50.Zhang D, Neumann O, Wang H, Yuwono VM, Barhoumi A, Perham M, Hartgerink JD, Wittung Stafshede P, Halas NJ. Gold nanoparticles can induce the formation of protein based aggregates at physiological pH. Nano Lett. 2009;9:666–671. doi: 10.1021/nl803054h. [DOI] [PubMed] [Google Scholar]
- 51.Cabaleiro-Lago C, Quinlan-Pluck F, Lynch I, Dawson KA, Linse S. Dual effect of amino modified polystyrene nanoparticles on amyloid β protein fibrillation. ACS Chem Neurosci. 2010;1:279–287. doi: 10.1021/cn900027u. [DOI] [PMC free article] [PubMed] [Google Scholar]
- 52.Saraiva AM, Cardoso I, Pereira MC, Coelho MA, Saraiva MJ, Möhwald H, Brezesinski G. Controlling amyloid β peptide (1–42) oligomerization and toxicity by fluorinated nanoparticles. ChemBioChem. 2010;11:1905–1913. doi: 10.1002/cbic.201000237. [DOI] [PubMed] [Google Scholar]
- 53.O’Brien EP, Straub JE, Brooks BR, Thirumalai D. Influence of nanoparticle size and shape on oligomer formation of an amyloidogenic peptide. J Phys Chem Lett. 2011;2:1171–1177. doi: 10.1021/jz200330k. [DOI] [PMC free article] [PubMed] [Google Scholar]
- 54.Garai K, Frieden C. Quantitative analysis of the time course of Aβ oligomerization and subsequent growth steps using tetramethylrhodamine labeled Aβ. Proc Natl Acad Sci USA. 2013;110:3321–3326. doi: 10.1073/pnas.1222478110. [DOI] [PMC free article] [PubMed] [Google Scholar]
- 55.Ma B, Nussinov R. Stabilities and conformations of Alzheimer’s β amyloid peptide oligomers (Aβ16–22, Aβ16–35, and Aβ10–35): sequence effects. Proc Natl Acad Sci USA. 2002;99:14126–14131. doi: 10.1073/pnas.212206899. [DOI] [PMC free article] [PubMed] [Google Scholar]
- 56.Williams AD, Shivaprasad S, Wetzel R. Alanine scanning mutagenesis of Abeta(1–40) amyloid fibril stability. J Mol Biol. 2006;357:1283–1294. doi: 10.1016/j.jmb.2006.01.041. [DOI] [PubMed] [Google Scholar]
- 57.Liu J, Mazumdar D, Lu Y. A simple and sensitive “dipstick” test in serum based on lateral flow separation of aptamer–linked nanostructures. Angew Chem Int Ed. 2006;45:7955–7959. doi: 10.1002/anie.200603106. [DOI] [PubMed] [Google Scholar]
- 58.Huang YF, Chang HT, Tan W. Cancer cell targeting using multiple aptamers conjugated on nanorods. Anal Chem. 2008;80:567–572. doi: 10.1021/ac702322j. [DOI] [PubMed] [Google Scholar]
Associated Data
This section collects any data citations, data availability statements, or supplementary materials included in this article.


