Abstract
The Hodgkin/Reed–Sternberg cells of classical Hodgkin lymphoma (HL) are characterised by the aberrant activation of multiple signalling pathways. Here we show that a subset of HL displays altered expression of sphingosine-1-phosphate (S1P) receptors (S1PR)s. S1P activates phosphatidylinositide 3-kinase (PI3-K) in these cells that is mediated by the increased expression of S1PR1 and the decreased expression of S1PR2. We also showed that genes regulated by the PI3-K signalling pathway in HL cell lines significantly overlap with the transcriptional programme of primary HRS cells. Genes upregulated by the PI3-K pathway included the basic leucine zipper transcription factor, ATF-like 3 (BATF3), which is normally associated with the development of dendritic cells. Immunohistochemistry confirmed that BATF3 was expressed in HRS cells of most HL cases. In contrast, in normal lymphoid tissues, BATF3 expression was confined to a small fraction of CD30-positive immunoblasts. Knockdown of BATF3 in HL cell lines revealed that BATF3 contributed to the transcriptional programme of primary HRS cells, including the upregulation of S1PR1. Our data suggest that disruption of this potentially oncogenic feedforward S1P signalling loop could provide novel therapeutic opportunities for patients with HL.
Introduction
Sphingosine-1-phosphate (S1P) is a bioactive sphingolipid metabolite implicated in cancer growth, survival and invasion.1, 2 S1P is generated by the enzyme, sphingosine kinase 1 (SPHK1), which is overexpressed in different cancer types, including some non-Hodgkin lymphoma.3 Conversely, sphingosine-1-phosphate phosphatase (SGPP1), which degrades S1P, is downregulated during tumour development and progression.4, 5, 6 Although the overproduction of S1P is a characteristic of many cancers, the biological responses to S1P are governed by binding and activation of five cell surface S1P receptors (S1PR1–5), each coupling to a different repertoire of G proteins. In B cells, S1PR1 mediates mitogenic/prosurvival and chemotactic S1P functions by coupling to Gi to activate Ras/ERK, phosphatidylinositide 3-kinase (PI3-K)/Akt and Rac,7, 8, 9 whereas S1PR2 couples to G12/13 to inhibit PI3-K/Akt activity leading to reduced cell growth, survival and migration.10, 11, 12, 13, 14 S1PR1 has previously been reported to be overexpressed in Hodgkin/Reed–Sternberg (HRS) cells and to promote their migration in vitro.15 In contrast, S1PR2 may be a tumour suppressor in B-cell lymphomas; previous studies show that S1PR2 is mutated in a subset of human diffuse large B-cell lymphoma and that mice lacking S1PR2 expression develop diffuse large B-cell lymphoma.16, 17
Here we show that HRS cells are characterised by high expression of SPHK1 and S1PR1, but do not express S1PR2. This leads to enhanced PI3-K activation in response to S1P and to the increased expression of the dendritic cell transcription factor (TF), basic leucine zipper TF, ATF-like 3 (BATF3).18,19 In turn, BATF3 contributes to the transcriptional programme of Hodgkin lymphoma (HL), including the increased expression of S1PR1. Interrupting this BATF3-regulated feedforward loop, for example, by targeting S1PR1, could provide novel therapies for HL patients.
Materials and methods
Cells and tissues
Paediatric tonsils and tumour samples were obtained with informed consent under local ethics committee approval (06/Q2702/50; REC_RG_HBRC_12-071). Germinal center (GC) B cells were isolated and characterised as described earlier.20, 21, 22 Isolation of blood-derived B cells and preparation of lymphoblastoid cell lines were described before21, 22, 23 and are detailed in Supplementary Materials and Methods. KMH2, L428, L1236 and L540 are Epstein–Barr virus (EBV)-negative HL cell lines and L591 is an EBV-positive HL cell line. DG75 is an EBV-negative Burkitt lymphoma cell line. HEK293 is derived from human embryonic kidney. Cell lines were cultured at 37 °C in 5% CO2 in either RPMI-1640 or DMEM (HEK293) with 10% foetal calf serum and 1% penicillin–streptomycin (all ThermoFisher Scientific, Waltham, MA, USA).
S1P measurements
For measurement of S1P levels in cell lines and B cells, lipids were extracted and sphingolipids quantified by liquid chromatography-electrospray ionisation-tandem mass spectrometry (4000 QTRAP; AB Sciex, Framingham, MA, USA) as described previously.24
Treatment of cells
Preparation of S1P (Sigma-Aldrich, St Louis, MI, USA) is detailed in Supplementary Materials and Methods. For S1P treatment, KMH2 cells were washed two times, incubated in serum-free media for 1h, followed by the addition of 1 μM S1P. S1P receptor functional antagonists, Ozanimod (RPC1063; Selleckchem, Munich, Germany) or Siponimod (BAF312; Selleckchem), were added to cells 1 h before stimulation with S1P for 15 min. For measurement of viability, cells were stained using FITC Annexin V Apoptosis Detection Kit I (BD Pharmingen, Franklin Lakes, NJ, USA) and analysed by flow cytometry. For Akt inhibition, cells were cultivated in 10% foetal calf serum media with 1μm Ipatasertib (GDC-0068; Selleckchem) or vehicle (dimethyl sulfoxide) for 6 h. Cell-Titer Glo assay (Promega, Fitchburg, WI, USA) showed no cell death at this time point.
For PI3-K inhibition, cells were cultivated in 10% foetal calf serum media with 30 μM LY294002 or vehicle (dimethyl sulfoxide). We have previously shown that LY294002 does not cause significant cell death at the time points and concentration used.25
Gene expression in KMH2 cells following 16 h of LY294002/vehicle treatment was analysed with Affymetrix HG-Focus Arrays (data available from GSE89759, ThermoFisher Scientific). The data was background subtracted and quantile normalised26, 27 using the affy package of Bioconductor. Differentially expressed genes were identified using limma28 (P<0.05, absolute fold change >1.2). Probe sets with ‘Negative Strand Matching Probes’ were removed from the significant gene list. Gene ontology (GO) analysis was performed using DAVID 6.7 (http://david.abcc.ncifcrf.gov) using GO-term BP-FAT; P<0.01, ⩾1.3-fold enrichment.
BATF3 knockdown
BATF3 knockdown was performed by nucleofection with Silencer Select s195280 BATF3 siRNA or Silencer Select Negative Control No. 1 siRNA (ThermoFisher Scientific). At 48h after BATF3 knockdown in L428 cells, samples were hybridised to Affymetrix PrimeView Arrays (data available from GSE89760, ThermoFisher Scientific) and data were analysed as described above.
Reanalysis of publicly available data sets is described in Supplementary Materials and Methods. χ2 test was used to identify significant enrichment or depletion of either PI3-K or BATF3 target genes in these data sets using a threshold for significance of P<0.05.
Transfection of cells
GC B cells were nucleofected with pcDNA3.1-PRDM1 or empty vector, cultivated and enriched as before.20, 21 HL cell lines and DG75 cells were transfected by Nucleofection (Lonza, Basel, Switzerland) and HEK293 cells were transfected by Lipofectamine (ThermoFisher Scientific) using the following vectors and corresponding controls: pcDNA3.1-S1PR2-HA (UMR cDNA Resource Center University of Missouri-Rolla, Rolla, MO, USA), pSG5-myc-p110α-CAAX (Julian Downward, Addgene, Cambridge, MA, USA), Akt1/PKBα cDNA (activated) in pUSEamp containing a MYC tag (Merck Millipore, Billerica, MA, USA), pcDNA3.1- S1PR1 (Dr Ian Paterson, University of Malaya, Kuala Lumpur, Malaysia) and pCMV6-SPHK1 (Origene technologies, Rockville, MD, USA).
Quantitative RT-PCR
RNA was extracted with RNeasy Mini/Micro Kit including genomic DNA removal with RNase-Free DNase Set (Qiagen, Hilden, Germany). cDNA was generated with qScript cDNA SuperMix (VWR International, Radnor, PA, USA). Gene transcripts were quantified with commercial assays (Supplementary Table S1A; ThermoFisher Scientific) as before.21 The 2−ΔCt method was used to quantify target expression relative to glyceraldehyde 3-phosphate dehydrogenase housekeeping control (unless specified otherwise).
Immunoblotting
Immunoblotting was performed with the primary antibodies detailed in Supplementary Table S1B and following standard techniques described in Supplementary Materials and Methods.
Immunohistochemistry
Immunohistochemistry (IHC) was performed as before.29, 30 Slides were blocked in 5x casein followed by primary antibody in 0.05% PBS/Tween (Supplementary Table S1C). Multiplex immunofluorescence (IF) was performed using Opal 7-Plex Kit (NEL791001KT; Perkin-Elmer, Waltham, MA, USA). For antibody stripping between each step, slides were microwaved in pH6 citrate buffer, with controls omitting individual antibody steps to ensure adequate stripping. Slides were scanned using wide-range wavelength covering filters available in Vectra system 3.0.3 (Perkin-Elmer) (for dyes-cyanine 5, cyanine 3, DAPI, Texas Red, fluorescein). Antibodies were optimised with autoexposure adjustment (100–150 ms). Images were taken on Olympus BX-51WI microscope (Olympus, Tokyo, Japan) with x10, x20 and x40 magnification. Multispectral images were analysed using InForm Automated Image Analysis software version 2.2.1 (Perkin-Elmer) for phenotyping and quantification of coexpressed markers. Analysis was performed with a x20 objective on a minimum of three fields for cytospin preparations and five fields for tissue sections. For assessment of protein expression following S1P treatment, the mean intensity and standard deviation were calculated for each of three fields separately and statistical significance was measured using Fisher's exact test. For image analysis of tissue microarray we used the 1x1 function covering ~75% of each core. Positivity in IHC was assessed with x40 objective using the whole tissue microarray area, or 10 representative high power fields in the case of whole sections. To directly compare our results with those previously reported by Kluk et al.,15 S1PR1 was scored as positive if ⩾25% of cells expressed S1PR1. The same cutoff was applied for all other markers. Validation of the specificity of SPHK1, S1PR1, S1PR2 and BATF3 antibodies is shown in Supplementary Figure S1.
Results
Expression of SPHK1, SGPP1 and S1P receptors in HRS cells
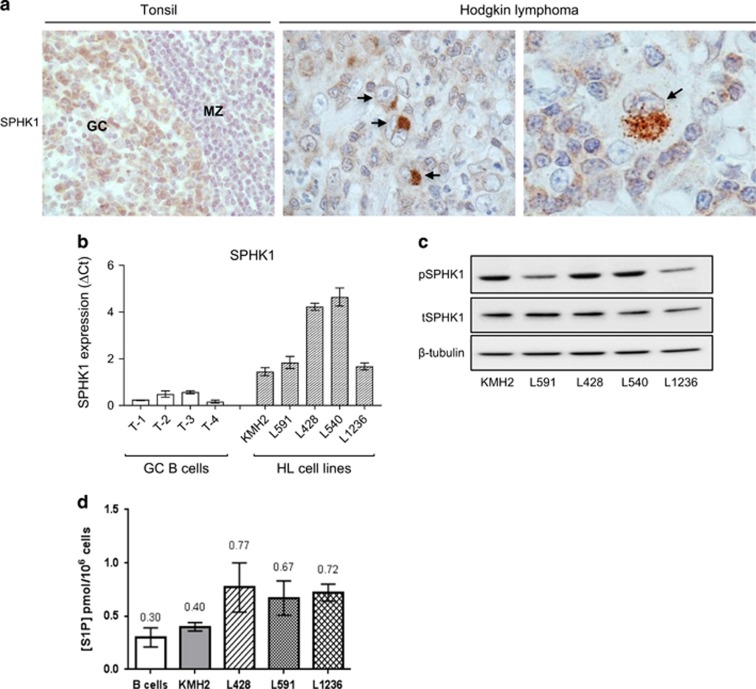
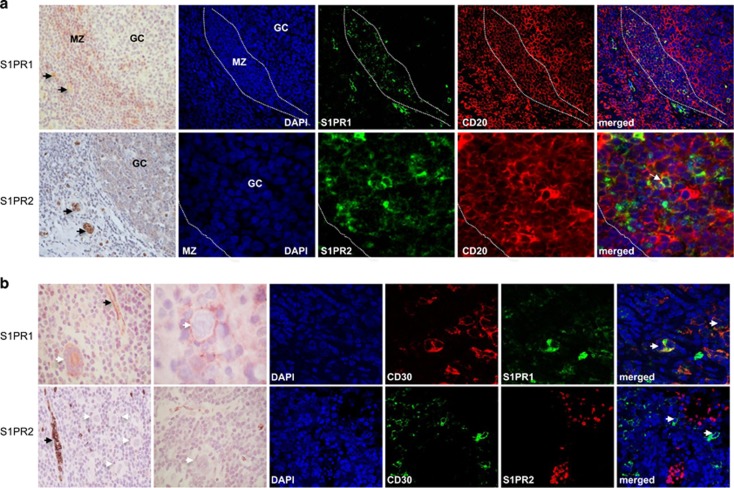
We first studied the expression of SPHK1 and SGPP1, enzymes important for regulating S1P levels.3, 4, 5 We showed that SPHK1 was expressed in both normal GC B cells and in HRS cells in most cases (49/58; Figure 1a and Supplementary Table S2). Owing to the lack of an internal positive control we could not reliably quantify SPHK1 expression by IHC. Therefore, we reanalysed a microarray data set that compared global gene expression in B-cell lymphomas with that in normal B-cell subsets.31 This revealed significantly higher SPHK1 mRNA in microdissected HRS cells compared with isolated GC B cells (Supplementary Figure S2A). Reanalysis of a second independent microarray data set32 revealed higher expression of SPHK1 mRNA in both EBV-negative and EBV-positive HRS cells compared with microdissected GCs (Supplementary Figure S2B). Quantitative PCR showed that SPHK1 mRNA expression was also higher in HL cell lines than in GC B cells (Figure 1b). We next used immunoblotting to show that SPHK1 was constitutively activated in HL cell lines (Figure 1c). Conversely, SGPP1 mRNA was decreased in primary HRS cells and HL cell lines compared with normal GC B cells (Supplementary Figure S3). Indeed, S1P levels measured by mass spectrometry were higher in HL cells than in normal B cells (Figure 1d). We next studied the expression of S1PR1 and S1PR2. We showed that normal GC B cells expressed S1PR2, but not S1PR1 (Figure 2a and Supplementary Figure S4). In comparison, HRS cells frequently expressed S1PR1 (36/61), but not S1PR2 (2/61), an observation we confirmed by multiplex staining with CD30 (Figure 2b, Supplementary Figure S5 and Supplementary Table S2). We conclude that in contrast to their normal counterparts, HRS cells express high levels of SPHK1 and S1PR1 but lack expression of S1PR2 and SGPP1.
Figure 1.
Expression of SPHK1 in normal lymphoid tissues and HRS cells. (a) SPHK1 expression in GC B cells and primary HL. Black arrows show HRS cells. (b) SPHK1 mRNA and (c) protein expression in HL cell lines. T1-4 are GC B cells isolated from four donors. Note: SPHK1 is phosphorylated in all HL cell lines. (d) S1P levels in HL cell lines and B cells (mean of three different donors) measured by mass spectrometry. GC, germinal center; MZ, mantle zone.
Figure 2.
Expression of S1PR1 and S1PR2 in normal lymphoid tissues and HRS cells. (a) Normal tonsil. Upper panels: S1PR1 expression in MZ B cells, but not in GC B cells, confirmed by costaining for CD20. Lower panels: S1PR2 was expressed in normal GC B cells, confirmed by costaining with CD20 (white arrow) and BCL6 (Supplementary Figure S4). (b) HRS cells expressed S1PR1 but not S1PR2 (white arrows) confirmed by CD30 costaining. Endothelial cells and red blood cells were strongly positive for S1PR1 and S1PR2, respectively (black arrows). Further examples of S1PR1 staining in HRS cells indicating the presence of both membrane and cytoplasmic staining are shown in Supplementary Figure S5.
S1P-induced PI3-K signalling in HRS cells is mediated by the differential expression of S1P receptors
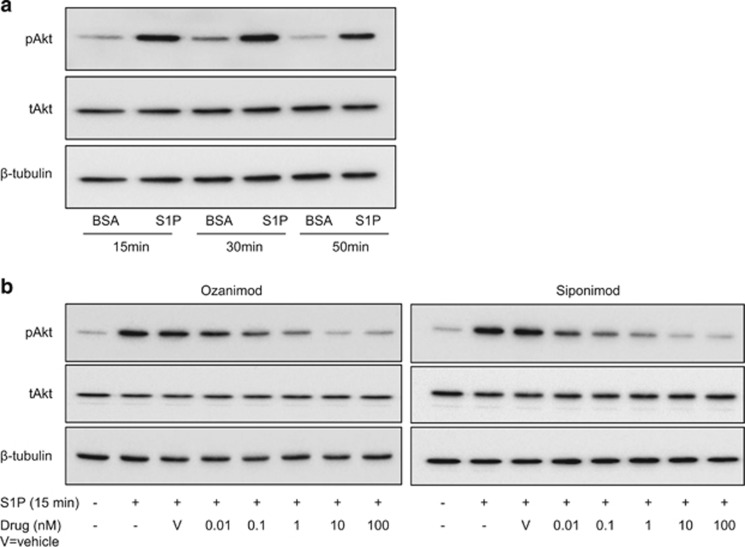
We next studied the effects of S1P on PI3-K signalling in HRS cells using Akt phosphorylation as a readout. We chose the KMH2 cell line for these experiments because it expresses S1PR1 and only low levels of S1PR2 in the absence of the other S1P receptors (Supplementary Figures S6A and B). We observed that the addition of S1P increased Akt phosphorylation in KMH2 cells (Figure 3a). To examine the effect of S1PR1 on Akt phosphorylation, we stimulated KMH2 cells with S1P after targeting S1PR1 (and S1PR5) with their functional antagonists Ozanimod and Siponimod.33, 34 The addition of either drug 1h before treatment with S1P decreased Akt phosphorylation in a dose-dependent manner (Figure 3b). Furthermore, Ozanimod significantly reduced the viability of KMH2, L428 and L591 cells, while Siponimod reduced the viability of KMH2 and L428 cells (Supplementary Figure S7). L1236 was resistant to both drugs. To study the effect of S1PR2, we transfected KMH2 cells with an S1PR2-HA expression vector and used IF to detect phospho-Akt and the HA tag. Cells ectopically expressing S1PR2 were significantly more likely to be phospho-Akt negative than HA-negative cells in the same transfected population, an effect we observed with (P<0.0001; Supplementary Figure S8) and without (P<0.0001; not shown) the addition of exogenous S1P. Taken together, our data suggest that binding of S1P to S1PR1 can activate PI3-K signalling in HRS cells.
Figure 3.
S1P activates Akt in HRS cells mediated by differential expression of S1P receptors. (a) Immunoblot of KMH2 cells following S1P stimulation and (b) following 1 h pre-treatment with increasing concentrations of Ozanimod or Siponimod.
Expression of the TF, BATF3, is regulated by PI3-K signalling in HRS cells
To identify the transcriptional targets of PI3-K signalling pathway in HL cells, we used the pan-PI3-K inhibitor LY294002. KMH2 cells were treated with LY294002 for 16 h under conditions that do not affect viability.25 The addition of LY294002 for 16 h was followed by the upregulation of 694 genes and the downregulation of 330 genes (Supplementary Table S3). We validated a number of PI3-K targets genes in KMH2, and also in L428, L591 and L1236 cells (Supplementary Figure S9).
Reanalysis of GSE12453(ref. 31) identified 743 genes upregulated and 622 genes downregulated in microdissected HRS cells compared with normal centrocytes (Supplementary Table S4). Genes upregulated in HRS cells (odds ratio (OR)=2.15; P<0.0001), but not those downregulated in HRS cells (OR=1.00; P=0.96), were significantly enriched in genes downregulated following PI3-K inhibition. Similarly, genes downregulated in HRS cells (OR=2.95; P<0.0001), but not those upregulated in HRS cells (OR=1.28; P=0.056), were significantly enriched in genes upregulated following PI3-K inhibition (Supplementary Figure S10 and Supplementary Table S5). These data indicate that the activation of PI3-K signalling pathway contributes to the transcriptional programme of HRS cells. We next wanted to establish if this was also the case for both the EBV-positive and EBV-negative forms of HL. To do this, we reanalysed data from the second published microarray that had compared gene expression in microdissected HRS cells with that in microdissected normal GCs and which had reported EBV status for a subset of cases GSE39133.32 The transcriptional targets of PI3-K signalling we had identified in primary HRS cells were significantly enriched in those genes differentially expressed in both EBV-positive and EBV-negative HRS cells (Supplementary Figure S10 and Supplementary Tables S6–S9).
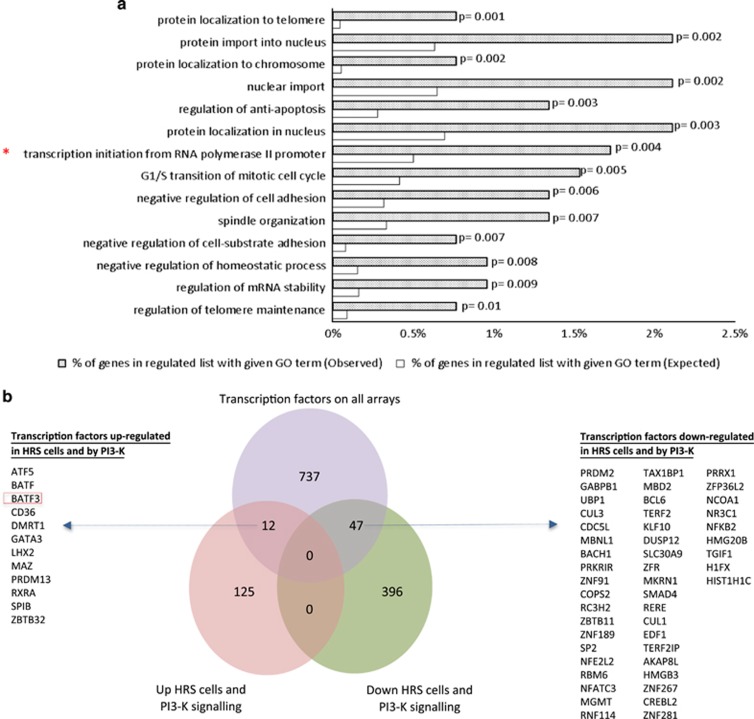
A GO analysis revealed that genes regulated by the PI3-K signalling pathway in primary HRS cells were enriched for those with a function in ‘transcription initiation from RNA polymerase II promoter’, suggesting that PI3-K signalling might contribute to the aberrant expression of TFs observed in HRS cells (Figure 4a). To identify relevant TF targets, we compared genes regulated by PI3-K signalling in primary HRS cells with a comprehensive set of TFs described by Vaquerizas et al.35 This revealed the upregulation of 12 TFs, and the downregulation of 47 TFs by PI3-K signalling in HRS cells (Figure 4b). They included the dendritic cell TF, BATF3,18, 19 which was previously reported to be overexpressed at the mRNA level in HRS cells36, 37 and which was also the PI3-K regulated gene most highly upregulated in the reanalysis of global gene expression in primary HRS cells described above.31, 32 We confirmed that LY294002 downregulated BATF3 expression in HL cell lines (Supplementary Figures S11A and B). Furthermore, the pan-Akt inhibitor, Ipatasertib, also decreased BATF3 expression (Supplementary Figure S11C). To confirm these were not off-target effects, we transfected KMH2 cells with a MYC-tagged plasmid containing a constitutively active p110 or Akt1 gene and performed IF, titrating the MYC antibody to detect only exogenous MYC. We found that a larger proportion of cells ectopically expressing either p110 (Supplementary Figure S11D) or Akt1 (not shown) were significantly more likely to be both phospho-Akt- and BATF3-positive (P<0.0001) than were untransfected cells. Taken together, our data show that activation of the PI3-K/Akt signalling pathway leads to aberrant BATF3 expression in HL.
Figure 4.
PI3-K signalling upregulates BATF3 in HRS cells. (a) GO analysis of genes regulated by PI3-K signalling in primary HRS cells (GSE12453(ref. 31) or GSE39133(ref. 32) data or both; total of 137 upregulated and 443 downregulated genes) revealed enrichment of several functions including ‘transcription initiation from RNA polymerase II promoter’. (b) Comparison of genes regulated by PI3-K signalling in primary HRS cells with a comprehensive set of TFs revealed the upregulation of 12 TFs and the downregulation of 47 TFs by PI3-K signalling in HRS cells.
BATF3 overexpression contributes to the transcriptional programme of HRS cells
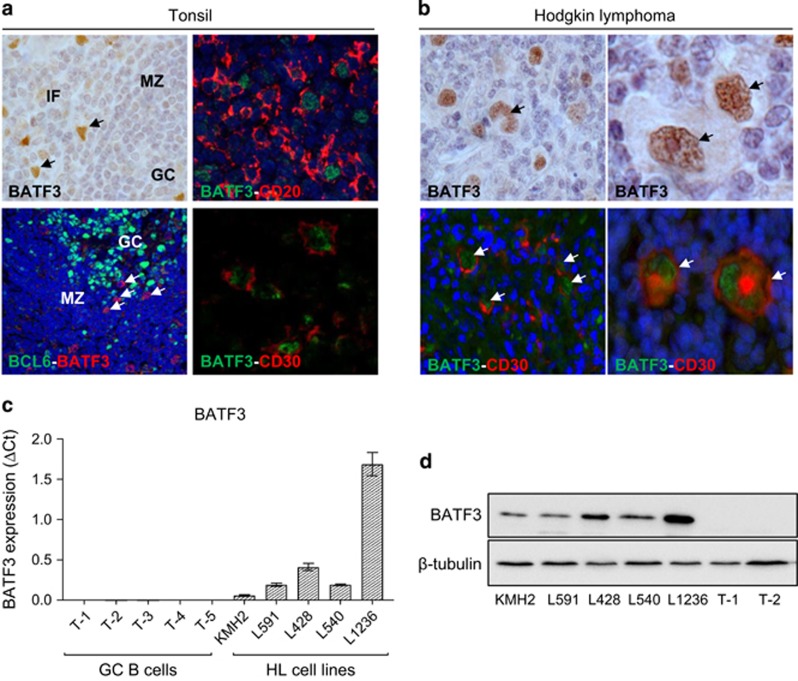
We confirmed that BATF3 mRNA expression was higher in microdissected HRS cells compared with normal B cells (Supplementary Figure S12A) and in both EBV-positive and EBV-negative HRS cells compared with microdissected GCs (Supplementary Figure S12B). IHC of normal lymphoid tissues revealed that BATF3 protein was not present in GC B cells and only rarely in extrafollicular CD20-positive cells, which were also CD30-positive (Figure 5a). In contrast, BATF3 protein was strongly expressed in both EBV-positive (7/10) and EBV-negative (29/42) HRS cells (Supplementary Table S10) confirmed by CD30 costaining (Figure 5b), and in HL lines (Figures 5c and d). BATF3 expression was also increased after EBV infection of B cells (Supplementary Figure S13).
Figure 5.
BATF3 is overexpressed in HRS cells. (a) IHC of normal tonsil. BATF3-positive cells were mainly located outside the GC, of which some expressed CD20 and CD30 but not BCL6 (arrowed). (b) BATF3 expression in CD30-positive HRS cells (arrowed). (c) BATF3 mRNA and (d) protein expression in HL cell lines. T1-T5 are GC B cells isolated from five donors. IF, interfollicular; MZ, mantle zone.
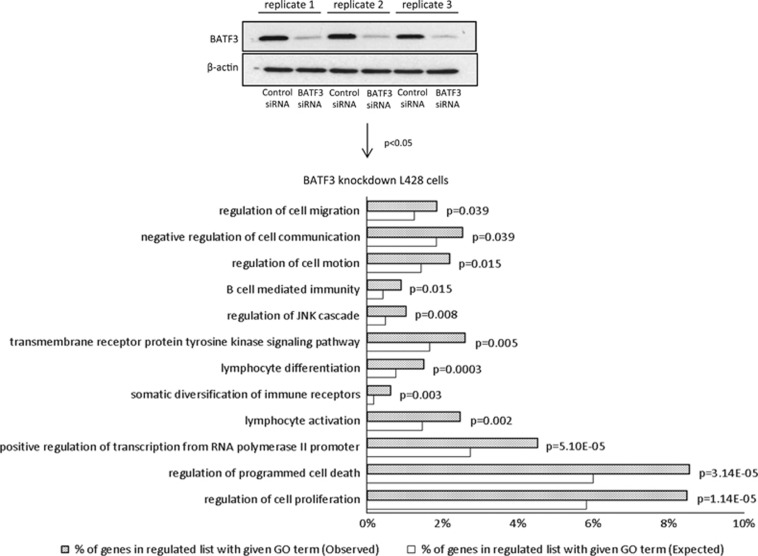
A microarray analysis following BATF3 knockdown in L428 cells revealed the upregulation of 960 genes and the downregulation of 1066 genes (Supplementary Table S11A and B). Taking genes only present on the Primeview platform (ThermoFisher Scientific) and also on GSE12453,31 we found that genes downregulated by BATF3 were significantly enriched in genes downregulated in primary HRS cells (OR=1.8; P<0.0001). A GO analysis of BATF3 target genes revealed the enrichment of a number of HL-related GO terms, which included ‘lymphocyte differentiation’, ‘somatic diversification of immune receptors’, ‘regulation of cell motion’, ‘positive regulation of transcription from RNA polymerase II promoter’ and ‘B-cell-mediated immunity’ (Figure 6a). We validated several BATF3 targets within different functional groups including genes downregulated (JUN, FOS, ATF3, EGR1, EGR2, PTPRC, CASP7, CASP14, RGS1, RGS16) and genes upregulated (BACH2, STAT5B, CXCL16) by BATF3 (Supplementary Figure S14). We noted that BATF3 decreased the expression of PRDM1, which encodes BLIMP1 (Supplementary Figure S14), a TF downregulated in HRS cells and which is essential for plasma cell differentiation.21, 38, 39, 40, 41 Interrogation of our previous microarray data set,21 which described the transcriptional changes that follow the expression of BLIMP1 in primary GC B cells, also revealed a reciprocal regulation of BATF3 by BLIMP1 (Supplementary Figure S15A). We confirmed the downregulation of BATF3 by BLIMP1 by quantitative PCR analysis of a further three donors (Supplementary Figure S15B). These data show that the overexpression of BATF3 contributes to the aberrant transcriptional programme of HRS cells, including the downregulation of BLIMP1.
Figure 6.
BATF3 overexpression contributes to the transcriptional programme of HRS cells. GO analysis of BATF3 targets in L428 cells. Immunoblotting shows knockdown of BATF3 in L428 cells.
BATF3 upregulates S1PR1 expression
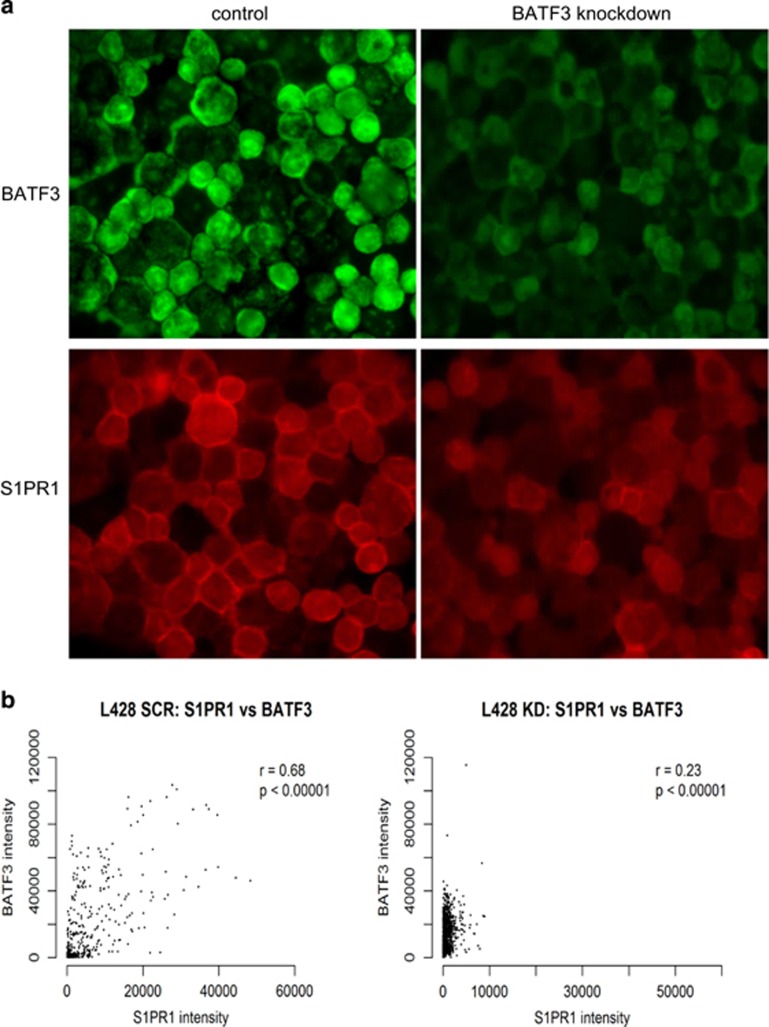
The knockdown of BATF3 significantly decreased S1PR1 mRNA and protein levels in L428, L1236 and KMH2 cells (all P<0.0001; Figure 7a and Supplementary Figure S16). In control and BATF3- siRNA-treated cells (P<0.0001; Figure 7b) as well as in untreated cells (Supplementary Table S12), BATF3 and S1PR1 levels were also significantly correlated at the single-cell level. Next, we wanted to show that this pathway was directly regulated by S1P. To do this, we treated the HL cell lines with S1P or control (bovine serum albumin) for 24 h and measured the levels of phospho-Akt, BATF3 and S1PR1 by IF. S1P significantly increased the levels of phospho-Akt, BATF3 and S1PR1 in L428, KMH2 and L591 cells (Supplementary Figure S17). This regulation could be observed at the single-cell level because S1P-treated cells were significantly more likely to coexpress phospho-Akt, BATF3 and S1PR1 (all P<0.0001; not shown). S1P did not increase the expression of phospho-Akt and BATF3 in L1236 cells, most likely owing to the very high constitutively activated Akt in these cells and in keeping with their resistance to S1PR1 inhibition described above. Finally, we measured BATF3 and S1PR1 expression in primary HRS cells. We found that BATF3-positive primary HL cases were significantly more likely to be S1PR1-positive than BATF3-negative HL cases (P=0.0006; Supplementary Figure S18A and Supplementary Table S10). Single-cell image analysis of six representative HL cases showed that BATF3-positive HRS cells within each case were also significantly more likely to be S1PR1-positive than were BATF3-negative cells (Supplementary Figure S18B). Taken together, our results suggest the existence of a feedforward S1P signalling loop that drives constitutive BATF3 expression leading to aberrant transcription in HRS cells.
Figure 7.
BATF3 regulates S1PR1 expression. Lower levels of S1PR1 protein were observed following BATF3 knockdown in L428 cells (P<0.0001) shown here by IF (a) and confirmed by single-cell image analysis (b). BATF3 knockdown also significantly decreased S1PR1 protein in L1236 and KMH2 cells (both P<0.0001; not shown).
Discussion
Here we show that HRS cells express BATF3, a TF that is important for the development of CD8α+ classical dendritic cells18 and related non-lymphoid CD103+CD11b− dendritic cells.19 Reanalysis of existing global expression data sets and IHC showed that BATF3 expression was significantly higher in primary HRS cells compared with normal B cells. Our data also revealed that BATF3 is regulated by PI3-K/Akt signalling, a pathway we and others have shown is constitutively activated in HRS cells.25, 42, 43
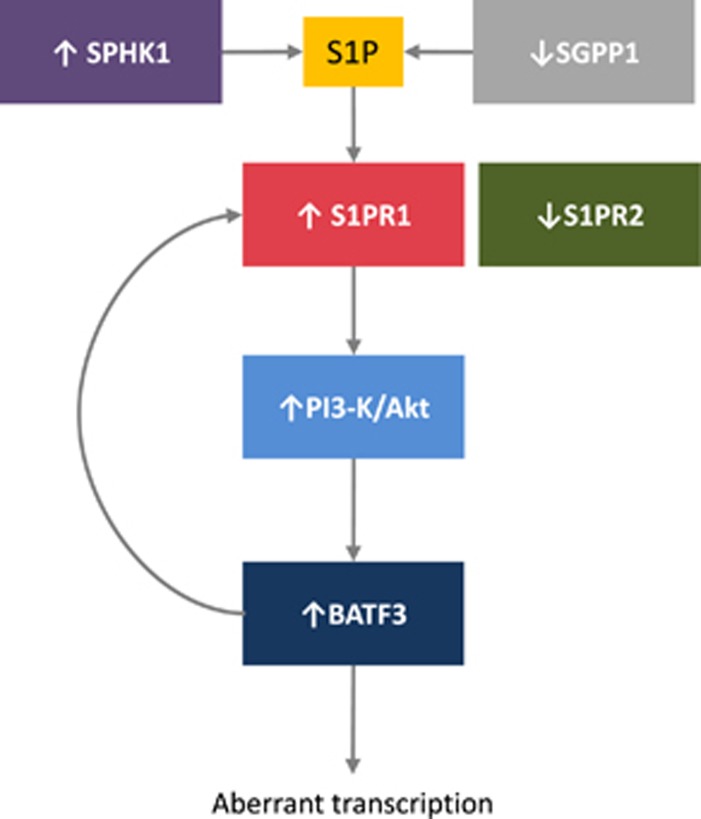
We also showed that the PI3-K/Akt signalling pathway is regulated by S1P in HRS cells and that this is dependent on the increased expression of S1PR1 together with the decreased expression of S1PR2. The upregulation of S1PR1 in HRS cells has been reported before,15 albeit in only 7/57 cases, a lower proportion than we have reported here, despite the fact that we used the same cutoff employed by Kluk et al.15 Our observation that BATF3 induces the expression of S1PR1 identifies a feedforward loop, which leads to constitutive S1P signalling, activation of the PI3-K/Akt pathway and sustained BATF3 transcriptional activity (Figure 8). The major source of the S1P necessary to sustain this loop is likely to be the HRS cells, as they express SPHK1 in the absence of the S1P phosphatase, SGPP1. The feedforward loop described here could be important for the pathogenesis of HL as it has been shown that the knockdown of BATF3 significantly reduces the survival of HL cell lines44 and that BATF3 can induce B-cell lymphomas in a murine model (Weiser et al, personal communication).
Figure 8.
Proposed model for the regulation of BATF3 by S1P signalling in HRS cells. S1P levels are regulated by SPHK1, which is upregulated in HRS cells and catalyses S1P production, and SGPP1, which is downregulated in HRS cells and degrades S1P. S1P acts on the S1P receptor, S1PR1 and in the absence of S1PR2 this drives the PI3-K/Akt signalling pathway leading to increased BATF3 expression and downstream aberrant transcription. S1PR1 expression is increased by BATF3 leading to a feedforward loop to sustain S1P signalling and constitutive BATF3 transcription.
Our studies revealed that BATF3 downregulated expression of PRDM1, which encodes BLIMP1, a TF required for plasma cell differentiation and which is either mutated or transcriptionally downregulated in B-cell lymphomas, including HL.21, 38, 39, 40, 41 BLIMP1 also decreased the expression of BATF3, indicating a reciprocal regulation of BATF3 and BLIMP1. Furthermore, BATF3 increased the expression of BACH2, which encodes a TF known to delay BLIMP1 expression and plasma cell differentiation in mouse lymphocytes.45, 46 These data suggest that the constitutive expression of BATF3 could be important for the suppression of terminal B-cell differentiation in HRS cell progenitors.
In keeping with the reported downregulation of AP-1 signalling by BATF3,47 we observed that BATF3 decreased the transcription of the key AP-1 components, JUN, FOS and ATF3. Furthermore, we showed that BATF3 regulated many other transcriptional changes characteristic of HRS cells. These included PTPRC (CD45), an essential regulator of BCR signalling48, 49 as well as STAT5B, NOTCH1 and EGR1, encoding TFs known to be aberrantly expressed in HRS cells.50, 51, 52, 53
In a reanalysis of the BATF3 targets reported by Lollies et al.44 (using the same cutoff as in our array, but using short hairpin RNA and different time point), we found that genes upregulated (OR=1.62; P=0.003), but not those downregulated (OR=0.96; P=0.89), by BATF3 in our array were significantly enriched in those genes upregulated by BATF3 in Lollies et al.44 Similarly, genes downregulated (OR=2.7; P<0.00001), but not those upregulated (OR=0.82; P=0.37), by BATF3 in our array were significantly enriched in those genes downregulated by BATF3 in Lollies et al.44 It is noteworthy that S1PR1 was among those genes significantly upregulated by BATF3 in Lollies et al.44
Both EBV-positive and EBV-negative HRS cells expressed BATF3, consistent with our observation that BATF3 expression was increased by in vitro EBV infection. Because the EBV lytic cycle has been shown to be induced upon terminal B-cell differentiation54 leading to viral replication and cell death, the increased BATF3 expression observed in EBV-infected tumour cells could be important for suppression of the lytic cycle, in turn preventing replication-induced cell death. In keeping with this, several of the BATF3 targets we identified (for example, AP-1 components, EGR1, PRDM1) are known to induce the EBV lytic cycle.21, 55, 56, 57, 58, 59
Our data also suggest that the therapeutic blockade of S1P signalling could inhibit the oncogenic effects of BATF3. The two functional antagonists of S1PR1, Ozanimod and Siponimod, which we showed can block the S1P-mediated activation of Akt, are already in phase II and III clinical trials of patients with inflammatory and autoimmune diseases. These and other S1PR1 modulators should be investigated for their therapeutic potential in HL.
Acknowledgments
This work was supported by Bloodwise and in part by grants RVO: 61989592 and NPS I LO1304 from the Czech Ministry of Education to PGM and by NIGMS Grant R01GM043880 to SS. The VCU Lipidomics Core was supported in part by NCI Grant P30 CA016059. We wish to dedicate this work to the memory of an excellent scientist, a wonderful colleague and a kind friend, Professor Ciaran BJ Woodman, we had the privilege to work with.
Author contributions
KV, MV and PGM designed research; KV, MI, MV, TP, SM, LL, EN, DL, AL, GR, MA, SS and JA performed research and analysed data; RH, MI, MC, DK, RT, WW, CBJW and PGM contributed to the statistical analysis; ES contributed clinical samples; KV, SS and PGM wrote the manuscript.
Footnotes
Supplementary Information accompanies this paper on the Leukemia website (http://www.nature.com/leu)
Users may view, print, copy and download text and data-mine the content in such documents, for the purposes of academic research, subject always to the full conditions of use: http://www.nature.com/authors/editorial_policies/license.html#terms.
The authors declare no conflict of interest.
Supplementary Material
References
- Moolenaar WH. Bioactive lysophospholipids and their G protein-coupled receptors. Exp Cell Res 1999; 253: 230–238. [DOI] [PubMed] [Google Scholar]
- Milstien S, Spiegel S. Targeting sphingosine-1-phosphate: a novel avenue for cancer therapeutics. Cancer Cell 2006; 9: 148–150. [DOI] [PubMed] [Google Scholar]
- Bayerl MG, Bruggeman RD, Conroy EJ, Hengst JA, King TS, Jimenez M et al. Sphingosine kinase 1 protein and mRNA are overexpressed in non-Hodgkin lymphomas and are attractive targets for novel pharmacological interventions. Leuk Lymphoma 2008; 49: 948–954. [DOI] [PubMed] [Google Scholar]
- Mandala SM, Thornton R, Galve-Roperh I, Poulton S, Peterson C, Olivera A et al. Molecular cloning and characterization of a lipid phosphohydrolase that degrades sphingosine-1-phosphate and induces cell death. Proc Natl Acad Sci USA 2000; 97: 7859–7864. [DOI] [PMC free article] [PubMed] [Google Scholar]
- Le Stunff H, Giussani P, Maceyka M, Lepine S, Milstien S, Spiegel S. Recycling of sphingosine is regulated by the concerted actions of sphingosine-1-phosphate phosphohydrolase 1 and sphingosine kinase 2. J Biol Chem 2007; 282: 34372–34380. [DOI] [PubMed] [Google Scholar]
- Gao XY, Li L, Wang XH, Wen XZ, Ji K, Ye L et al. Inhibition of sphingosine-1-phosphate phosphatase 1 promotes cancer cells migration in gastric cancer: clinical implications. Oncol Rep 2015; 34: 1977–1987. [DOI] [PubMed] [Google Scholar]
- Takuwa Y, Okamoto H, Takuwa N, Gonda K, Sugimoto N, Sakurada S. Subtype-specific, differential activities of the EDG family receptors for sphingosine-1-phosphate, a novel lysophospholipid mediator. Mol Cell Endocrinol 2001; 177: 3–11. [DOI] [PubMed] [Google Scholar]
- Takuwa Y, Takuwa N, Sugimoto N. The Edg family G protein-coupled receptors for lysophospholipids: their signaling properties and biological activities. J Biochem 2002; 131: 767–771. [DOI] [PubMed] [Google Scholar]
- Takuwa Y. Subtype-specific differential regulation of Rho family G proteins and cell migration by the Edg family sphingosine-1-phosphate receptors. Biochim Biophys Acta 2002; 1582: 112–120. [DOI] [PubMed] [Google Scholar]
- Okamoto H, Takuwa N, Yokomizo T, Sugimoto N, Sakurada S, Shigematsu H et al. Inhibitory regulation of Rac activation, membrane ruffling, and cell migration by the G protein-coupled sphingosine-1-phosphate receptor EDG5 but not EDG1 or EDG3. Mol Cell Biol 2000; 20: 9247–9261. [DOI] [PMC free article] [PubMed] [Google Scholar]
- Arikawa K, Takuwa N, Yamaguchi H, Sugimoto N, Kitayama J, Nagawa H et al. Ligand- dependent inhibition of B16 melanoma cell migration and invasion via endogenous S1P2 G protein-coupled receptor. Requirement of inhibition of cellular RAC activity. J Biol Chem 2003; 278: 32841–32851. [DOI] [PubMed] [Google Scholar]
- Inoki I, Takuwa N, Sugimoto N, Yoshioka K, Takata S, Kaneko S et al. Negative regulation of endothelial morphogenesis and angiogenesis by S1P2 receptor. Biochem Biophys Res Commun 2006; 346: 293–300. [DOI] [PubMed] [Google Scholar]
- Sanchez T, Thangada S, Wu MT, Kontos CD, Wu D, Wu H et al. PTEN as an effector in the signaling of antimigratory G protein-coupled receptor. Proc Natl Acad Sci USA 2005; 102: 4312–4317. [DOI] [PMC free article] [PubMed] [Google Scholar]
- Du W, Takuwa N, Yoshioka K, Okamoto Y, Gonda K, Sugihara K et al. S1P2, the G protein– coupled receptor for sphingosine-1-phosphate, negatively regulates tumor angiogenesis and tumor growth in vivo in mice. Cancer Res 2010; 70: 772–781. [DOI] [PubMed] [Google Scholar]
- Kluk MJ, Ryan KP, Wang B, Zhang G, Rodig SJ, Sanchez T. Sphingosine-1-phosphate receptor 1 in classical Hodgkin lymphoma: assessment of expression and role in cell migration. Lab Invest 2013; 93: 462–471. [DOI] [PMC free article] [PubMed] [Google Scholar]
- Cattoretti G, Mandelbaum J, Lee N, Chaves AH, Mahler AM, Chadburn A et al. Targeted disruption of the S1P2 sphingosine 1-phosphate receptor gene leads to diffuse large B-cell lymphoma formation. Cancer Res 2009; 69: 8686–8692. [DOI] [PMC free article] [PubMed] [Google Scholar]
- Green JA, Suzuki K, Cho B, Willison LD, Palmer D, Allen CD et al. The sphingosine 1-phosphate receptor S1P2 maintains the homeostasis of germinal center B cells and promotes niche confinement. Nat Immunol 2011; 12: 672–680. [DOI] [PMC free article] [PubMed] [Google Scholar]
- Hildner K, Edelson BT, Purtha WE, Diamond M, Matsushita H, Kohyama M et al. Batf3 deficiency reveals a critical role for CD8alpha+ dendritic cells in cytotoxic T cell immunity. Science 2008; 322: 1097–1100. [DOI] [PMC free article] [PubMed] [Google Scholar]
- Edelson BT, Kc W, Juang R, Kohyama M, Benoit LA, Klekotka PA et al. Peripheral CD103+ dendritic cells form a unified subset developmentally related to CD8alpha+ conventional dendritic cells. J Exp Med 2010; 207: 823–836. [DOI] [PMC free article] [PubMed] [Google Scholar]
- Vockerodt M, Morgan SL, Kuo M, Wei W, Chukwuma MB, Arrand JR et al. The Epstein–Barr virus oncoprotein, latent membrane protein-1, reprograms germinal centre B cells towards a Hodgkin's Reed–Sternberg-like phenotype. J Pathol 2008; 216: 83–92. [DOI] [PubMed] [Google Scholar]
- Vrzalikova K, Vockerodt M, Leonard S, Bell A, Wei W, Schrader A et al. Down-regulation of BLIMP1α by the EBV oncogene, LMP-1, disrupts the plasma cell differentiation program and prevents viral replication in B cells: implications for the pathogenesis of EBV-associated B-cell lymphomas. Blood 2011; 117: 5907–5917. [DOI] [PMC free article] [PubMed] [Google Scholar]
- Leonard S, Wei W, Anderton J, Vockerodt M, Rowe M, Murray PG et al. Epigenetic and transcriptional changes which follow Epstein–Barr virus infection of germinal center B cells and their relevance to the pathogenesis of Hodgkin's lymphoma. J Virol 2011; 85: 9568–9577. [DOI] [PMC free article] [PubMed] [Google Scholar]
- Vrzalikova K, Leonard S, Fan Y, Bell A, Vockerodt M, Flodr P et al. Hypomethylation and over-expression of the beta isoform of BLIMP1 is induced by Epstein–Barr virus infection of B cells; potential implications for the pathogenesis of EBV-associated lymphomas. Pathogens 2012; 1: 83–101. [DOI] [PMC free article] [PubMed] [Google Scholar]
- Hait NC, Allegood J, Maceyka M, Strub GM, Harikumar KB, Singh SK et al. Regulation of histone acetylation in the nucleus by sphingosine-1-phosphate. Science 2009; 325: 1254–1257. [DOI] [PMC free article] [PubMed] [Google Scholar]
- Dutton A, Reynolds GM, Dawson CW, Young LS, Murray PG. Constitutive activation of phosphatidyl-inositide 3 kinase contributes to the survival of Hodgkin's lymphoma cells through a mechanism involving Akt kinase and mTOR. J Pathol 2005; 205: 498–506. [DOI] [PubMed] [Google Scholar]
- Bolstad BM, Irizarry RA, Astrand M, Speed TP. A comparison of normalization methods for high density oligonucleotide array data based on variance and bias. Bioinformatics 2003; 19: 185–193. [DOI] [PubMed] [Google Scholar]
- Irizarry RA, Bolstad BM, Collin F, Cope LM, Hobbs B, Speed TP. Summaries of Affymetrix GeneChip probe level data. Nucleic Acids Res 2003; 31: 15. [DOI] [PMC free article] [PubMed] [Google Scholar]
- Smyth GK. Linear models and empirical Bayes methods for assessing differential expression in microarray experiments. Stat Appl Genet Mol Biol 2004; 3: Article3. [DOI] [PubMed] [Google Scholar]
- Flavell JR, Baumforth KR, Wood VH, Davies GL, Wei W, Reynolds GM et al. Down-regulation of the TGF-beta target gene, PTPRK, by the Epstein–Barr virus encoded EBNA1 contributes to the growth and survival of Hodgkin lymphoma cells. Blood 2008; 111: 292–301. [DOI] [PubMed] [Google Scholar]
- Reynolds GM, Billingham LJ, Gray LJ, Flavell JR, Najafipour S, Crocker J et al. Interleukin 6 expression by Hodgkin/Reed–Sternberg cells is associated with the presence of 'B' symptoms and failure to achieve complete remission in patients with advanced Hodgkin's disease. Br J Haematol 2002; 118: 195–201. [DOI] [PubMed] [Google Scholar]
- Brune V, Tiacci E, Pfeil I, Döring C, Eckerle S, van Noesel CJM et al. Origin and pathogenesis of nodular lymphocyte–predominant Hodgkin lymphoma as revealed by global gene expression analysis. J Exp Med 2008; 205: 2251–2268. [DOI] [PMC free article] [PubMed] [Google Scholar]
- Steidl C, Diepstra A, Lee T, Chan FC, Farinha P, Tan K et al. Gene expression profiling of microdissected Hodgkin Reed–Sternberg cells correlates with treatment outcome in classical Hodgkin lymphoma. Blood 2012; 120: 3530–3540. [DOI] [PubMed] [Google Scholar]
- Scott FL, Clemons B, Brooks J, Brahmachary E, Powell R, Dedman H et al. Ozanimod (RPC1063) is a potent sphingosine-1-phosphate receptor-1 (S1P1) and receptor-5 (S1P5) agonist with autoimmune disease-modifying activity. Br J Pharmacol 2016; 173: 1778–1792. [DOI] [PMC free article] [PubMed] [Google Scholar]
- Pan S, Gray NS, Gao W, Mi Y, Fan Y, Wang X et al. Discovery of BAF312 (Siponimod), a potent and selective S1P receptor modulator. ACS Med Chem Lett 2013; 4: 333–337. [DOI] [PMC free article] [PubMed] [Google Scholar]
- Vaquerizas JM, Kummerfeld SK, Teichmann SA, Luscombe NM. A census of human transcription factors: function, expression and evolution. Nat Rev Genet 2009; 10: 252–263. [DOI] [PubMed] [Google Scholar]
- Rosenwald A. DNA microarrays in lymphoid malignancies. Oncology (Williston Park) 2003; 17: 1743–1748; discussion 1750, 1755, 1758–1749 passim. [PubMed] [Google Scholar]
- Schwering I, Brauninger A, Distler V, Jesdinsky J, Diehl V, Hansmann ML et al. Profiling of Hodgkin's lymphoma cell line L1236 and germinal center B cells: identification of Hodgkin's lymphoma-specific genes. Mol Med 2003; 9: 85–95. [PMC free article] [PubMed] [Google Scholar]
- Buettner M, Greiner A, Avramidou A, Jack HM, Niedobitek G. Evidence of abortive plasma cell differentiation in Hodgkin and Reed–Sternberg cells of classical Hodgkin lymphoma. Hematol Oncol 2005; 23: 127–132. [DOI] [PubMed] [Google Scholar]
- Cattoretti G, Angelin-Duclos C, Shaknovich R, Zhou H, Wang D, Alobeid B. PRDM1/Blimp-1 is expressed in human B-lymphocytes committed to the plasma cell lineage. J Pathol 2005; 206: 76–86. [DOI] [PubMed] [Google Scholar]
- Garcia JF, Roncador G, Garcia JF, Sanz AI, Maestre L, Lucas E et al. PRDM1/BLIMP-1 expression in multiple B and T-cell lymphoma. Haematologica 2006; 91: 467–474. [PubMed] [Google Scholar]
- Nie K, Gomez M, Landgraf P, Garcia JF, Liu Y, Tan LH et al. MicroRNA-mediated down- regulation of PRDM1/Blimp-1 in Hodgkin/Reed–Sternberg cells: a potential pathogenetic lesion in Hodgkin lymphomas. Am J Pathol 2008; 173: 242–252. [DOI] [PMC free article] [PubMed] [Google Scholar]
- Jucker M, Sudel K, Horn S, Sickel M, Wegner W, Fiedler W et al. Expression of a mutated form of the p85alpha regulatory subunit of phosphatidylinositol 3-kinase in a Hodgkin's lymphoma-derived cell line (CO). Leukemia 2002; 16: 894–901. [DOI] [PubMed] [Google Scholar]
- De J, Brown RE. Tissue-microarray based immunohistochemical analysis of survival pathways in nodular sclerosing classical Hodgkin lymphoma as compared with non-Hodgkin's lymphoma. Int J Clin Exp Med 2010; 3: 55–68. [PMC free article] [PubMed] [Google Scholar]
- Lollies A, Hartmann S, Schneider M, Bracht T, Weiß A, Arnolds J et al. An oncogenic axis of STAT-mediated BATF3 upregulation causing MYC activity in classical Hodgkin lymphoma and anaplastic large cell lymphoma. Leukemia 2017; e-pub ahead of print 29 June 2017 doi:10.1038/leu.2017.203. [DOI] [PubMed]
- Muto A, Ochiai K, Kimura Y, Itoh-Nakadai A, Calame KL, Ikebe D et al. Bach2 represses plasma cell gene regulatory network in B cells to promote antibody class switch. EMBO J 2010; 29: 4048–4061. [DOI] [PMC free article] [PubMed] [Google Scholar]
- Ochiai K, Katoh Y, Ikura T, Hoshikawa Y, Noda T, Karasuyama H et al. Plasmacytic transcription factor Blimp-1 is repressed by Bach2 in B cells. J Biol Chem 2006; 281: 38226–38234. [DOI] [PubMed] [Google Scholar]
- Iacobelli M, Wachsman W, McGuire KL. Repression of IL-2 promoter activity by the novel basic leucine zipper p21SNFT protein. J Immunol 2000; 165: 860–868. [DOI] [PubMed] [Google Scholar]
- Lane PJ, Ledbetter JA, McConnell FM, Draves K, Deans J, Schieven GL et al. The role of tyrosine phosphorylation in signal transduction through surface Ig in human B cells. Inhibition of tyrosine phosphorylation prevents intracellular calcium release. J Immunol 1991; 146: 715–722. [PubMed] [Google Scholar]
- Justement LB, Campbell KS, Chien NC, Cambier JC. Regulation of B cell antigen receptor signal transduction and phosphorylation by CD45. Science 1991; 252: 1839–1842. [DOI] [PubMed] [Google Scholar]
- Scheeren FA, Diehl SA, Smit LA, Beaumont T, Naspetti M, Bende RJ et al. IL-21 is expressed in Hodgkin lymphoma and activates STAT5: evidence that activated STAT5 is required for Hodgkin lymphomagenesis. Blood 2008; 111: 4706–4715. [DOI] [PMC free article] [PubMed] [Google Scholar]
- Jundt F, Anagnostopoulos I, Forster R, Mathas S, Stein H, Dorken B. Activated Notch1 signaling promotes tumor cell proliferation and survival in Hodgkin and anaplastic large cell lymphoma. Blood. 2002; 99: 3398–3403. [DOI] [PubMed] [Google Scholar]
- Vockerodt M, Wei W, Nagy E, Prouzova Z, Schrader A, Kube D et al. Suppression of the LMP2A target gene, EGR-1, protects Hodgkin's lymphoma cells from entry to the EBV lytic cycle. J Pathol 2013; 230: 399–409. [DOI] [PubMed] [Google Scholar]
- Han H, Xue-Franzen Y, Miao X, Nagy E, Li N, Xu D et al. Early growth response gene (EGR)-1 regulates leukotriene D4-induced cytokine transcription in Hodgkin lymphoma cells. Prostaglandins Other Lipid Mediat 2015; 121 (Part A): 122–130. [DOI] [PubMed] [Google Scholar]
- Laichalk LL, Thorley-Lawson DA. Terminal differentiation into plasma cells initiates the replicative cycle of Epstein–Barr virus in vivo. J Virol 2005; 79: 1296–1307. [DOI] [PMC free article] [PubMed] [Google Scholar]
- Farrell PJ, Rowe DT, Rooney CM, Kouzarides T. Epstein–Barr virus BZLF1 trans-activator specifically binds to a consensus AP-1 site and is related to c-fos. EMBO J 1989; 8: 127–132. [DOI] [PMC free article] [PubMed] [Google Scholar]
- Lieberman PM, Hardwick JM, Sample J, Hayward GS, Hayward SD. The zta transactivator involved in induction of lytic cycle gene expression in Epstein–Barr virus-infected lymphocytes binds to both AP-1 and ZRE sites in target promoter and enhancer regions. J Virol 1990; 64: 1143–1155. [DOI] [PMC free article] [PubMed] [Google Scholar]
- Heather J, Flower K, Isaac S, Sinclair AJ. The Epstein–Barr virus lytic cycle activator Zta interacts with methylated ZRE in the promoter of host target gene egr1. J Gen Virol 2009; 90 (Part 6): 1450–1454. [DOI] [PMC free article] [PubMed] [Google Scholar]
- Ye J, Gradoville L, Miller G. Cellular immediate-early gene expression occurs kinetically upstream of Epstein–Barr virus bzlf1 and brlf1 following cross-linking of the B cell antigen receptor in the Akata Burkitt lymphoma cell line. J Virol 2010; 84: 12405–12418. [DOI] [PMC free article] [PubMed] [Google Scholar]
- Reusch JA, Nawandar DM, Wright KL, Kenney SC, Mertz JE. Cellular differentiation regulator BLIMP1 induces Epstein–Barr virus lytic reactivation in epithelial and B cells by activating transcription from both the R and Z promoters. J Virol 2015; 89: 1731–1743. [DOI] [PMC free article] [PubMed] [Google Scholar]
Associated Data
This section collects any data citations, data availability statements, or supplementary materials included in this article.


