
Figure 3.
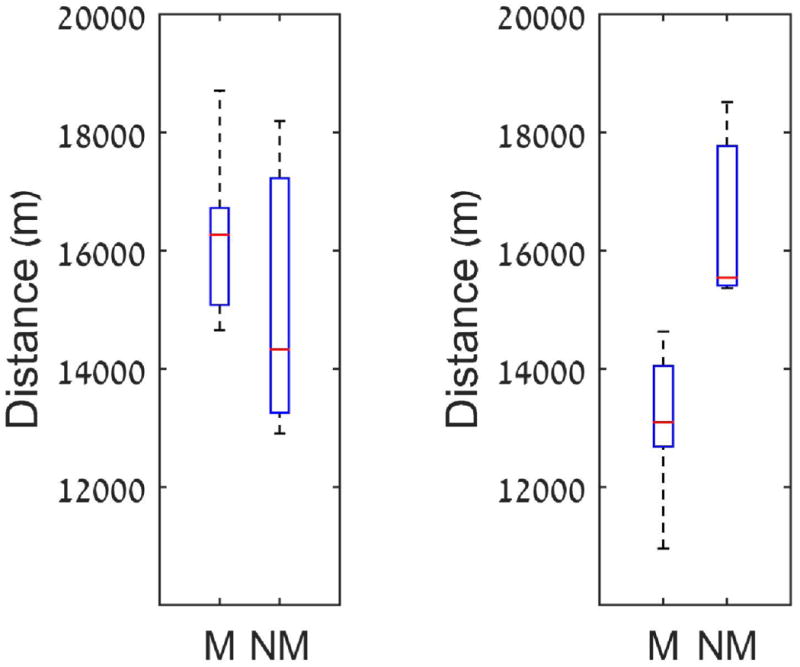
Daily movement along the year is presented. The left panel exhibits the daily movement in the wet season; the right panel in the dry and semi-dry seasons (together). The distance is calculated as an average over the distinct individuals of each group. The red line is the sample median. The top and bottom of each box are 25th and 75th percentiles of the samples. The whiskers are the minimal and maximal values.