

Summary
To guide the design of immunotherapy strategies for patients with early stage lung tumors, we developed a multiscale immune profiling strategy to map the immune landscape of early lung adenocarcinoma lesions to search for tumor-driven immune changes. Utilizing a barcoding method that allows a simultaneous single cell analysis of the tumor, non-involved lung and blood cells together with multiplex tissue imaging to assess spatial cell distribution, we provide a detailed immune cell atlas of early lung tumors. We show that stage I lung adenocarcinoma lesions already harbor significantly altered T cell and NK cell compartments. Moreover, we identified changes in tumor infiltrating myeloid cell (TIM) subsets that likely compromise anti-tumor T cell immunity. Paired single cell analyses thus offer valuable knowledge of tumor-driven immune changes, providing a powerful tool for the rational design of immune therapies.
Keywords: Human non-small cell lung cancer (NSCLC), lung adenocarcinoma, CD141+ DC, CD1c+ DC, Tumor Macrophage, T Cell, NK Cell, TLS, TIM, immune cell atlas
eTOC

Comparing single tumor cells with adjacent normal tissue and blood from patients with lung adenocarcinoma charts early changes in tumor immunity and provides insights to guide immunotherapy design.
INTRODUCTION
Current checkpoint blockade therapies mainly function to rescue T cells from exhaustion or deplete T regulatory cells (Treg) and studies have begun to dissect the details of T cell function and distribution in advanced tumor lesions to identify novel strategies to further strengthen anti-tumor T cell immunity. Myeloid cells through their ability to present tumor-associated antigens to T cells and to produce critical T cell differentiation cytokines, have a unique ability to control T cell function at the tumor site. Yet much less is known about the diversity of the myeloid compartment at the tumor site.
Myeloid cells are a diverse population of immune cells that share the ability to sense and respond to tissue injuries by clearing damaged cells and by promoting the recruitment of immune effector cells that will help restore tissue integrity (Lavin and Merad, 2013; Pham, 2006). Tumor infiltrating myeloid cells (TIM) consist of granulocytes and mononuclear phagocytes at varying stages of differentiation and have been shown to contribute to shaping tumor progression and response to treatment (Engblom et al., 2016; Gabrilovich et al., 2012). Of these, mononuclear phagocytes refer to monocytes, macrophages and dendritic cells (DC), which in addition to their innate immune function, share the ability to present tumor-associated antigens to T cells (Ginhoux and Jung, 2014). Among TIM, DC are the best equipped to drive T cell activation (Merad et al., 2013) and a subset of DC, named CD103+ DC, was shown to control local CD8+ T cell activation (Broz et al., 2014; Hildner et al., 2008; Salmon et al., 2016; Sánchez-Paulete et al., 2016). Thus, TIM composition appear to control TIL composition, activation, and anti-tumor function, and harnessing the TIM compartment may provide a powerful synergistic strategy to potentiate T cell targeting immunotherapies.
Currently, the majority of lung cancer cases are diagnosed at advanced stage. However, this is likely to change as low-dose CT screening programs in populations at risk have shown benefits and are being widely implemented (Aberle et al., 2011; Black et al., 2015). Five-year survival rates for patients with pathologic stage IA and IB NSCLC are only 83% and 71%, respectively, and these numbers drop to 50% for stage II disease (Goldstraw et al., 2016) with minimal improvement from adjuvant chemotherapy (Pignon et al., 2008). Preliminary data suggest impressive activity of neoadjuvant immunotherapy in a small number of early stage resectable lung NSCLC lesions treated with anti-PD-1 mAb blockade (Forde et al., 2016). Although these studies need to be confirmed in a larger cohort, these results are consistent with the notion that immunotherapy agents are most efficient at low tumor burden and in patients naïve of immunomodulatory chemotherapy agents. The design of immunomodulatory strategies for the treatment of NSCLC will, however, tremendously benefit from a detailed understanding of the immune cell landscape that develops specifically in response to tumor cues.
To this end, we developed a multiscale immune profiling strategy to map the immune microenvironment of early lung adenocarcinoma lesions. As tissue cues significantly impact the biology of tissue-resident immune cells and specifically innate cells (Lavin et al., 2014), we designed a barcoding strategy that allowed the simultaneous single cell analysis of the distinct immune cell compartments that reside in the tumor site, non-involved lung tissue (nLung) and blood of each patient to distinguish tumor-driven immune signatures from those caused by normal tissue-imprinting cues. Using mass cytometry by time-of-flight (CyTOF) combined with single cell transcriptomics and multiplex tissue imaging of the lung tumor, we identify NK and myeloid cell responses that are unique to tumor lesions and absent from nLung or blood from the same patients. We show that these changes are present as early as in stage I tumors and likely compromise anti-tumor immunity. These data suggest that neoadjuvant immunotherapy strategies targeting innate immune cells in early lung adenocarcinoma lesions have the potential to reactivate the TIL microenvironment and transform tumor response to checkpoint blockade.
RESULTS
High-dimensional single cell profiling of lung tumors
To map the immune microenvironment of lung adenocarcinoma lesions, we designed a clinical multiscale immune profiling study of freshly resected tumors. Patients selected were treatment naïve at the time of surgery. For each patient, we obtained NSCLC tumor tissues including invasive margins, nLung tissue, and blood cells (Figure 1A, STAR methods). Of 32 patients, 28 were diagnosed with lung adenocarcinoma. Patients were representative of the lung adenocarcinoma distribution across age, gender, mutational status, and predominant histological subtype (Table 1).
Figure 1. Robust immune response to early lung adenocarcinoma tumor lesions.

(A) Schematic for defining the immune composition of lung tumors. Blood, non-involved lung (nLung), and tumor tissue were collected from patients undergoing surgical resection of primary tumors, processed, barcoded, pooled, and stained with antibodies conjugated to metal isotopes. Mass cytometry (CyTOF) single cell data was clustered using Phenograph to identify common populations across patients.
(B) viSNE analysis of immune cells from tumor colored by relative expression of CyTOF markers, with populations indicated (top).
(C, D) Frequency of immune lineages based on summation of Phenograph metaclusters (STAR methods; n=18). Composition of the CD45+ compartment showing average frequencies of major immune lineages for each tissue (C; n=18) across patients and bar plots showing frequencies for each patient (D; *p<0.05, **p<0.01, ***p<0.001 by paired t-test). Bar plots show mean ± SEM.
(E, F) MICSSS for CD3, CD68, and CD20 of immune infiltrate (E) and a tertiary lymphoid structure (TLS; F) at the tumor invasive margin and non-involved lung from representative patients. See also Figure S1
To distinguish tumor-specific immune changes from the lung tissue immune environment, we sought to simultaneously map the immune compartment of the lung tumor lesion, the nLung tissue, and the peripheral blood. To this end, we developed a novel barcoding method that allows a simultaneous analysis of cells from all three sample types. In the first 18 patient cohort, immune cells isolated from the tumor lesion, nLung, and blood were barcoded with anti-CD45 antibodies (Ab) conjugated to unique metal isotopes before samples were pooled. Pooled samples were then stained with two panels of more than 30 antibodies each and analyzed by CyTOF, thus allowing the measurement of single cell expression on immune cells residing in each tissue type of each patient (Figure 1A). The mass cytometry panels were subsequently extended to include cytokine measurement in a cohort of 10 additional lung adenocarcinoma patients, as described (STAR methods).
T cells and mononuclear phagocytes dominate the early lung adenocarcinoma microenvironment
Using viSNE to visualize high-dimensional data in two-dimensions while preserving single cell resolution (Amir et al., 2013), we analyzed the distribution of the different immune cell lineages that accumulated in lung tumor lesions, nLung, and blood circulation across patients (Table 1 and Data S1). A higher number of immune cells accumulated in the tumor tissues compared to nLung (Figure S1A). The tumor-resident immune cell compartment comprised all major immune lineages, and the most abundant were the T lymphocytes and mononuclear phagocytes (Figures 1B, 1C, 1D and S1B). Mononuclear phagocytes and granulocytes were equally represented in tumor lesions compared to nLung. In contrast, T and B lymphocytes were present at a higher frequency in the tumor microenvironment compared to the nLung, whereas the frequency of NK cells was significantly reduced across all lung adenocarcinoma patients examined (Figures 1C, 1D, and S1C).
We also analyzed the cytokines and chemokines produced in the tumor milieu. Whereas many chemokines and cytokines were expressed at much higher levels in the tumors compared to the blood, similar chemokine levels were often detected in tumors and adjacent nLung, which could potentially reflect the local diffusion of tumor-produced soluble molecules to the adjacent lung tissue (Figures S1D and S1E). Interestingly, CX3CL1 (fractalkine) was expressed at slightly higher levels in tumors compared to nLung and correlated with the frequency of the mononuclear phagocyte infiltrate (Figure S1F).
Recent studies have shown that in addition to cell composition, the spatial distribution of immune cells at the tumor site may affect tumor outcome (Germain et al., 2014). Using a new tissue profiling method named multiplexed immunohistochemical consecutive staining on a single slide (MICSSS) that we recently developed in the laboratory (Remark et al., 2016), we assessed the distribution of immune cells in the tumor and nLung sections. Immune cells accumulated mainly in the stroma and invasive margin surrounding the tumor islets as previously described (Salmon et al., 2012; Turley et al., 2015), although some macrophages and T cells were able to infiltrate into the tumors (Figures 1E and S1I). We also observed an abundance of macrophages and T cells at the tumor site across patients supporting the CyTOF results (Figures 1D, 1E and S1B). Importantly, many patients had tertiary lymphoid structures (TLS), which accumulated near the tumor invasive margin and were absent from nLung (Figure 1F and S1I). Tumor lesions enriched in TLS had significantly more T lymphocytes and less macrophages as measured by CyTOF at the tumor site (Figure S1H).
To further probe the nature of the immune response induced at the tumor site in an unbiased manner, we analyzed the CyTOF data using the Phenograph algorithm to systematically identify common cellular communities across the three tissues and across all patients (Levine et al., 2015). We first clustered single cells based on shared protein expression across tumor lesions, nLung, and PBMC within each patient, then merged clusters from each patient using a secondary clustering analysis to identify metaclusters common across patients and tissues (Figure 1A).
Tumor lesions are enriched in Treg and non-functional T cells
Phenograph clustering across tissues and across all patients revealed distinct T lymphoid metaclusters (Figures 2A, 2B, and S2A) that corresponded to known immune cell populations and had a unique distribution across tissue sites (Figures 2C and S2B).
Figure 2. Lymphoid function is dysregulated at the tumor site.

(A) viSNE analysis of CD3+ immune cells colored and labeled by Phenograph metacluster (left) and tissue (right) for a representative patient.
(B) Heatmap of Phenograph clusters of CD3+ cells. Rows represent clusters of single cells within individual patients grouped by metacluster across patients.
(C) Bar plots of frequencies of metaclusters from (B) across tissue for 18 lung adenocarcinoma patients (*p<0.05, **p<0.01 and ***p<0.001 by paired t-test).
(D) Normalized expression of PD-1, CTLA-4, and CD39 on tumor CD3+ cells shown by viSNE plot for a representative patient (left) and bar pots of normalized expression across patients for indicated metaclusters (n=18; right).
(E) Heatmap showing relative normalized protein expression on tumor Tregs as ratio to nLung Tregs for 15 patients (left) and average expression of indicated markers across patients on tumor Tregs, PD-1+ CD4+ and CD8+ T cells (right).
(F) MICSSS for CD8 and CD20 showing a TLS in tumor of a representative patient.
(G) Clonality of T cell receptor (TCR) repertoire across tissues (n=16; left), and frequency of CD8+ PD-1+ T cells in tumor correlated to overall TCR clonality (Spearman’s rank-based correlation; right). Bar plots show mean ± SEM.
See also Figure S2
Paired mass cytometry analysis revealed a distinct composition and phenotype of T cell subsets (Figures 2C and S2B). Specifically, Treg were significantly increased in the tumor lesion across all patients even at early stages (Figure 2C). Importantly, Treg at the tumor sites expressed high levels of CTLA4, CD39, ICOS, and 41BB compared to other T cells (Figures 2D and S2D). They were also clearly distinguishable from Treg that resided in nLung based on higher expression of Foxp3, CTLA4, PD-1, CD39, ICOS, CD38, and 41BB, whereas CCR4 was decreased (Figures 2E, S2E, and S2F). In contrast, cytolytic CD8+ T cells were significantly reduced in frequency in the tumor compared to nLung and blood from the same patients (Figure 2C). Moreover, total CD8+ T cells present in tumors expressed significantly less granzyme B and IFNγ upon stimulation compared to their nLung counterparts (Figure S2G). A reduced T-effector/Treg ratio was thus a strong signature of the lung tumor lesion (Figure S2C).
Given the success of anti-PD-1 checkpoint blockade in lung cancer patients, we examined the expression of the checkpoint molecule PD-1 on all T cell metaclusters identified across tissues. PD-1 was distinctly expressed on a small subset of CD4+ and CD8+ T cells that were a unique feature of the tumor (Figure 2C and S2H) and at a lower level on Treg at the tumor site (Figure 2D). CD8+ T cells accumulate at the tumor site and in TLS where they preferentially expand (Figures 2F and S2I; (Goc et al., 2014; Joshi et al., 2015), and clonality of the T cell receptor (TCR) repertoire has been associated with TLS density (Zhu et al., 2015). Consistent with these findings, T cells were significantly increased in TLS-enriched tumors (Figure S1H). Moreover, while there was no enrichment in TCR clonality in tumors compared to nLung, the CD8+PD-1+ T cell subset uniquely and significantly correlated with increased TCR clonality at the tumor site but not in nLung (Figures 2G and Figure S2J). These results suggest that CD8+ T cells expressing PD-1 are clonally expanded at the tumor site and this expansion may preferentially occur in TLS-enriched tumor lesions.
Cytolytic NK cells are excluded from lung adenocarcinoma lesions
In addition to measuring adaptive lymphocyte responses to tumors, we also analyzed the distribution of innate lymphocytes and in particular NK cells in lung tumor lesions. Strikingly, NK cells were the least abundant immune cell lineage in lung adenocarcinoma lesions compared to nLung (Figures 1C and 1D). Importantly, the NK cell subset expressing CD16 was most dramatically reduced in the tumor compared to nLung (Figures 3A and S3A). NK cells that infiltrated the tumor lesion, expressed higher CXCR3 levels, a molecule shown to be required for NK infiltration of tumors (Figures 3B and 3C, Wendel et al., 2008). Moreover, NK cells that remained at the tumor site were less cytolytic as they expressed lower levels of granzyme B and CD57 as well as less IFNγ (Figures 3C, 3D, 3E and S3C). Conversely, since NK cells function to eliminate MHC class I deficient cells, we assessed the distribution of MHC class I throughout the tumor cells using MICSSS (Figure 3F). Tumor lesions with reduced frequency of MHC class I expressing tumor cells had higher numbers of tumor infiltrating CD16+ NK cells suggesting that the presence of cytolytic NK cells may have led to MHC class I immuno-editing (Figures 3G and S3D).
Figure 3. Cytolytic NK Cells are excluded from tumor and produce less granzyme B and IFNγ.
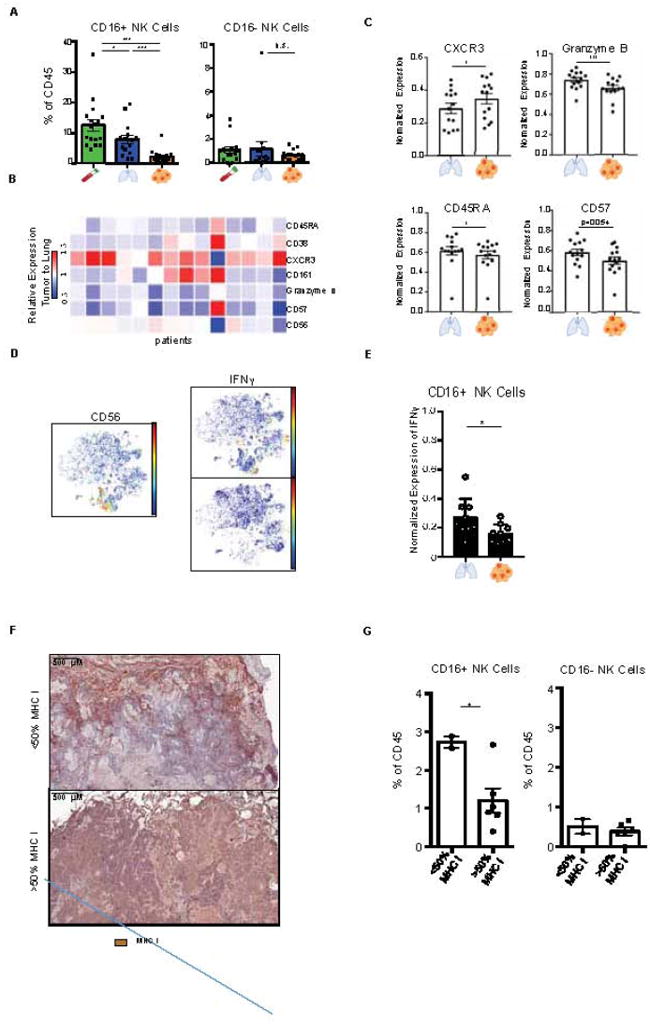
(A) Bar plots of frequencies of CD16+ and CD16- NK cell metaclusters across tissue for 17 lung adenocarcinoma patients (see Figure 4C).
(B) Heatmap showing relative normalized protein expression on tumor NK cell as ratio to those from nLung for 14 patients (see STAR Methods).
(C) Bar plots of normalized expression of indicated proteins on NK cells from nLung and tumor (n=14).
(D) viSNE plots showing CD56 expression (left), and IFNγ expression in tumor and nLung upon stimulation in a representative patient.
(E) Bar plot showing normalized IFNγ expression upon stimulation (n=9).
(F) Immunohistochemical staining from representative patients depicting greater (>50%) or less than 50% (<50%) of tumor cells staining for MHC I in the tumor.
(G) Bar plot stratifying the frequency of CD16+ NK cells and CD16- NK cells in patients by tumor cells staining for MHC I (n=8; *p<0.05, by unpaired t-test).
Bar plots show mean ± SEM; *p<0.05, **p<0.01 and ***p<0.001 by paired t-test.
See also Figure S3
Deciphering the diversity of TIM in lung adenocarcinoma lesions
To fully capture the heterogeneity of the TIM compartment, we first performed an unbiased single cell transcriptomic analysis of non-lymphocyte cells that accumulated in the tumor lesion and in the nLung of a stage I patient using massively parallel single cell RNA-sequencing (MARS-seq; Figure 4A and Data S2B, STAR methods, Jaitin et al., 2014). Single cell RNA-seq analysis of TIM-enriched cells, using an unbiased expectation-maximization algorithm previously described (STAR methods; Paul et al., 2015), revealed several immune cell types distinguished based on characteristic gene expression profiles identified according to highly expressed and differential genes. Specifically, we identified three distinct clusters expressing high levels of MHC class II molecules, CD1C, CCL22 and CD207 (Figure 4A, clusters 2-4) and slightly higher BATF3 and CSF2RA expression levels (Figures S4A and 4E) which we inferred to be DC. Other clusters were identified as macrophages (Figure 4A, cluster 5-8) and monocytes (cluster 9-10) based on the differential expression of CD68, MAFB, and CSF1R (Figures 4E and S4A). A macrophage cluster comprised predominantly of cells from tumor lesions (cluster 7), were distinct from those comprised predominantly of cells from nLung (cluster 5-6), indicating that tumor-associated macrophages were distinct from their nLung-resident macrophage counterparts.
Figure 4. Unbiased characterization of the mononuclear phagocyte compartment.

(A) MARS-seq of 1473 cells pooled from tumor and nLung of a Stage IA adenocarcinoma patient. Cells were gated in silico and clustering on 770 mononuclear phagocytes is shown (see STAR methods). Columns represent single cells, with most variable genes from low (white) to high (purple). Normalized frequency of each cluster in tumor or nLung (top). Macrophages (MΦ), monocytes (Mono).
(B) viSNE analysis of CD3- immune cells colored and labeled by Phenograph metaclusters (left) and tissue (right), for a representative patient.
(C) Heatmap of Phenograph clusters of CD3- cells; rows represent clusters of single cells within individual patients grouped by metacluster across multiple patients.
(D) Bar plots of metacluster frequencies from 18 lung adenocarcinoma patients across tissue (*p<0.05, **p<0.01 and ***p<0.001 by paired t-test).
(E, F) Expression of corresponding transcript and protein by MARS-seq and CyTOF, respectively. Normalized transcript expression of MARS-seq clusters (left) and normalized protein expression of select Phenograph metaclusters in the tumor (right) for phenotypic markers (E; n=18), and cytokines (F; n=10) with corresponding viSNE plots.
(G) Bar plot of normalized IL-8 expression by CD14+ monocytes across tissue (n=10; *p<0.05, **p<0.01 and ***p<0.001 by paired t-test).
Bar plots show mean ± SEM.
See also Figure S4
To detail the TIM compartment across patients, we systematically defined myeloid cell populations across patients using simultaneous CyTOF analysis of PBMC, nLung, and tumor immune cells. Phenograph clustering of all tissues in all patients confirmed the diversity of myeloid cells in the tumor and macrophages, DC subsets, and monocytes subsets were identified based on expression of protein markers including CD68, CSF1-R, CSF2-R, CD11C, CD1C, CD141, and HLA-DR among others (Figure 4B, 4C, 4E, and S4B). TIM were distinct from their lung and PBMC counterparts (Figures 4D and S4C). Indeed, paired CyTOF analysis revealed unique distributions and functions of CD14+ and CD16+ monocyte subsets in the tumor site (Figures 4D and S4D). While CD14+ monocytes were robust cytokine producers compared to other mononuclear phagocytes (Figures 4F, S4E, and S4F), they produced less IL-8 and less IL-1β at the tumor site compared to the nLung (Figures 4G and S4G). In contrast to the CD14+ monocytes that equally infiltrated tumor and lung tissues, CD16+ monocytes were significantly reduced in tumor tissues and highly correlated with NK cell infiltration at the tumor site (Figures 4D, S4D, and S3B).
Finally, while tumor lesions were equally enriched in neutrophils and eosinophils compared to nLung, they contained significantly less basophils and were strongly depleted of mast cells (Figure 4D).
Paired immune cell mapping reveals a distinct macrophage signature in lung adenocarcinoma
Single-cell transcriptomic analysis revealed distinct macrophage clusters that were differentially distributed in the tumor and nLung (Figure 4A, clusters 5-8). Comparing the macrophage cluster enriched in tumors (cluster 7) to those comprised primarily of nLung cells (clusters 5, 6) revealed many differentially expressed genes suggesting that tumor associated macrophages have a distinct transcriptional signature (Figure 5B).
Figure 5. The TME contains macrophages with a distinct phenotype.

(A) Bar plot of macrophage metacluster frequency from 18 lung adenocarcinoma patients across tissue (see Figure 4C).
(B) Comparison of average transcript expression between macrophage clusters enriched in tumor (cluster 7) or lung (weighted average of clusters 5 and 6; Figure 4A), showing highly expressed transcripts, genes with FC > 2 colored red (left), bar plots of indicated transcript expression (right).
(C) viSNE plots showing single-cell expression of CD68, CD163, PD-L1, and PPARγ across tissues in a representative patient.
(D) Heatmap showing relative normalized protein expression of tumor macrophages as ratio to those from nLung for 16 patients (left) and average expression across patients of indicated markers on mononuclear phagocyte metaclusters in tumor (right). Bar plots of normalized expression of indicated proteins by macrophages in tumor and nLung (n =18)
(E) Bar plot of normalized PD-L1 expression across metaclusters in tumor (n=18; top). MICSSS for CD3, CD68, and PD-L1 showing a macrophage-dense region at the tumor invasive margin (bottom).
(F) IL-6 expression in nLung and tumor macrophages. viSNE plots showing IL-6 expression of a representative patient (top). Bar plot showing expression of IL-6 transcripts (left) and normalized protein expression across macrophages in nLung and tumor (right; n=10).
Bar plots show mean ± SEM; *p<0.05, **p<0.01 and ***p<0.001 by paired t-test. Fold-change (FC).
See also Figure S5
We extended these result using paired CyTOF analyses. We found that while macrophages were not enriched in frequency in the tumor site compared to nLung (Figures 5A and S5A), tumor macrophages exhibited a distinct signature compared to their lung resident counterparts across all patients (Figures 5C and 5D). CyTOF analysis validated several of single cell transcriptomics findings revealing that tumor macrophages expressed higher levels of the immunomodulatory transcription factor PPARγ, higher CD64, CD14, and CD11c levels and lower CD86 and CD206 levels compared to macrophages that resided in nLung (Figure 5D).
Single cell transcriptional analysis identified additional transcripts up-regulated on the tumor macrophage cluster compared to their nLung counterparts (cluster 7) including triggering receptor expressed on myeloid cells-2 (TREM2), tetraspanin CD81, macrophage receptor with collagenous structure (MARCO), and apolipoprotein E (APOE; Figure 5B). To understand whether this differential transcriptional signature extends to other patients, we stratified 515 lung adenocarcinoma patients from the TCGA database according to the differential transcriptional profile. A significant survival disadvantage was observed in patients with a high ratio of tumor macrophages to lung macrophage gene expression profile (Figure S5G) suggesting that the macrophage signature identified in this study may include novel myeloid targets for lung cancer treatment.
Given the clinical success of anti-PD-L1 in lung cancer (Besse et al., 2015; Fehrenbacher et al., 2016) we examined the distribution of PD-L1 in lung tumor lesions using paired mass cytometry analysis. Strikingly, PD-L1 was most highly expressed on macrophages and mast cells both in tumor and nLung (Figures 5E, S5B, and S5C). These results are consistent with our data in mice (data not shown), and suggest a potential role for PD-L1 in the physiological regulation of lung immune homeostasis which could explain the increased rate of pneumonitis in patients treated with PD-L1 inhibitors (Naidoo et al.; Nishino et al., 2016). Given the impact of PD-L1+ cells on tumor outcome, we analyzed the spatial distribution of PD-L1+ macrophages and found that they accumulate in tight clusters at the tumor invasive margin (Figures 5E and S5D) and negatively correlated with T cell infiltration in tumor lesions but not in nLung (Figure S5E).
Tumor macrophages also spontaneously produced significantly more IL-6 than macrophages in nLung (Figures 5F and S5F). Given the potential role for IL-6 in tumor invasiveness (Chang et al., 2013; Yu et al., 2014) and the negative correlation between the presence of macrophages and T cells at the tumor site, these data emphasize the immunosuppressive role of tissue resident macrophages in early lung adenocarcinoma lesions.
CD141+ DC have a distinct phenotype and are excluded from lung tumor lesions
Dendritic cells (DC) excel at antigen presentation and play a key role in the induction of anti-tumor T cell immunity. Single cell transcriptional analysis of the tumor and nLung revealed the presence of two DC clusters (Figures 4A, clusters 2, 4), one of which expressed high CD207, CLEC9A and XCR1 levels and likely represent CD141+ DC (Dutertre et al., 2014; Haniffa et al., 2013). We also detected a second DC cluster expressing higher levels of CD1c, CX3CR1 and IRF4, which we inferred to be CD1c+ DC (Figures 6A, 6B, and S6B). The CD1c+ DC cluster also expressed higher levels of CCL22 and CCL17, ligands for CCR4, a molecule expressed mainly by CD4+ T cells (Yoshie and Matsushima, 2015) and higher lysozyme transcripts compared to the CD141+ DC (Figure 6B). These findings are in line with the increased potency to interact with CD4+ T cells and increased degradative potential of CD1c+ DC, in contrast to CD141+ DC which interact preferentially with CD8+ T cells (Dutertre et al., 2014; Haniffa et al., 2013; Merad et al., 2013). Lymphotoxin Beta (LTB) transcript, encoding a membrane-bound protein important for the formation of secondary lymphoid organs and potentially TLS (Pitzalis et al., 2014), was highly expressed by DC and at slightly higher levels by the CD141+ DC cluster (Figure 6E).
Figure 6. CD141+ DC are excluded from lung tumors and immune signature of lung adenocarcinoma tumors.

(A, B) Comparison of the average transcript expression between DC clusters (Figure 4A, clusters 2 and 4), showing highly expressed transcripts in these clusters, genes with FC > 2 colored red (A), and bar plots showing expression of indicated transcripts (B).
(C) Bar plots of DC metacluster frequencies across tissue (Figure 4C; n=18; *p<0.05, **p<0.01 and ***p<0.001 by paired t-test).
(D) MICSSS for CD3 and DC-LAMP showing a TLS at the tumor margin in a representative patient.
(E) MARS-seq transcript levels normalized across mononuclear phagocyte clusters (Figure 4A).
(F) Heatmap showing the relative differences in metacluster frequency between tumor and nLung across 16 patients, grouped by stage.
(G) Bar plots showing neutrophil metacluster frequency and secreted soluble TNFα (pg/ml) at thetumor, stratified by stage (*p<0.05 by unpaired t-test).
Bar plots show mean ± SEM.
See also Figure S6.
Paired CyTOF analyses identified the presence of two DC subsets at the tumor site across patients. Strikingly, CD141+ DC but not CD1c+ DC were significantly reduced in tumors compared to nLung and the CD1c+ DC/CD141+ DC ratio was thus increased in tumor lesions (Figures 6C, S6A and S6C). Importantly, CD1c+ DC expressed a very similar cytokine profile to CD14+ monocytes and produced IL-6, IL-8 and IL-1β cytokines in the tumor and nLung (Figure S4E). Using MICSSS, we found that in lesions infiltrated with TLS, DC localized in TLS and close to T cells (Figures 6D and S6D), in line with their role in T cell activation and clonal expansion (Dieu-Nosjean et al., 2008).
Lung adenocarcinomas have a unique immune signature that is independent of TNM stage
Altogether our results establish an immune cell atlas of early untreated lung adenocarcinoma lesions. We show that these lesions are enriched in PD-L1hiCD64hiCD14hiPPARγhiIL-6hi macrophages, CD1c+ DC, Treg, and exhausted T cells and depleted of CD141+ DC, CD16+ monocytes, NK cells and Granzyme B+ effector cells (Figure 6F and S6E). These differences compared to nLung likely work in concert to promote an immunosuppressive microenvironment.
As TNM staging is used to determine both prognosis and treatment options, we examined whether the immune contexture of the tumor lesions significantly differed between early stage (stage I) and later stage tumors (stages II and III). With the exception of increased neutrophils and TNFα production in stage II and stage III patients (Figure 6G), all immune changes detected in later stage tumor lesions were already present in stage I tumors. The distribution of immune cell subsets including macrophages, monocytes, NK cells, DC as well as B and T cell subsets did not significantly differ in frequency across stages (Figures 6F and S6F). In addition, expression levels of PD-1 and PD-L1 on macrophages and T cells, respectively, were stable across TNM stages (Figure S6G and S6H), suggesting that immunomodulatory strategies could benefit early stage tumors.
DISCUSSION
Driven by the premise that the myeloid cell compartment and most specifically the tumor-infiltrating antigen presenting cells critically shape the composition of anti-tumor T cells, the objective of this study was to provide an innate immune cell atlas of early lung adenocarcinoma lesions. Using paired single cell analyses of the immune cells that reside in the tumor, nLung, and peripheral blood, we distinguished the immune changes driven by the tumor lesion from those driven by the lung tissue emphasizing the relevance of this type of analysis for the study of the tumor microenvironment.
Strikingly, as early as in stage I disease, lung adenocarcinoma lesions had a strongly reduced CD8+ T effector/Treg ratio compared to nLung. This altered T cell ratio resulted from a significant reduction of CD8+ T cells expressing granzyme B and IFNγ combined with significant expansion of CD39hiCD38hiPD-1hiCTLA4hiFoxp3hi Tregs at the tumor site. In line with previous results showing that Foxp3/CD3 ratio is a strong predictor of recurrence in early stage tumors (Suzuki et al., 2013), reduced CD8+ Granzyme B+/CD39hiCD38hiPD-1hiCTLA4hiFoxp3hi Treg ratio may be useful as a refined biomarker of disease course or response to treatment.
The distinct TIL tumor signature was accompanied by significant alterations of tumor CD16+ NK cells as they were strongly reduced in tumors and the few remaining NK cells expressed lower levels of granzyme B and less IFNγ compared to lung NK cells. Tumor infiltrating NK cells were thus poorly cytolytic and expansion or activation of NK cells could provide a strategy to restore anti-tumor immunity in early lung tumors.
Strikingly, we also identified distinct changes in all antigen presenting cell subsets that resided in lung adenocarcinoma tumor lesions across TNM stages. Specifically, as early as stage I, lung adenocarcinoma lesions were significantly depleted in CD141+ DC and enriched in PPARγhi macrophages. Monocytes include two main subsets, the CD16+ and CD14+ monocyte subsets, shown to have different fates and functions in tissues (Yona and Jung, 2010). CD16+ monocytes but not CD14+ monocytes were strongly reduced at the tumor site, and significantly correlated with reduced CD16+ NK cells in tumors. Interestingly, CD16+ monocytes have been shown to promote NK cell recruitment to tumors (Hanna et al., 2015) and thus reduced CD16+ monocytes in lung tumors might have contributed to NK cell paucity in tumor lesions. CD14+ monocytes in the tumor produced high levels of the cytokine IL-8 but those in nLung produced even more. IL-8 can promote lung cancer growth and metastasis (Chen et al., 2003; Zhu et al., 2004) and in smokers, IL-8 expression in non-tumor lung tissue is part of a lung cancer biomarker signature (Spira et al., 2007). Given the potential role of monocytes in lung metastasis (Qian et al., 2011), monocyte-derived IL-8 in nLung may have contributed to tumor cell engraftment. Interestingly, while we identified a drastic increase in cytokine production in the tumor tissue compared to the blood, many cytokines were equally expressed in the tumor and nLung. CX3CL1, however, tended to be expressed at higher levels at the tumor site and significantly correlated with mononuclear phagocytes, particularly CD14+ monocytes in the tumor lesion. CX3CL1 was found to be increased in patients that failed to respond to PD-1 (Herbst et al., 2014). Therefore, it will be important to further assess CX3CL1 and CD14+ monocytes as biomarkers of treatment response.
Tissue resident DC consist of two main subsets that are transcriptionally and functionally distinct. In mice tissues, these include the CD103+ DC subset, which derive from DC-restricted precursors and excel in the cross-presentation and priming of CD8+ T cells, and the CD11b+ DC subset, which has a higher degradative potential than CD103+ DC and mainly interact with CD4+ T cells (Merad et al., 2013). Human CD141+ DC and CD1c+ DC share similar transcriptional profiles with murine CD103+ DC and CD11b+ DC, respectively, and are thought to represent their human counterparts (Dutertre et al., 2014; Haniffa et al., 2013).
We and others found that the absence of CD103+ DC abolishes tumor response to checkpoint blockade in experimental tumor models, while expansion and activation of CD103+ DC dramatically increased T cell recruitment to the tumor site and transformed response to checkpoint blockade (Broz et al., 2014; Hildner et al., 2008; Roberts et al., 2016; Salmon et al., 2016; Sánchez-Paulete et al., 2016). Here, we found that early lung adenocarcinoma tumors were significantly depleted in CD141+ DC compared to nLung, while CD1c+ DC were slightly increased in tumors, resulting in an increased CD1c+/CD141+ DC ratio at the tumor site.
We also found that tumor CD1c+ DC shared the same innate cytokine profile with monocytes, consistent with the notion that CD1c+ DC likely represent monocyte-derived cells generated upon entry at the tumor site, whereas CD141+ DC are thought to arise from DC-restricted precursors (Dutertre et al., 2014; Haniffa et al., 2013). Interestingly, DC localized close to T cells in TLS, in line with their potential key role in T cell activation and clonal expansion (Dieu-Nosjean et al., 2008). DC-derived LT has recently been shown to directly act on high endothelial venules (HEV) to promote lymphocyte homing to peripheral lymph nodes in vivo (Moussion and Girard, 2011). Our finding that DC and especially the CD141+ DC subset expressed Lymphotoxin beta (LTB) transcripts in lung tumor tissues likely reflects that CD141+ DC contribute to TLS formation, potentially through HEV-mediated recruitment of lymphocytes. This hypothesis is consistent with our finding that TLS-enriched tumors have increased T cells, and strengthens the mechanistic understanding of the positive prognostic value conferred by TLS when identified by DC-LAMP immunostaining (Dieu-Nosjean et al., 2008; Germain et al., 2014; Pitzalis et al., 2014). Altogether, these results suggest that expansion of intra-tumoral CD141+ DC may provide a key strategy for the induction of potent anti-tumor immunity.
Importantly, while macrophages were not enriched in the tumor lesion compared to nLung, tumor macrophages expressed a unique phenotype compared to macrophages in nLung. In particular, tumor macrophages expressed higher levels of PPARγ, a transcription factor known to drive an immunosuppressive program (Reddy, 2008; Ricote et al., 1998), and lower levels of the co-stimulatory molecule CD86. They also produced higher levels of IL-6, indicating that these tumor macrophages are pro-tumorigenic. CD206, thought to represent a marker of alternatively activated macrophages and tumor macrophages, was expressed at lower or similar levels on tumor macrophages compared to lung macrophages, consistent with recent data showing that CD206 is a marker of lung alveolar macrophages (Desch et al., 2016; Yu et al., 2016). This emphasizes the importance of paired analyses to distinguish tumor-driven immune changes from normal tissue-imprinting. Single cell transcriptomic analysis of myeloid cells further extended these results and identified a unique gene signature of tumor macrophages that included among other genes, TREM2, recently shown to promote chronic lung diseases through inhibition of macrophage apoptosis after acute viral infection (Wu et al., 2015). Finally, using multiplex tissue imaging, we identified clusters of PD-L1+ macrophages at the tumor invasive margin, suggesting their potential contribution to modulating T cell entry in the tumor lesion. Accordingly, increased macrophages correlated with reduced T cells at the tumor site and, in contrast to TLS-enriched tumors, lesions devoid of TLS were mostly enriched in macrophages. Thus, lung tumors enriched in macrophages and reduced in TLS may specifically benefit from immunotherapy strategies to deplete macrophages while expanding DC prior to treatment with checkpoint blockade.
By combining multiplex tissue imaging and paired single cell analysis of the tumor, nLung, and blood, this study provides a detailed immune cell atlas of early lung adenocarcinoma and identifies, along with specific T cell alterations, innate immune cell changes that are unique to the tumor lesion and absent from nLung. Our identification of significant innate immune cell changes in early stage lung adenocarcinoma lesions suggests that neo-adjuvant or adjuvant immunotherapy strategies tailored to restore innate immune changes might be uniquely poised to shape the tumor T cell microenvironment and transform tumor response to checkpoint blockade.
STAR METHODS
CONTACT FOR REAGENT AND RESOURCE SHARING
Further information and requests for resources and reagents should be directed to and will be fulfilled by the lead contact Miriam Merad (miriam.merad@mssm.edu).
EXPERIMENTAL MODEL AND SUBJECT DETAILS
Human Specimens
Blood, non-involved lung and tumor tissues were obtained from patients undergoing lung resection surgery at the Mount Sinai Medical Center (New York, NY) after obtaining informed consent. All protocols were reviewed and approved by the Institutional Review Board (IRB) at the Icahn School of Medicine at Mount Sinai (IRB 08-1236).
Patient Clinical Characteristics
Samples were collected from 32 patients, 28 of whom were diagnosed with adenocarcinoma and thus included in the study (Table S1). The 28 patients consisted of 12 males and 16 females and ranged from ages 47 to 83 years old, with a median of 67 years old.
METHOD DETAILS
Sample Collection
From the patients described above, blood was collected intraoperatively into sodium heparin tubes (BD). For solid tissues, care was taken to collect tumor with invasive margin and non-involved lung as distant as possible from the tumor and anatomic abnormalities. Tissue samples were placed in RPMI media (Corning) on ice. For all collected tissue samples, H&E slides were reviewed by a pathologist, and non-involved lung tissue samples with tumor infiltration (2 patients) were excluded from the analysis.
Collection of Histological Sections
Non-involved lung and tumor tissue were briefly washed in PBS. From each sample, two histological sections were carefully cut so as to not disturb tissue architecture. One histological slice was placed in 10% buffered formalin phosphate (Fisher Scientific) for 24 hours and stored in 70% ethanol before being embedded in paraffin. The other slice was placed in OCT (Tissue-Tek) and placed on dry ice before storage at -80°C.
Multiplexed Immunohistochemical Consecutive Staining on a Single Slide
Five μm-thick formalin-fixed paraffin-embedded (FFPE) tissue sections on glass slides were backed at 37°C overnight, deparaffinized in xylene, and rehydrated in decreasing concentrations of ethanol. Then, tissue sections were incubated in retrieval solution (Citrate buffer, pH6) for antigen retrieval at 95°C for 30 minutes. Tissue sections were incubated in 3% hydrogen peroxide and in serum-free protein block solution (Dako, X0909) before adding the primary antibody (CD68, clone KP1, Dako) for 1 hour at room temperature. After signal amplification using biotinylated-secondary antibody and streptavidin-horseradish peroxidase, chromogenic revelation was performed using 3-amino-9-ethylcarbazole (AEC). Slides were counterstained with hematoxylin, mounted with a glycerol-based mounting medium and scanned for digital imaging (Pannoramic 250 Flash III whole-slide scanner, 3DHISTECH). Then the same slides were successively stained as described (Remark et al., 2016). Primary antibodies were: anti-human CD3 (2GV6, Ventana), anti-human CD8 (C8/144b, Dako), anti-human CD20 (L26, Dako), anti-human DC-LAMP (1010E1.01, Novus biologicals), anti-human PD-L1 (E1L3N, Cell Signaling Technologies), anti-human CD206 (polyclonal, Abcam), and anti-human HLA Class I (EMR8-5, Abcam).
Histological Quantification
A piece of tumor sample was embedded in paraffin, and tumors and lung tissue included in the study were stained with H&E, and assessed by a lung pathologist for inclusion in the study. For tertiary lymphoid structure grading, adjacent slices were cut and stained for CD20 according to the above immunohistochemistry protocol. Analysis using Halo Software (IndicaLabs) was performed on tumor, excluding normal lung, empty space, and necrotic areas. B cell follicles were identified, and number and area of B cell follicles/mm2 were quantified. Only B cell follicles larger than 0.0014mm² were counted. MHC Class I immune-staining was quantified by the percent of tumor cells expressing the molecule.
TCR Variable Beta Chain Sequencing
Immunosequencing of the CDR3 regions of human TCRβ chains was performed using the ImmunoSEQ™ Assay (Adaptive Biotechnologies, Seattle, WA). Extracted genomic DNA was amplified in a bias-controlled multiplex PCR, followed by high-throughput sequencing. Sequences were collapsed and filtered in order to identify and quantitate the absolute abundance of each unique TCRβ CDR3 region for further analysis as previously described (Carlson et al., 2013; Robins et al., 2012; Robins et al., 2009)
Statistical Analyses of TCR-β Sequencing
Clonality was defined as 1- Peilou’s eveness (Kirsch et al., 2015) and was calculated on productive rearrangements by:
where pi is the proportional abundance of rearrangement i and N is the total number of rearrangements. Clonality values range from 0 to 1 and describe the shape of the frequency distribution: clonality values approaching 0 indicate a very even distribution of frequencies, whereas values approaching 1 indicate an increasingly asymmetric distribution in which a few clones are present at high frequencies. Clonality between experimental groups was compared using a two-tailed Wilcoxon Rank Sum test; correlations between T-cell fraction or clonality and CyTOF data were assessed using Spearman’s Rank Correlation after running a Shapiro-Wilk test for normality. Statistical analyses were performed in R version 3.3.
Tissue Digestion
Complete media was prepared with RPMI (Corning), 10% FBS (Life Technologies), 1% non-essential amino acids (Corning), 1% sodium-pyruvate (Corning), 1% L-glutamine (Corning), 1% penicillin-streptomycin (Life Technologies) and 1% HEPES buffer (Corning). The non-involved lung and tumor tissue remaining after collecting the histological sections were each minced with scissors in separate 6-well plates (Costar) and enzymatically digested in complete media supplemented with 0.225 mg/mL collagenase type IV (Sigma-Aldrich) for 45 minutes at 37°C. The samples were passed through a syringe and a 16-gauge needle to further separate and yield single cell suspensions. The cells were then filtered through a 70 μm cell strainer, washed, lysed in RBC buffer (BioLegend) and refiltered through a 70 μm cell strainer. The cells were resuspended in complete media and counted by hemocytometer.
PBMC Isolation
The PBMCs were collected via a Ficoll-Paque PLUS (GE Healthcare) gradient. PBMCs were washed and resuspended in complete media to create a single cell suspension. Cells were counted with a hemocytometer.
Secreted Soluble Factor Profiling
Single cell suspensions from non-involved lung, tumor, and PBMCs were cultured overnight for secreted soluble factor profiling. From each sample type, 200,000 cells were plated in duplicate into individual wells of a flat-bottom 96-well plate (Corning) in 250μL of complete media and incubated at 37°C overnight. 200μL of supernatant were collected and stored at -80°C until multiplex biomarkers assay was performed.
Measurement of Multiplex Biomarkers
The overnight supernatant collected for the secreted soluble factor profiling was used for the Luminex-200 multiplex biomarker assay, which was performed according to the manufacturer’s instructions. Briefly, cell suspension supernatants collected in microcentrifuge tubes were thawed and spun at 12,000 RPM for 10 minutes at 4°C to remove precipitates. Duplicates of 25 μl of each supernatant were analyzed undiluted to determine the concentrations of 41 biomarkers using a Milliplex MAP Human Cytokine/Chemokine 41plex kit (EMD Millipore, Billerica, Massachusetts) on the Luminex-200 multiplex immunoassay system. Data were analyzed using Milliplex Analyst 5.1 software (EMD Millipore, Billerica, Massachusetts). Measurements were corrected for noise by subtracting the average of two technical control wells for each secreted soluble factor.
CyTOF Sample Preparation
Antibodies were either purchased pre-conjugated from Fluidigm (formerly DVS Sciences) or purchased purified and conjugated in-house using MaxPar X8 Polymer Kits (Fluidigm) according to the manufacturer’s instructions. For the first cohort of 22 patients (18 with adenocarcinoma), cells from each tissue (blood, non-involved lung, and tumor) were labelled with a unique barcode by incubating with CD45-antibodies conjugated to distinct metal isotopes before pooling. The pooled sample was stained for viability with 5μM cisplatin in PBS (Fluidigm) for 2 minutes at RT. Cells were then washed and split into two equal aliquots. One aliquot was stained with a T-cell focused panel of antibodies (Panel 1, see below) and the other aliquot was stained with a myeloid focused panel of antibodies (Panel 2) for 30 min on ice. Samples were washed, fixed, and permeabilized (eBiosciences) at 4°C overnight before being stained with intracellular antibodies (see below, highlighted). They were washed and incubated in 0.125nM Ir intercalator (Fluidigm) diluted in PBS containing 2% formaldehyde, and stored at 4°C until acquisition.
For the second cohort of 10 patients, cells were stained with a mass cytometry panel including cytokines (Panel 3). Cells from each tissue type (blood, non-involved lung, tumor) were split into two fractions for a total of 6 aliquots. Aliquots from each tissue were incubated in 20μg/mL Brefeldin A (Sigma) alone or 20μg/mL Brefeldin A, 1.6μg/mL PMA (Sigma) and 6μg/mL Ionomycin (Sigma) for 4 hours at 37°C. Rhodamine vi ability stain (Fluidigm) was added for the last 20 minutes of incubation. Cells were washed and stained with cell surface antibodies for 30 minutes on ice, before being fixed and permeabilized (BD Biosciences). Samples were washed and incubated with a unique Pd barcode (Fluidigm) for 30 minutes at RT, washed, then pooled. The pooled sample was stained with intracellular antibodies for 30 minutes on ice, washed, and incubated in 0.125nM Ir intercalator (Fluidigm) diluted in PBS containing 2% formaldehyde and stored at 4°C until acquisition.
CyTOF Data Acquisition
Immediately prior to acquisition, samples were washed once with PBS, once with de-ionized water and then resuspended at a concentration of 1 million cells/ml in deionized water containing a 1/20 dilution of EQ 4 Element Beads (Fluidigm). The samples were acquired on a CyTOF2 (Fluidigm) equipped with a SuperSampler fluidics system (Victorian Airships) at an event rate of <500 events/second. After acquisition, the data were normalized using bead-based normalization in the CyTOF software. Barcodes were deconvoluted using the Fluidigm debarcoding software, or by manual Boolean gating in the case of CD45-barcoded samples. The data were gated to exclude residual normalization beads, debris, dead cells and doublets, leaving DNA+CD45+Cisplatinlow events for subsequent clustering and high dimensional analyses.
CyTOF Clustering: viSNE and Phenograph
CyTOF data was visualized using viSNE (Amir et al., 2013), a dimensionality reduction method which uses the Barnes-Hut acceleration of the t-SNE algorithm (van der Maaten, 2014; van der Maaten and Hinton, 2008). viSNE was implemented using either the Rtsne R package (Krijthe, 2015) or Cytobank (Chen and Kotecha, 2014). viSNE plots were generated separately for each patient incorporating all tissues.
Single cell data was clustered within and across samples using Phenograph (Levine et al., 2015), a clustering method based on the Louvain community detection algorithm (Blondel et al., 2008). The graph for Louvain was built using the FNN R package (Blondel et al., 2008), and the method was implemented using the igraph package (Csardi and Nepusz, 2006). In brief, Louvain communities of single cells were generated for each patient based on marker expression levels and independent of the sample source (blood, non-involved lung, or tumor). To detect common cell populations across patients, the mean protein expression levels among each Louvain community were then used to form larger Louvain communities (called metaclusters).
For the first patient cohort, 3 separate Phenograph analyses were performed using (1) CD3+ cells and Panel 1, (2) CD3- cells and Panel 1, and (3) CD3- cells and Panel 2. One patient was excluded from analysis of NK cells from Phenograph analysis (3) due to faulty antibody staining. The use of Phenograph analysis (2) was limited to the analysis of NK cells in Figures 3B and C, and B cells in Figure S1C. For the second cohort, Phenograph was run on CD45+ cells using Panel 3. To identify the major immune lineages, cell counts for the metacluster populations comprising lineages were manually added up across 18 patients (Panel 2) or 10 patients (Panel 3). Absolute numbers were assessed from second cohort (Panel 3).
CyTOF Statistical Analysis
Heatmaps of normalized marker expression, relative marker expression, and relative difference of population frequency were generated by GENE-E or Morpheus from the Broad Institute (http://www.broadinstitute.org/cancer/software/morpheus/). Paired tissue analyses were performed on the frequency of metaclusters and major lineages by performing paired T-tests using GraphPad Prism across tissues (*p<0.05, **p<0.01 and ***p<0.001). Correlation analyses between population frequencies and average normalized expression of protein markers in metaclusters were performed by computing Spearman’s rank-based correlation coefficient in GraphPad Prism.
Single-Cell Sorting
Over 700 cells were extracted from non-involved lung and over 1100 cells extracted from the tumor lesion of a pathological stage IA lung adenocarcinoma patient, were single-cell sorted according to the gating strategy shown in Data S2B into 384-well cell capture plates containing 2 μL of lysis solution and barcoded poly(T) reverse- transcription (RT) primers for single- cell RNA-seq. Barcoded single cell capture plates were prepared with a Bravo automated liquid handling platform (Agilent) as described previously (Jaitin et al., 2014). Four empty wells were kept in each 384-well plate as a no-cell control during data analysis. Immediately after sorting, each plate was spun down to ensure cell immersion into the lysis solution, snap frozen on dry ice, and stored at -80°C until processed.
Massively Parallel Single Cell RNA-Seq
Single-cell libraries were prepared as previously described (Jaitin et al., 2014). Briefly, mRNA from cells sorted into massively parallel single cell RNA-Seq (MARS-Seq) capture plates was barcoded and converted into cDNA and pooled using an automated pipeline. The pooled sample was then linearly amplified by T7 in-vitro transcription. The resulting RNA was fragmented and converted into a sequencing ready library by tagging the samples with pool barcodes and Illumina adaptor sequences during ligation, followed by reverse transcription and PCR. Each pool of cells was tested for library quality and concentration was assessed as described earlier (Jaitin et al., 2014). All RNA-seq libraries (pooled at equimolar concentration) were sequenced using Illumina sequencers at an average sequencing depth of ~40,000 reads per cell for RNA-seq. RNA-seq reads were aligned using hisat 0.1.5 and assigned to exons defined by a reference set obtained from the UCSC genome browser. We used statistics on empty-well spurious unique molecular identifier (UMI) detection to ensure that the batches we used for analysis show a low level of cross-single-cell contamination.
Single-Cell RNA-seq Clustering Analysis
MARS-seq reads were processed as previously described (Paul et al., 2015). In brief, we implemented a multiplicative probabilistic model that represented the probability of sampling UMIs for each gene as a function of the cell’s cluster and batch. We then inferred cluster and batch parameters using an expectation maximization (EM)-like procedure using non-linear optimization of the batch and cluster parameters’ likelihoods in iterations. After cells and genes with low expression levels were excluded, 1473 remaining cells were grouped into 15 clusters. Of these, 8 clusters demonstrated high expression of genes specific to mononuclear phagocytes and thus were selected for a final re-clustering analysis, producing 10 sub-clusters. These clusters were then identified as distinct immune cell types based on literature review of highly and differentially expressed genes. For Figures 5B, 6A, and 6B, transcript expression profiles of clusters 5 and 6 were combined by weighted average using the respective frequencies of each cluster among mononuclear phagocytes. Scatter plots and lists of differentially expressed genes between clusters were generated using the 50% most highly expressed transcripts among those detected after averaging expression profiles of compared clusters.
RNA Isolation for Bulk RNA-seq
A minimum of 5000 cells were sorted according to the gating strategy in Data S2A in 200ul of Lysis/Binding Buffer (Life technologies), lysed for 5 min and frozen at -8 °C. Cell lysates were thawed and messenger RNA was captured with 12 ul of Dynabeads oligo(dT) (Life technologies), and washed according to manufacture guidelines. Purified messenger RNA was eluted at 70C with 10ul of 10mM Tris-Cl pH 7.5 and stored at -80°C.
Bulk RNA-seq
We used the MARS-seq protocol (Jaitin et al., 2014), developed for single cell RNA-seq and discussed above, to produce RNA-seq libraries for bulk RNA-seq. One step of linear amplification of the initial mRNA pool was performed, followed by a library construction. A minimum of 2 replicate libraries were prepared for each sorted population. Libraries were sequenced using Illumina sequencers. RNA-seq reads were aligned as above, and expression levels were calculated and normalized for each sample to the total number of identified UMIs. Differential expression analysis was performed using the R-package Limma (Ritchie et al., 2015). Heatmaps were generated with genes differentially expressed with unadjusted p-value<0.01 and greater than 2-fold differential expression.
TCGA Analysis
Tumor RNAseq counts data from 515 lung adenocarcinoma patients were downloaded from Genomic Data Commons Portal https://gdc-portal.nci.nih.gov/. Normalized log-transformed expression was computed as log2(CPM) (counts per million reads) using the TMM normalization (Robinson and Oshlack, 2010). For each patient, expression levels of the genes differentially expressed between tumor macrophages and lung macrophages according to the scRNAseq experiment (Figure 4A) were centered so that the mean across all samples was zero. Consensus expression of tumor macrophage and lung macrophage genes for each sample were computed as the median across all the signature genes. Concordance index was calculated as the ratio of the consensus expression of tumor macrophage signature genes to the consensus expression of the lung macrophage signature genes. Patients were divided into the top and bottom 50th percentiles of the concordance index. Survival analysis was performed in R.
QUANTIFICATION AND STATISTICAL ANALYSIS
Several data types, such as CyTOF meta-clusters, secreted soluble factor concentration, or normalized transcript counts, were stratified. Bar graphs show mean ± SEM. Student’s paired t test, Spearman’s rank-based correlation coefficient, Fisher’s exact test, and the Long-rank test were used to determine significance. P-values are indicated on plots and in figure legends. (* p < 0.05, ** p < 0.01, *** p < 0.001).
DATA AND SOFTWARE AVAILABILITY
The data discussed in this publication have been deposited in NCBI’s Gene Expression Omnibus (Edgat et al., 2002) and are accessible through GEO Series accession number GSE97168 (https://www.ncbi.nlm.nih.gov/geo/query/acc.cgi?acc=GSE97168).
Supplementary Material
(A) Absolute numbers of CD45 positive cells in nLung and tumor samples, normalized to mg of tissue (n=10; see STAR Methods).
(B) Absolute numbers of the major immune lineages in tumor, normalized to mg of tissue (n=10).
(C) Bar plots showing the frequencies of the major immune lineages across blood, nLung and tumor in an additional 10-patient cohort.
(D, E) Cytokine secretion after overnight culture from PBMC and whole-tissue homogenate of nLung and tumor, measured by Luminex multiplex biomarker assay. Heatmap of normalized cytokine expression across tissues (D), and shown quantitatively (E; n=16; *p<0.05, **p<0.01 and ***p<0.001 by paired t-test).
(F) Correlation of tumor CX3CL1 concentration (pg/ml) and frequency of mononuclear phagocyte (MP) infiltrate at the tumor (Spearman’s rank-based correlation).
(G) Bar plots showing the frequency of two B cell metaclusters across tissue (left), as shown by heatmap indicating average relative expression of indicated markers across patients (right; n=18), identified by Phenograph analysis on CD3- cells using CyTOF Panel 1 (methods).
(H) Bar plots stratifying the major immune lineages by TLS enrichment (*p<0.05, **p<0.01 and ***p<0.001 by unpaired t-test).
(I) MICSSS for CD3, CD68, and CD20 for nLung and tumor lesions, showing representative TLS enriched (TLS+) and non-enriched (TLS-) tumors.
Bar plots show mean ± SEM.
(A) viSNE plots of CD3+ single cells across tissues showing normalized expression of 30 indicated markers of a representative patient.
(B) Bar plots showing frequencies across tissues for remaining metaclusters from Figure 2B (n=18).
(C) Ratio of CD8+ GranzymeB+ T cells to Tregs metacluster frequencies across tissue (n=18).
(D) Normalized expression of ICOS, 41BB, and CD38 on tumor CD3+ cells shown on viSNE plots for a representative patient (left) and bar pots showing normalized expression across patients for indicated metaclusters in tumor (n=18) (right).
(E) Heatmap of CD8- T cell bulk sequencing normalized UMI counts grouped by tissues across 6 patients (left). Scatter plot showing relative expression level of genes differentially expressed between nLung and tumor, with genes significantly different between tissue colored red (p<0.01, log2|FC|>1).
(F) Heat map illustrating single cell marker expression on Tregs from mass cytometry in a representative patient. Each row represents a single Treg cell and are grouped by tissue (left). Bar plots stratifying the normalized expression of indicated proteins in Tregs across tissue (right; n=18).
(G) Bar plots show the normalized expression of Granzyme B (top) and IFNγ (bottom) on indicated T cell metaclusters for 9 patient stratified by tissue type upon stimulation.
(H) Bar plots showing normalized expression of PD-1 found on CD4+ and CD8+ T cells in 10 lung adenocarcinoma patients.
(I) MICSSS for CD8 and CD20 showing a TLS in tumor of a representative patient.
(J) Frequency of CD8+ PD-1+ T cells in nLung to overall TCR repertoire clonality correlation plot (Spearman’s rank-based correlation).
Bar plots show mean ± SEM; *p<0.05, **p<0.01 and ***p<0.001 by paired t-test
(A) Bar plots of frequency of CD16+ and CD16- NK cell metaclusters stratified by tissue for 10 additional lung adenocarcinoma patients (*p<0.05, **p<0.01 and ***p<0.001 by paired t-test).
(B) Correlation plot showing the relationship of CD16+ monocyte frequency with CD16+ NK cell frequency (Spearman’s rank-based correlation).
(C) Bar plots of the normalized expression of granzyme B by CD16+ NK cells across nLung and tumor, upon stimulation (n=9; *p<0.05, **p<0.01 and ***p<0.001 by paired t-test).
(D) Correlation plot illustrating an indirect relationship of HLA-ABC expression on CD45- CD326+ cells and CD16+ NK cell frequency (n=10; Spearman’s rank-based correlation).
Bar plots show mean ± SEM.
(A) Expression levels of indicated transcripts by MARS-seq, normalized across mononuclear phagocyte clusters from Figure 3A.
(B) viSNE of CD3- immune cells generated across tissues of a representative patient colored by normalized expression of 28 indicated markers.
(C) Bar plots showing frequencies across tissues for remaining metaclusters from Figure 4C (n=18).
(D) Bar plots of CD16+ and CD14+ monocyte metacluster frequencies stratified by tissue for 10 additional lung adenocarcinoma patients.
(E) Normalized expression of IL-6, IL-8, IL-1β and TNFα across myeloid metaclusters in tumor for 10 adenocarcinoma patients.
(F) Normalized IL-1β expression across MARS-seq clusters (left) and of normalized protein expression from select Phenograph metaclusters in the tumor (right) with corresponding viSNE plots.
(G) Bar plots of normalized IL-1β expression by CD14+ monocytes across tissues (n=10)
Bar plots show mean ± SEM; *p<0.05, **p<0.01 and ***p<0.001 by paired t-test
(A) Bar plots of macrophage metacluster frequency stratified by tissue for 10 additional lung adenocarcinoma patients.
(B) Bar plot of normalized PD-L1 expression across metaclusters in nLung (n=16).
(C) Bar plot of normalized PD-L1 expression on macrophages in nLung and tumor (n=18; *p<0.05 by paired t-test).
(D) MICSSS staining for CD3 and CD68 showing patient from Figure 4E
(E) Correlation of macrophages to T cell fraction assessed either by TCR-sequencing (fraction of nucleated cells; blue) or by CyTOF (fraction of CD45; red; Spearman rank-based correlation).
(F) Normalized IL-6 expression across MARS-seq clusters (left) and of normalized protein expression from select Phenograph metaclusters in the tumor (right) with corresponding viSNE plots.
(G) Kaplan-Meir curves showing overall survival of 515 lung adenocarcinoma patients from TCGA stratified into Signaturehi and Signaturelo groups based on the ratio of the expression of tumor macrophage genes to lung macrophage genes (STAR Methods, p=0.015, Log-rank test).
(A) Bar plots of CD141+ DC and CD1c+ DC metaclusters stratified by tissue for 10 additional lung adenocarcinoma patients (*p<0.05, **p<0.01 and ***p<0.001 by paired t-test).
(B) Expression levels of indicated transcripts by MARS-seq, normalized across mononuclear phagocyte clusters from Figure 3A.
(C) Ratio of CD1c+ DC to CD141+ DC metacluster frequencies across tissue (n=18).
(D) CD3 and DC-LAMP MICSSS showing a TLS at the tumor margin in a representative patient.
(E) Heatmap showing the relative differences in metacluster frequency between nLung and blood across 16 patients, grouped by stage (top) and between tumor and blood across 18 patients, grouped by stage (bottom).
(F) Bar plots showing the stratification of various metacluster frequencies by stage (*p<0.05, by unpaired t-test).
(G, H) Bar plots showing the normalized expression of checkpoint molecules across indicated metacluster stratified by stage for PD-L1 (F) or PD-1 (G). (*p<0.05, by unpaired t-test).
Bar plots show mean ± SEM. n.s., not significant.
viSNE plots showing relative expression of the indicated markers, from maximum (red) to minimum (blue), across tumor, non-involved normal lung tissue, and peripheral blood mononuclear cells (PBMC) in a representative patient.
(A) Representative flow cytometry gating for the CD8+ and CD8- bulk sorting (top) and post-sort confirmation gatings are also displayed (bottom).
(B) Representative flow cytometry gating for the MARS-Seq single-cell sorting. CD45+ non-T cell, non-B cells were sorted from nLung and tumor tissue.
(C) viSNEs of tumor cells colored by 28 indicated Panel 3 markers with cell populations indicated, related to Fig. 4F, 5F, S4F, S5F from a representative patient.
Table S1. Lung Adenocarcinoma Patient Clinical Characteristics, Related to Figure 1.
Table S2. CyTOF Antibody Panels, Related to Figures 1A-D, 2A-E, 2G, 3A-E, 3G, 4B-G, 5A, 5C-F, 6C, 6F-G, S1A-C, S1F-H, S2A-D, S2F-H, SI, S3A-D, S4B-G, S5A-C, S5E-F, S6A, S6C and S6E-H. Yellow denotes intracellular stain.
Table S3. Table S3: Single Cell Genes, Related to Figures 4A, 4E-F, 5B, 5F, 6A, 6B, 6E, S4A, S4F. S5F and S6B. Mean expression, normalized by cluster.
KEY RESOURCES TABLE
| REAGENT or RESOURCE | SOURCE | IDENTIFIER |
|---|---|---|
|
| ||
| Antibodies
| ||
| Anti-Human CD45 (clone HI30) | Biolegend | Cat#: 304002; |
| RRID: AB_314390 | ||
|
| ||
| Anti-Human HLA-ABC (clone W6/32) | Biolegend | Cat#: 311402; |
| RRID: AB_314871 | ||
|
| ||
| Anti-Human CD19 (clone HIB19) – 142Nd | Fluidigm | Cat#: 3142001B |
|
| ||
| Anti-Human CD117 (clone 104D2) – 143Nd | Fluidigm | Cat#: 3143001B |
|
| ||
| Anti-Human CD141 (clone BDCA-3) | Biolegend | Cat#: 344102; |
| RRID: AB_2201808 | ||
|
| ||
| Anti-PE (clone PE001) – 145Nd | Fluidigm | Cat#: 3145006B |
|
| ||
| Anti-Human CD64 (clone 10.1) – 146Nd | Fluidigm | Cat#: 3146006B |
|
| ||
| Anti-Human Gata6 (clone 2F10G3) | Abcam | Cat#: Ab175425 |
|
| ||
| Anti-Human CD16 (clone 3G8) – 148Nd | Fluidigm | Cat#: 3148004B |
|
| ||
| Anti-Human CD123 (clone 6H6) – 151Eu | Fluidigm | Cat#: 3151001B |
|
| ||
| Anti-Human CD66b (clone 80H3) – 152Sm | Fluidigm | Cat#: 3152011B |
|
| ||
| Anti-Human CD1c (clone BDCA-1) | Fluidigm | Cat#: 331502; |
| RRID: AB_1088995 | ||
|
| ||
| Anti-Human CD163 (clone GHI/61) – 154Sm | Fluidigm | Cat#: 3154007B |
|
| ||
| Anti-Human CD86 (clone IT2.2) – 156Gd | Fluidigm | Cat#: 3156008B |
|
| ||
| Anti-Human CD33 (clone WM53) – 158Gd | Fluidigm | Cat#: 3158001B |
|
| ||
| Anti-Human CD14 (clone M5E2) – 160Gd | Fluidigm | Cat#: 3160001B |
|
| ||
| Anti-Human CD11c (clone Bu15) – 162Dy | Fluidigm | Cat#: 3162005B |
|
| ||
| Anti-APC (clone APC003) – 163Dy | Fluidigm | Cat#: 3163001B |
|
| ||
| Anti-Human CCR3 (clone 5E8) | Biolegend | Cat#: 310702; |
| RRID: AB_345394 | ||
|
| ||
| Anti-Human CD116 (clone 4H1) | Biolegend | Cat#: 305902; |
| RRID: AB_314568 | ||
|
| ||
| Anti-Human CD24 (clone ML5) – 166Er | Fluidigm | Cat#: 3166007B |
|
| ||
| Anti-Human CD206 (clone 15-2) – 168Er | Fluidigm | Cat#: 3168008B |
|
| ||
| Anti-Human PPARγ (clones 3A4A9, 1E6A1) | Abcam | Cat#: Ab70405; |
| RRID: AB_1269873 | ||
|
| ||
| Anti-Human CD3 (clone UCHT1) – 170Er | Fluidigm | Cat#: 3170001B |
|
| ||
| Anti-Human CD68 (clone Y1/82A) – 171Yb | Fluidigm | Cat#: 3171011B |
|
| ||
| Anti-Human CD11b (clone M1/70) – 172Yb | Fluidigm | Cat#: 3172012B |
|
| ||
| Anti-Human HLA-DR (clone L243) – 174Yb | Fluidigm | Cat#: 3174001B |
|
| ||
| Ant-Human PD-L1 (clone 29E.2A3) -175Lu | Fluidigm | Cat#: 3175017B |
|
| ||
| Anti-Human CD56 (clone NCAM16.2) – 176Yb | Fluidigm | Cat#: 3176008B |
|
| ||
| Anti-Human CCR2 PE (clone K036C2) | Biolegend | Cat#: 357026; |
| RRID: AB_2562059 | ||
|
| ||
| Anti-Human CD115 APC (clone 9-4D2-1E4) | Biolegend | Cat#: 347306; |
| RRID: AB_2562441 | ||
|
| ||
| Anti-Human CCR6 (clone G034E3) – 141Pr | Fluidigm | Cat#: 3141003A |
|
| ||
| Anti-Human CD45RA (clone HI100) -143Nd | Fluidigm | Cat#: 3143006B |
|
| ||
| Anti-Human CD38 (clone HIT2) -144Nd | Fluidigm | Cat#: 3144014B |
|
| ||
| Anti-Human CD4 (clone RPA-T4) – 145Nd | Fluidigm | Cat#: 3145001B |
|
| ||
| Anti-Human CD8a (clone RPA-T8) – 146Nd | Fluidigm | Cat#: 3146001B |
|
| ||
| Anti-Human CD73 (clone AD2) | Biolegend | Cat#: 344002; |
| RRID: AB_2154067 | ||
|
| ||
| Anti-Human CD127 (clone A019D5) – 149Sm | Fluidigm | Cat#: 3149011B |
|
| ||
| Anti-Human LAG3 (clone874501) -150Nd | Fluidigm | Cat#: 3150016B |
|
| ||
| Anti-Human ICOS (clone DX29) – 151Eu | Fluidigm | Cat#: 3151008B |
|
| ||
| Anti-Human TCRγδ (clone 11F2) – 152Sm | Fluidigm | Cat#: 3152008B |
|
| ||
| Anti-Human TIM3 (clone F38-2E2) – 153Eu | Fluidigm | Cat#: 3153008B |
|
| ||
| Anti-Human CD27 (clone L128) – 155Gd | Fluidigm | Cat#: 3155001B |
|
| ||
| Anti-Human CXCR3 (clone G025H7) – 156Gd | Fluidigm | Cat#: 3156004B |
|
| ||
| Anti-Human CCR4 (clone 205410) – 158Gd | Fluidigm | Cat#: 3158006A |
|
| ||
| Anti-Human CD39 (clone A1) – 160Gd | Fluidigm | Cat#: 3160004B |
|
| ||
| Anti-Human CTLA4 (clone 14D3) – 161Dy | Fluidigm | Cat#: 3161004B |
|
| ||
| Anti-Human Foxp3 (clone PCH101) – 162Dy | Fluidigm | Cat#: 3162011A |
|
| ||
| Anti-Human 41BB (clone 4B4-1) | Biolegend | Cat #: 309802; |
| RRID: AB_314781 | ||
|
| ||
| Anti-Human CD161 (clone HP-3G10) – 164Dy | Fluidigm | Cat#: 3164009B |
|
| ||
| Anti-Human BTLA (clone MIH26) | Biolegend | Cat#: 344502; |
| RRID: AB_2043950 | ||
|
| ||
| Anti-Human CCR7 (clone G043H7) – 167Er | Fluidigm | Cat#: 3167009A |
|
| ||
| Anti-Human CD25 (clone 2A3) – 169Tm | Fluidigm | Cat#: 3169003B |
|
| ||
| Anti-Human Granzyme B (clone GB11) – 171Yb | Fluidigm | Cat#: 3171002B |
|
| ||
| Anti-Human GITR (clone 621) | Biolegend | Cat#: 311602; |
| AB_314885 | ||
|
| ||
| Anti-Human PD-1 (clone EH12.2H7) – 175Lu | Fluidigm | Cat#: 3175008B |
|
| ||
| Anti-Human CD57 (clone HCD57) | Biolegend | Cat#: 322302; |
| RRID: AB_535988 | ||
|
| ||
| Anti-Human CD326 (clone 9C4) | Fluidigm | Cat#: 3141006B |
|
| ||
| Anti-Human CD19 (clone HIB19) | Biolegend | Cat#: 302202; |
| RRID: AB_314232 | ||
|
| ||
| Anti-Human CD45RA (clone HI100) | Biolegend | Cat#: 304102; |
| RRID: AB_314406 | ||
|
| ||
| Anti-Human CD4 (clone RPA-T4) | Biolegend | Cat#: 300501; |
| RRID: AB_314069 | ||
|
| ||
| Anti-Human CD8a (clone RAP-T8) | Biolegend | Cat#: 301002; |
| RRID: AB_314120 | ||
|
| ||
| Anti-Human IL-1ß (clone H1b-98) | Biolegend | Cat#: 511602; |
| RRID: AB_1236518 | ||
|
| ||
| Anti-Human CD16 (clone 3G8) | Biolegend | Cat#: 302002; |
| RRID: AB_314202 | ||
|
| ||
| Anti-Human CD127 (clone A019D5) | Biolegend | Cat#: 351302; |
| RRID: AB_10718513 | ||
|
| ||
| Anti-Human CD1c (BDCA-1) | Biolegend | Cat#: 331502; |
| RRID: AB_1088995 | ||
|
| ||
| Anti-Human CD123 (clone 6H6) | Biolegend | Cat#: 306002; |
| RRID: AB_314576 | ||
|
| ||
| Anti-Human CD66b (clone G10F5) | Biolegend | Cat#: 305102; |
| RRID: AB_314494 | ||
|
| ||
| Anti-Human TNFα (clone Mab11) | Biolegend | Cat#: 502902; |
| RRID: AB_315254 | ||
|
| ||
| Anti-Human CD86 (clone IT2.2) | Biolegend | Cat#: 305402; |
| RRID: AB_314522 | ||
|
| ||
| Anti-Human CD27 (clone O323) | Biolegend | Cat#: 302802; |
| RRID: AB_314294 | ||
|
| ||
| Anti-Human IL-6 (clone MQ2-13A5) | Fluidigm | Cat#: 501102; |
| RRID: AB_315150 | ||
|
| ||
| Anti-Human IFNγ (clone B27) | Fluidigm | Cat#: 506502; |
| RRID: AB_315435 | ||
|
| ||
| Anti-Human CCL3 (clone 93342) | R&D Systems | Cat#: MAB2701; |
| RRID: AB_2259652 | ||
|
| ||
| Anti-Human CD14 (clone M5E2) | Biolegend | Cat#: 301802; |
| RRID: AB_314184 | ||
|
| ||
| Anti-Human CD56 (clone B159) | BD Biosciences | Cat#: 555514; |
| RRID: AB_395904 | ||
|
| ||
| Anti-Human CD169 (clone 7-239) | Biolegend | Cat#: 346002; |
| RRID: AB_2189031 | ||
|
| ||
| Anti-Human CD68 (clone Y1/82A) | Biolegend | Cat#: 333802; |
| RRID: AB_1089058 | ||
|
| ||
| Anti-Human CCL4 (clone 24006) | R&D Systems | Cat#: MAB271; |
| RRID: AB_2071178 | ||
|
| ||
| Anti-Human CD25 (clone M-A251) | Biolegend | Cat#: 356102; |
| RRID: AB_2561752 | ||
|
| ||
| Anti-Human CD11c (clone Bu15) | Biolegend | Cat#: 337202; |
| RRID: AB_1236381 | ||
|
| ||
| Anti-Human CD3 (clone UCHT1) | Biolegend | Cat#: 300402; |
| RRID: AB_314056 | ||
|
| ||
| Anti-Human PD-L1 (clone 29E.2A3) | Biolegend | Cat#: 329702; |
| RRID: AB_940372 | ||
|
| ||
| Anti-Human CD38 (clone HB-7) | Biolegend | Cat#: 356602; |
| RRID: AB_2561794 | ||
|
| ||
| Anti-Human CD161 (clone HP-3G10) | Biolegend | Cat#: 339902; |
| RRID: AB_1501090 | ||
|
| ||
| Anti-Human CD206 (clone 15-2) | Biolegend | Cat#: 321102; |
| RRID: AB_571923 | ||
|
| ||
| Anti-Human IL-8 (clone E8N1) | Biolegend | Cat#: 511402; |
| RRID: AB_893460 | ||
|
| ||
| Anti-Human HLADR (clone L243) | Biolegend | Cat#: 307602; |
| RRID: AB_314680 | ||
|
| ||
| Anti-Human PD-1 (clone EH12.2H7) | Biolegend | Cat#: 329902; |
| RRID: AB_940488 | ||
|
| ||
| Anti-Human Granzyme B (clone GB11) | ThermoFisher | Cat#: MA1-80734; |
| RRID: AB_931084 | ||
|
| ||
| Anti-Human CD11b (clone ICRF44) | Fluidigm | Cat#: 3209003B |
|
| ||
| Anti-Human CD3 (clone 2GV6) | Ventana | Cat#: 790-4341 |
|
| ||
| Anti-Human CD8 (clone C8/144b) | Dako | Cat#: M7103 |
|
| ||
| Anti-Human CD20 (clone L26) | Dako | Cat#: 0755 |
|
| ||
| Anti-Human DC-LAMP (clone 1010E1.01) | Novus Biologicals | Cat#: DDX0191P |
|
| ||
| Anti-Human CD163 (clone EPR4166(2)) | Abcam | Cat#: ab129202 |
|
| ||
| Anti-Human FoxP3 (clone 236A/E7) | Abcam | Cat#: ab20034 |
|
| ||
| Anti-Human PD-L1 (E1L3N) | CST | Cat#: 13684 |
|
| ||
| Anti-Human Pan-Cytokeratins (clone Ae1/Ae3) | Dako | Cat#: ab27988 |
|
| ||
| Anti-Human Ki-67 (clone 30-9) | Ventana | Cat#: 790-4286 |
|
| ||
| Anti-Human Granzyme B (clone GrB-7) | Dako | Cat#: M723501-2 |
|
| ||
| Anti-Human HLA-ABC (clone EMR8-5) | Abcam | Cat#: ab70328 |
|
| ||
| Anti-Human CD68 (clone KP1) | Dako | Cat#: M081401-2 |
|
| ||
| Biological Samples
| ||
| Blood, non-involved lung, and tumor tissue | Fresh resections from patients with informed consent for an IRB-approved study. Surgeries were performed by the Department of Cardiothoracic Surgery, Mount Sinai Hospital. | N/A |
|
| ||
| Chemicals, Peptides, and Recombinant Proteins
| ||
| Brefeldin A | Sigma-Aldrich | Cat#: B7651 |
|
| ||
| Phorbol 12-myristate 13-acetate | Sigma-Aldrich | Cat#: 79346 |
|
| ||
| Ionomycin | Sigma-Aldrich | Cat#: I0634 |
|
| ||
| Cell-ID Intercalator-103Rh | Fluidigm | Cat#: 201103A |
|
| ||
| Collagenase from Clostridium Histolyticum, Type IV | Sigma-Aldrich | Cat#: C5138 |
|
| ||
| Ficoll-Paque™ PLUS | GE Healthcare | Cat#: 17144003 |
|
| ||
| Critical Commercial Assays
| ||
| Foxp3 / Transcription Factor | eBioscience | Cat#: 00-5521-00 |
| Fixation/Permeabilization Concentrate and Diluent | ||
|
| ||
| Permeabilization Buffer (10X) | eBioscience | Cat#: 00-8333-56 |
|
| ||
| Cytofix/Cytoperm | BD Biosciences | Cat#: 51-2090KZ |
|
| ||
| Perm/Wash | BD Biosciences | Cat#: 51-2091KZ |
|
| ||
| Maxpar® X8 Multimetal Labeling Kit | Fluidigm | Cat#: 201300 |
|
| ||
| Deposited Data | ||
|
| ||
| Raw Data Files from MARS-Seq | NCBI Gene | GEO: GSE97168 |
| Expression Omnibus | ||
|
| ||
| Experimental Models: Cell Lines
| ||
| Experimental Models: Organisms/Strains
| ||
| Recombinant DNA
| ||
| Sequence-Based Reagents
| ||
| Software and Algorithms
| ||
| R | SOURCE: R Core Team (2016). R: A language and environment for statistical computing. R Foundation for Statistical Computing, Vienna, Austria. URL | https://www.R-project.org/. |
|
| ||
| tidyverse | Hadley Wickham (2016). tidyverse: Easily Install and Load ’Tidyverse’ Packages. R package version 1.0.0. | https://CRAN.R-project.org/package=tidyverse |
|
| ||
| ggplot2 | H. Wickham. ggplot2: Elegant Graphics for Data Analysis. Springer-Verlag New York, 2009. | https://cran.r-project.org/web/packages/ggplot2/index.html |
|
| ||
| viSNE | Nat Biotechnol. 2013 Jun; 31(6): 545–552. | N/A |
|
| ||
| Phenograph | Cell. 2015 Jul 2;162(1):184-97. | N/A |
|
| ||
| Other | ||
Highlights.
Paired analysis reveals a unique tumor immune signature independent of TNM stage
Depletion of CD141+ DC and enrichment of PPARγhi macrophages in stage I lung cancer
Reduced and impaired NK cells in stage I lung cancer
Harnessing TIM compartment may help enhance T-cell immunotherapies
Acknowledgments
We thank the Merad laboratory for helpful discussions and input. We would like to thank Helene Salmon for critical review of the manuscript. We would like to thank the Human Immune Monitoring Core (HIMC) for their excellent technical support and assistance throughout the project, in particular Adeeb Rahman and the members of the CyToF core, Oksana Mayovska and Victor Guo, and Manishkumar Patel. We would like to thank the Biorepository & Pathology Core and the Flow Cytometry facility. We would like to thank Jill Gregory for her assistance with the artwork. C.B. is funded by Foundation pour la Recherche Medicale DEA20150633125. M.M. is funded by NIH grants R01, R01 CA173861, U19AI128949, U24 AI 118644, U19 AI 117873-01.
Footnotes
Author contributions
Conceptualization, M.M., Y.L., and C.D.B.; Methodology, M.M., Y.L., A.R., I.A., E.D.A. and J.H.L.; Software, E.D.A., A.L.; Formal Analysis, Y.L., A.L., E.D.A., N.E., S.K., A.S., B.G., J.A.R., R.O.E., C.S., M.V. ; Investigation, Y.L., S.K., C.B., R.S., C.M., R.R., K.M., and A.R.; Resources, R.F. and A.W.; Data Curation, S.K., C.B., R.S., and C.D.B.; Writing- Original, M.M., Y.L., A.L., and S.K.; Writing- Review & Editing, M.M., Y.L., A.L., and S.K.; Visualization, Y.L., S.K., and A.L.; Supervision, M.M., A.R., I.A., D.P., C.D.B., S.K-S., M.B.B., S.G., and A.C. ; Project Administration, M.M.; Funding Acquisition, M.M.
Publisher's Disclaimer: This is a PDF file of an unedited manuscript that has been accepted for publication. As a service to our customers we are providing this early version of the manuscript. The manuscript will undergo copyediting, typesetting, and review of the resulting proof before it is published in its final citable form. Please note that during the production process errors may be discovered which could affect the content, and all legal disclaimers that apply to the journal pertain.
References
- Aberle DR, Adams AM, Berg CD, Black WC, Clapp JD, Fagerstrom RM, Gareen IF, Gatsonis C, Marcus PM, Sicks JD, et al. Reduced lung-cancer mortality with low-dose computed tomographic screening. N Engl J Med. 2011;365:395–409. doi: 10.1056/NEJMoa1102873. [DOI] [PMC free article] [PubMed] [Google Scholar]
- Amir E-A, Davis KL, Tadmor MD, Simonds EF, Levine JH, Bendall SC, Shenfeld DK, Krishnaswamy S, Nolan GP, Pe’er D. viSNE enables visualization of high dimensional single-cell data and reveals phenotypic heterogeneity of leukemia. Nat Biotechnol. 2013;31:545–552. doi: 10.1038/nbt.2594. [DOI] [PMC free article] [PubMed] [Google Scholar]
- Besse B, Johnson M, Janne PA, Janne PA, Garassino MC, Eberhardt WE, Peters S, Toh CK, Kurata T, Li Z, et al. 16LBA Phase II, single-arm trial (BIRCH) of atezolizumab as first-line or subsequent therapy for locally advanced or metastatic PD-L1-selected non-small cell lung cancer (NSCLC) European Journal of Cancer. 2015;51 [Google Scholar]
- Black WC, Keeler EB, Soneji SS. Cost-effectiveness of CT screening in the National Lung Screening Trial. N Engl J Med. 2015;372:388. doi: 10.1056/NEJMc1414726. [DOI] [PubMed] [Google Scholar]
- Blondel VD, Guillaume J-L, Lambiotte R, Lefebvre E. Fast unfolding of communities in large networks. Journal of statistical mechanics: theory and experiment. 2008;2008:P10008. [Google Scholar]
- Broz ML, Binnewies M, Boldajipour B, Nelson AE, Pollack JL, Erle DJ, Barczak A, Rosenblum MD, Daud A, Barber DL, et al. Dissecting the tumor myeloid compartment reveals rare activating antigen-presenting cells critical for T cell immunity. Cancer cell. 2014;26:638–652. doi: 10.1016/j.ccell.2014.09.007. [DOI] [PMC free article] [PubMed] [Google Scholar]
- Carlson CS, Emerson RO, Sherwood AM, Desmarais C, Chung M-W, Parsons JM, Steen MS, LaMadrid-Herrmannsfeldt MA, Williamson DW, Livingston RJ, et al. Using synthetic templates to design an unbiased multiplex PCR assay. Nature Communications. 2013;4:2680. doi: 10.1038/ncomms3680. [DOI] [PubMed] [Google Scholar]
- Chang Q, Bournazou E, Sansone P, Berishaj M, Gao SP, Daly L, Wels J, Theilen T, Granitto S, Zhang X, et al. The IL-6/JAK/Stat3 Feed-Forward Loop Drives Tumorigenesis and Metastasis. Neoplasia. 2013;15:848–IN845. doi: 10.1593/neo.13706. [DOI] [PMC free article] [PubMed] [Google Scholar]
- Chen JJ, Yao PL, Yuan A, Hong TM, Shun CT, Kuo ML, Lee YC, Yang PC. Up-regulation of tumor interleukin-8 expression by infiltrating macrophages: its correlation with tumor angiogenesis and patient survival in non-small cell lung cancer. Clin Cancer Res. 2003;9 [PubMed] [Google Scholar]
- Chen TJ, Kotecha N. Cytobank: providing an analytics platform for community cytometry data analysis and collaboration. High-Dimensional Single Cell Analysis (Springer) 2014:127–157. doi: 10.1007/82_2014_364. [DOI] [PubMed] [Google Scholar]
- Csardi G, Nepusz T. The igraph software package for complex network research. InterJournal, Complex Systems. 2006;1695:1–9. [Google Scholar]
- Desch AN, Gibbings SL, Goyal R, Kolde R, Bednarek J, Bruno T, Slansky JE, Jacobelli J, Mason R, Ito Y, et al. Flow Cytometric Analysis of Mononuclear Phagocytes in Nondiseased Human Lung and Lung-Draining Lymph Nodes. Am J Respir Crit Care Med. 2016;193:614–626. doi: 10.1164/rccm.201507-1376OC. [DOI] [PMC free article] [PubMed] [Google Scholar]
- Dieu-Nosjean MC, Antoine M, Danel C, Heudes D, Wislez M, Poulot V, Rabbe N, Laurans L, Tartour E, de Chaisemartin L, et al. Long-term survival for patients with non-small-cell lung cancer with intratumoral lymphoid structures. J Clin Oncol. 2008;26:4410–4417. doi: 10.1200/JCO.2007.15.0284. [DOI] [PubMed] [Google Scholar]
- Dutertre CA, Wang LF, Ginhoux F. Aligning bona fide dendritic cell populations across species. Cell Immunol. 2014;291:3–10. doi: 10.1016/j.cellimm.2014.08.006. [DOI] [PubMed] [Google Scholar]
- Engblom C, Pfirschke C, Pittet MJ. The role of myeloid cells in cancer therapies. Nat Rev Cancer. 2016;16:447–462. doi: 10.1038/nrc.2016.54. [DOI] [PubMed] [Google Scholar]
- Fehrenbacher L, Spira A, Ballinger M, Kowanetz M, Vansteenkiste J, Mazieres J, Park K, Smith D, Artal-Cortes A, Lewanski C, et al. Atezolizumab versus docetaxel for patients with previously treated non-small-cell lung cancer (POPLAR): a multicentre, open-label, phase 2 randomised controlled trial. Lancet. 2016;387:1837–1846. doi: 10.1016/S0140-6736(16)00587-0. [DOI] [PubMed] [Google Scholar]
- Forde PM, Smith KN, Chaft JE, Hellmann M, Merghoub T, Wolchok JD, Yang SC, Battafarano RJ, Gabrielson E, Georgiades CS, et al. Neoadjuvant anti-PD1, nivolumab, in early stage resectable non-small-cell lung cancer. ESMO 2016 Congress. 2016;27:1–36. [Google Scholar]
- Gabrilovich DI, Ostrand-Rosenberg S, Bronte V. Coordinated regulation of myeloid cells by tumours. Nat Rev Immunol. 2012;12:253–268. doi: 10.1038/nri3175. [DOI] [PMC free article] [PubMed] [Google Scholar]
- Germain C, Gnjatic S, Tamzalit F, Knockaert S, Remark R, Goc J, Lepelley A, Becht E, Katsahian S, Bizouard G, et al. Presence of B cells in tertiary lymphoid structures is associated with a protective immunity in patients with lung cancer. Am J Respir Crit Care Med. 2014;189:832–844. doi: 10.1164/rccm.201309-1611OC. [DOI] [PubMed] [Google Scholar]
- Ginhoux F, Jung S. Monocytes and macrophages: developmental pathways and tissue homeostasis. Nat Rev Immunol. 2014;14:392–404. doi: 10.1038/nri3671. [DOI] [PubMed] [Google Scholar]
- Goc J, Germain C, Vo-Bourgais TK, Lupo A, Klein C, Knockaert S, de Chaisemartin L, Ouakrim H, Becht E, Alifano M, et al. Dendritic cells in tumor-associated tertiary lymphoid structures signal a Th1 cytotoxic immune contexture and license the positive prognostic value of infiltrating CD8+ T cells. Cancer Res. 2014;74:705–715. doi: 10.1158/0008-5472.CAN-13-1342. [DOI] [PubMed] [Google Scholar]
- Goldstraw P, Chansky K, Crowley J, Rami-Porta R, Asamura H, Eberhardt WEE, Nicholson AG, Groome P, Mitchell A, Bolejack V, et al. The IASLC Lung Cancer Staging Project: Proposals for Revision of the TNM Stage Groupings in the Forthcoming (Eighth) Edition of the TNM Classification for Lung Cancer. Journal of Thoracic Oncology. 2016;11:39–51. doi: 10.1016/j.jtho.2015.09.009. [DOI] [PubMed] [Google Scholar]
- Haniffa M, Collin M, Ginhoux F. Ontogeny and functional specialization of dendritic cells in human and mouse. Adv Immunol. 2013;120:1–49. doi: 10.1016/B978-0-12-417028-5.00001-6. [DOI] [PubMed] [Google Scholar]
- Hanna RN, Cekic C, Sag D, Tacke R, Thomas GD, Nowyhed H, Herrley E, Rasquinha N, McArdle S, Wu R, et al. Patrolling monocytes control tumor metastasis to the lung. Science. 2015;350:985–990. doi: 10.1126/science.aac9407. [DOI] [PMC free article] [PubMed] [Google Scholar]
- Herbst RS, Soria JC, Kowanetz M, Fine GD, Hamid O, Gordon MS, Sosman JA, McDermott DF, Powderly JD, Gettinger SN, et al. Predictive correlates of response to the anti-PD-L1 antibody MPDL3280A in cancer patients. Nature. 2014;515:563–567. doi: 10.1038/nature14011. [DOI] [PMC free article] [PubMed] [Google Scholar]
- Hildner K, Edelson BT, Purtha WE, Diamond M, Matsushita H, Kohyama M, Calderon B, Schraml BU, Unanue ER, Diamond MS, et al. Batf3 Deficiency Reveals a Critical Role for CD8α+ Dendritic Cells in Cytotoxic T Cell Immunity. Science. 2008;322:1097–1100. doi: 10.1126/science.1164206. [DOI] [PMC free article] [PubMed] [Google Scholar]
- Jaitin DA, Kenigsberg E, Keren-Shaul H, Elefant N, Paul F, Zaretsky I, Mildner A, Cohen N, Jung S, Tanay A, et al. Massively parallel single-cell RNA-seq for marker-free decomposition of tissues into cell types. Science. 2014;343:776–779. doi: 10.1126/science.1247651. [DOI] [PMC free article] [PubMed] [Google Scholar]
- Joshi NS, Akama-Garren EH, Lu Y, Lee DY, Chang GP, Li A, DuPage M, Tammela T, Kerper NR, Farago AF, et al. Regulatory T Cells in Tumor-Associated Tertiary Lymphoid Structures Suppress Anti-tumor T Cell Responses. Immunity. 2015;43:579–590. doi: 10.1016/j.immuni.2015.08.006. [DOI] [PMC free article] [PubMed] [Google Scholar]
- Kirsch I, Vignali M, Robins H. T-cell receptor profiling in cancer. Mol Oncol. 2015;9:2063–2070. doi: 10.1016/j.molonc.2015.09.003. [DOI] [PMC free article] [PubMed] [Google Scholar]
- Krijthe J. Rtsne: T-Distributed Stochastic Neighbor Embedding using Barnes-Hut Implementation. R package version 010. 2015 URL http://CRANR-projectorg/package=Rtsne.
- Lavin Y, Merad M. Macrophages: Gatekeepers of Tissue Integrity. Cancer Immunology Research. 2013;1:201–209. doi: 10.1158/2326-6066.CIR-13-0117. [DOI] [PMC free article] [PubMed] [Google Scholar]
- Lavin Y, Winter D, Blecher-Gonen R, David E, Keren-Shaul H, Merad M, Jung S, Amit I. Tissue-Resident Macrophage Enhancer Landscapes Are Shaped by the Local Microenvironment. Cell. 2014;159:1312–1326. doi: 10.1016/j.cell.2014.11.018. [DOI] [PMC free article] [PubMed] [Google Scholar]
- Levine JH, Simonds EF, Bendall SC, Davis KL, Amir E-A, Tadmor MD, Litvin O, Fienberg HG, Jager A, Zunder ER, et al. Data-Driven Phenotypic Dissection of AML Reveals Progenitor-like Cells that Correlate with Prognosis. Cell. 2015;162:184–197. doi: 10.1016/j.cell.2015.05.047. [DOI] [PMC free article] [PubMed] [Google Scholar]
- Merad M, Sathe P, Helft J, Miller J, Mortha A. The Dendritic Cell Lineage: Ontogeny and Function of Dendritic Cells and Their Subsets in the Steady State and the Inflamed Setting. Annual review of immunology. 2013;31 doi: 10.1146/annurev-immunol-020711-074950. [DOI] [PMC free article] [PubMed] [Google Scholar]
- Moussion C, Girard JP. Dendritic cells control lymphocyte entry to lymph nodes through high endothelial venules. Nature. 2011;479:542–546. doi: 10.1038/nature10540. [DOI] [PubMed] [Google Scholar]
- Naidoo J, Wang X, Woo KM, Iyriboz T, Halpenny D, Cunningham J, Chaft JE, Segal NH, Callahan MK, Lesokhin AM, et al. Pneumonitis in Patients Treated With Anti–Programmed Death-1/Programmed Death Ligand 1 Therapy. Journal of Clinical Oncology. 0 doi: 10.1200/JCO.2016.68.2005. JCO.2016.2068.2005. [DOI] [PMC free article] [PubMed] [Google Scholar]
- Nishino M, Giobbie-Hurder A, Hatabu H, Ramaiya NH, Hodi F. Incidence of programmed cell death 1 inhibitor–related pneumonitis in patients with advanced cancer: A systematic review and meta-analysis. JAMA Oncology. 2016;2:1607–1616. doi: 10.1001/jamaoncol.2016.2453. [DOI] [PubMed] [Google Scholar]
- Paul F, Arkin Ya, Giladi A, Jaitin DA, Kenigsberg E, Keren-Shaul H, Winter D, Lara-Astiaso D, Gury M, Weiner A. Transcriptional heterogeneity and lineage commitment in myeloid progenitors. Cell. 2015;163:1663–1677. doi: 10.1016/j.cell.2015.11.013. [DOI] [PubMed] [Google Scholar]
- Pham CT. Neutrophil serine proteases: specific regulators of inflammation. Nat Rev Immunol. 2006;6:541–550. doi: 10.1038/nri1841. [DOI] [PubMed] [Google Scholar]
- Pignon JP, Tribodet H, Scagliotti GV, Douillard JY, Shepherd FA, Stephens RJ, Dunant A, Torri V, Rosell R, Seymour L, et al. Lung adjuvant cisplatin evaluation: a pooled analysis by the LACE Collaborative Group. J Clin Oncol. 2008;26:3552–3559. doi: 10.1200/JCO.2007.13.9030. [DOI] [PubMed] [Google Scholar]
- Pitzalis C, Jones GW, Bombardieri M, Jones SA. Ectopic lymphoid-like structures in infection, cancer and autoimmunity. Nat Rev Immunol. 2014;14:447–462. doi: 10.1038/nri3700. [DOI] [PubMed] [Google Scholar]
- Qian B-Z, Li J, Zhang H, Kitamura T, Zhang J, Campion LR, Kaiser EA, Snyder LA, Pollard JW. CCL2 recruits inflammatory monocytes to facilitate breast-tumour metastasis. Nature. 2011;475:222–225. doi: 10.1038/nature10138. [DOI] [PMC free article] [PubMed] [Google Scholar]
- Reddy RC. Immunomodulatory Role of PPAR-γ in Alveolar Macrophages. Journal of Investigative Medicine. 2008;56:522–527. doi: 10.2310/JIM.0b013e3181659972. [DOI] [PubMed] [Google Scholar]
- Remark R, Merghoub T, Grabe N, Litjens G, Damotte D, Wolchok JD, Merad M, Gnjatic S. In-depth tissue profiling using multiplexed immunohistochemical consecutive staining on single slide. Science Immunology. 2016;1:aaf6925. doi: 10.1126/sciimmunol.aaf6925. [DOI] [PMC free article] [PubMed] [Google Scholar]
- Ricote M, Li AC, Willson TM, Kelly CJ, Glass CK. The peroxisome proliferator-activated receptor-gamma is a negative regulator of macrophage activation. Nature. 1998;391:79–82. doi: 10.1038/34178. [DOI] [PubMed] [Google Scholar]
- Ritchie ME, Phipson B, Wu D, Hu Y, Law CW, Shi W, Smyth GK. limma powers differential expression analyses for RNA-sequencing and microarray studies. Nucleic acids research. 2015:gkv007. doi: 10.1093/nar/gkv007. [DOI] [PMC free article] [PubMed] [Google Scholar]
- Roberts EW, Broz ML, Binnewies M, Headley MB, Nelson AE, Wolf DM, Kaisho T, Bogunovic D, Bhardwaj N, Krummel MF. Critical Role for CD103(+)/CD141(+) Dendritic Cells Bearing CCR7 for Tumor Antigen Trafficking and Priming of T Cell Immunity in Melanoma. Cancer Cell. 2016;30:324–336. doi: 10.1016/j.ccell.2016.06.003. [DOI] [PMC free article] [PubMed] [Google Scholar]
- Robins H, Desmarais C, Matthis J, Livingston R, Andriesen J, Reijonen H, Carlson C, Nepom G, Yee C, Cerosaletti K. Ultra-sensitive detection of rare T cell clones. Journal of immunological methods. 2012;375:14–19. doi: 10.1016/j.jim.2011.09.001. [DOI] [PMC free article] [PubMed] [Google Scholar]
- Robins HS, Campregher PV, Srivastava SK, Wacher A, Turtle CJ, Kahsai O, Riddell SR, Warren EH, Carlson CS. Comprehensive assessment of T-cell receptor beta-chain diversity in alphabeta T cells. Blood. 2009;114:4099–4107. doi: 10.1182/blood-2009-04-217604. [DOI] [PMC free article] [PubMed] [Google Scholar]
- Robinson MD, Oshlack A. A scaling normalization method for differential expression analysis of RNA-seq data. Genome Biol. 2010;11:R25. doi: 10.1186/gb-2010-11-3-r25. [DOI] [PMC free article] [PubMed] [Google Scholar]
- Salmon H, Franciszkiewicz K, Damotte D, Dieu-Nosjean MC, Validire P, Trautmann A, Mami-Chouaib F, Donnadieu E. Matrix architecture defines the preferential localization and migration of T cells into the stroma of human lung tumors. J Clin Invest. 2012;122:899–910. doi: 10.1172/JCI45817. [DOI] [PMC free article] [PubMed] [Google Scholar]
- Salmon H, Idoyaga J, Rahman A, Leboeuf M, Remark R, Jordan S, Casanova-Acebes M, Khudoynazarova M, Agudo J, Tung N, et al. Expansion and Activation of CD103(+) Dendritic Cell Progenitors at the Tumor Site Enhances Tumor Responses to Therapeutic PD-L1 and BRAF Inhibition. Immunity. 2016;44:924–938. doi: 10.1016/j.immuni.2016.03.012. [DOI] [PMC free article] [PubMed] [Google Scholar]
- Sánchez-Paulete AR, Cueto FJ, Martínez-López M, Labiano S, Morales-Kastresana A, Rodríguez-Ruiz ME, Jure-Kunkel M, Azpilikueta A, Aznar MA, Quetglas JI, et al. Cancer Immunotherapy with Immunomodulatory Anti-CD137 and Anti–PD-1 Monoclonal Antibodies Requires BATF3-Dependent Dendritic Cells. Cancer Discovery. 2016;6:71–79. doi: 10.1158/2159-8290.CD-15-0510. [DOI] [PMC free article] [PubMed] [Google Scholar]
- Spira A, Beane JE, Shah V, Steiling K, Liu G, Schembri F, Gilman S, Dumas YM, Calner P, Sebastiani P, et al. Airway epithelial gene expression in the diagnostic evaluation of smokers with suspect lung cancer. Nat Med. 2007;13:361–366. doi: 10.1038/nm1556. [DOI] [PubMed] [Google Scholar]
- Suzuki K, Kadota K, Sima CS, Nitadori J, Rusch VW, Travis WD, Sadelain M, Adusumilli PS. Clinical impact of immune microenvironment in stage I lung adenocarcinoma: tumor interleukin-12 receptor beta2 (IL-12Rbeta2), IL-7R, and stromal FoxP3/CD3 ratio are independent predictors of recurrence. J Clin Oncol. 2013;31:490–498. doi: 10.1200/JCO.2012.45.2052. [DOI] [PMC free article] [PubMed] [Google Scholar]
- Turley SJ, Cremasco V, Astarita JL. Immunological hallmarks of stromal cells in the tumour microenvironment. Nat Rev Immunol. 2015;15:669–682. doi: 10.1038/nri3902. [DOI] [PubMed] [Google Scholar]
- van der Maaten L. Accelerating t-SNE using tree-based algorithms. Journal of machine learning research. 2014;15:3221–3245. [Google Scholar]
- van der Maaten L, Hinton G. Visualizing Data using t-SNE. Journal of Machine Learning Research. 2008;9:2579–2605. [Google Scholar]
- Wendel M, Galani IE, Suri-Payer E, Cerwenka A. Natural killer cell accumulation in tumors is dependent on IFN-gamma and CXCR3 ligands. Cancer Res. 2008;68:8437–8445. doi: 10.1158/0008-5472.CAN-08-1440. [DOI] [PubMed] [Google Scholar]
- Wu K, Byers DE, Jin X, Agapov E, Alexander-Brett J, Patel AC, Cella M, Gilfilan S, Colonna M, Kober DL, et al. TREM-2 promotes macrophage survival and lung disease after respiratory viral infection. J Exp Med. 2015;212:681–697. doi: 10.1084/jem.20141732. [DOI] [PMC free article] [PubMed] [Google Scholar]
- Yona S, Jung S. Monocytes: subsets, origins, fates and functions. Curr Opin Hematol. 2010;17:53–59. doi: 10.1097/MOH.0b013e3283324f80. [DOI] [PubMed] [Google Scholar]
- Yoshie O, Matsushima K. CCR4 and its ligands: from bench to bedside. Int Immunol. 2015;27:11–20. doi: 10.1093/intimm/dxu079. [DOI] [PubMed] [Google Scholar]
- Yu H, Lee H, Herrmann A, Buettner R, Jove R. Revisiting STAT3 signalling in cancer: new and unexpected biological functions. Nat Rev Cancer. 2014;14:736–746. doi: 10.1038/nrc3818. [DOI] [PubMed] [Google Scholar]
- Yu YR, Hotten DF, Malakhau Y, Volker E, Ghio AJ, Noble PW, Kraft M, Hollingsworth JW, Gunn MD, Tighe RM. Flow Cytometric Analysis of Myeloid Cells in Human Blood, Bronchoalveolar Lavage, and Lung Tissues. Am J Respir Cell Mol Biol. 2016;54:13–24. doi: 10.1165/rcmb.2015-0146OC. [DOI] [PMC free article] [PubMed] [Google Scholar]
- Zhu W, Germain C, Liu Z, Sebastian Y, Devi P, Knockaert S, Brohawn P, Lehmann K, Damotte D, Validire P, et al. A high density of tertiary lymphoid structure B cells in lung tumors is associated with increased CD4+ T cell receptor repertoire clonality. OncoImmunology. 2015;4:e1051922. doi: 10.1080/2162402X.2015.1051922. [DOI] [PMC free article] [PubMed] [Google Scholar]
- Zhu YM, Webster SJ, Flower D, Woll PJ. Interleukin-8/CXCL8 is a growth factor for human lung cancer cells. Br J Cancer. 2004;91:1970–1976. doi: 10.1038/sj.bjc.6602227. [DOI] [PMC free article] [PubMed] [Google Scholar]
Associated Data
This section collects any data citations, data availability statements, or supplementary materials included in this article.
Supplementary Materials
(A) Absolute numbers of CD45 positive cells in nLung and tumor samples, normalized to mg of tissue (n=10; see STAR Methods).
(B) Absolute numbers of the major immune lineages in tumor, normalized to mg of tissue (n=10).
(C) Bar plots showing the frequencies of the major immune lineages across blood, nLung and tumor in an additional 10-patient cohort.
(D, E) Cytokine secretion after overnight culture from PBMC and whole-tissue homogenate of nLung and tumor, measured by Luminex multiplex biomarker assay. Heatmap of normalized cytokine expression across tissues (D), and shown quantitatively (E; n=16; *p<0.05, **p<0.01 and ***p<0.001 by paired t-test).
(F) Correlation of tumor CX3CL1 concentration (pg/ml) and frequency of mononuclear phagocyte (MP) infiltrate at the tumor (Spearman’s rank-based correlation).
(G) Bar plots showing the frequency of two B cell metaclusters across tissue (left), as shown by heatmap indicating average relative expression of indicated markers across patients (right; n=18), identified by Phenograph analysis on CD3- cells using CyTOF Panel 1 (methods).
(H) Bar plots stratifying the major immune lineages by TLS enrichment (*p<0.05, **p<0.01 and ***p<0.001 by unpaired t-test).
(I) MICSSS for CD3, CD68, and CD20 for nLung and tumor lesions, showing representative TLS enriched (TLS+) and non-enriched (TLS-) tumors.
Bar plots show mean ± SEM.
(A) viSNE plots of CD3+ single cells across tissues showing normalized expression of 30 indicated markers of a representative patient.
(B) Bar plots showing frequencies across tissues for remaining metaclusters from Figure 2B (n=18).
(C) Ratio of CD8+ GranzymeB+ T cells to Tregs metacluster frequencies across tissue (n=18).
(D) Normalized expression of ICOS, 41BB, and CD38 on tumor CD3+ cells shown on viSNE plots for a representative patient (left) and bar pots showing normalized expression across patients for indicated metaclusters in tumor (n=18) (right).
(E) Heatmap of CD8- T cell bulk sequencing normalized UMI counts grouped by tissues across 6 patients (left). Scatter plot showing relative expression level of genes differentially expressed between nLung and tumor, with genes significantly different between tissue colored red (p<0.01, log2|FC|>1).
(F) Heat map illustrating single cell marker expression on Tregs from mass cytometry in a representative patient. Each row represents a single Treg cell and are grouped by tissue (left). Bar plots stratifying the normalized expression of indicated proteins in Tregs across tissue (right; n=18).
(G) Bar plots show the normalized expression of Granzyme B (top) and IFNγ (bottom) on indicated T cell metaclusters for 9 patient stratified by tissue type upon stimulation.
(H) Bar plots showing normalized expression of PD-1 found on CD4+ and CD8+ T cells in 10 lung adenocarcinoma patients.
(I) MICSSS for CD8 and CD20 showing a TLS in tumor of a representative patient.
(J) Frequency of CD8+ PD-1+ T cells in nLung to overall TCR repertoire clonality correlation plot (Spearman’s rank-based correlation).
Bar plots show mean ± SEM; *p<0.05, **p<0.01 and ***p<0.001 by paired t-test
(A) Bar plots of frequency of CD16+ and CD16- NK cell metaclusters stratified by tissue for 10 additional lung adenocarcinoma patients (*p<0.05, **p<0.01 and ***p<0.001 by paired t-test).
(B) Correlation plot showing the relationship of CD16+ monocyte frequency with CD16+ NK cell frequency (Spearman’s rank-based correlation).
(C) Bar plots of the normalized expression of granzyme B by CD16+ NK cells across nLung and tumor, upon stimulation (n=9; *p<0.05, **p<0.01 and ***p<0.001 by paired t-test).
(D) Correlation plot illustrating an indirect relationship of HLA-ABC expression on CD45- CD326+ cells and CD16+ NK cell frequency (n=10; Spearman’s rank-based correlation).
Bar plots show mean ± SEM.
(A) Expression levels of indicated transcripts by MARS-seq, normalized across mononuclear phagocyte clusters from Figure 3A.
(B) viSNE of CD3- immune cells generated across tissues of a representative patient colored by normalized expression of 28 indicated markers.
(C) Bar plots showing frequencies across tissues for remaining metaclusters from Figure 4C (n=18).
(D) Bar plots of CD16+ and CD14+ monocyte metacluster frequencies stratified by tissue for 10 additional lung adenocarcinoma patients.
(E) Normalized expression of IL-6, IL-8, IL-1β and TNFα across myeloid metaclusters in tumor for 10 adenocarcinoma patients.
(F) Normalized IL-1β expression across MARS-seq clusters (left) and of normalized protein expression from select Phenograph metaclusters in the tumor (right) with corresponding viSNE plots.
(G) Bar plots of normalized IL-1β expression by CD14+ monocytes across tissues (n=10)
Bar plots show mean ± SEM; *p<0.05, **p<0.01 and ***p<0.001 by paired t-test
(A) Bar plots of macrophage metacluster frequency stratified by tissue for 10 additional lung adenocarcinoma patients.
(B) Bar plot of normalized PD-L1 expression across metaclusters in nLung (n=16).
(C) Bar plot of normalized PD-L1 expression on macrophages in nLung and tumor (n=18; *p<0.05 by paired t-test).
(D) MICSSS staining for CD3 and CD68 showing patient from Figure 4E
(E) Correlation of macrophages to T cell fraction assessed either by TCR-sequencing (fraction of nucleated cells; blue) or by CyTOF (fraction of CD45; red; Spearman rank-based correlation).
(F) Normalized IL-6 expression across MARS-seq clusters (left) and of normalized protein expression from select Phenograph metaclusters in the tumor (right) with corresponding viSNE plots.
(G) Kaplan-Meir curves showing overall survival of 515 lung adenocarcinoma patients from TCGA stratified into Signaturehi and Signaturelo groups based on the ratio of the expression of tumor macrophage genes to lung macrophage genes (STAR Methods, p=0.015, Log-rank test).
(A) Bar plots of CD141+ DC and CD1c+ DC metaclusters stratified by tissue for 10 additional lung adenocarcinoma patients (*p<0.05, **p<0.01 and ***p<0.001 by paired t-test).
(B) Expression levels of indicated transcripts by MARS-seq, normalized across mononuclear phagocyte clusters from Figure 3A.
(C) Ratio of CD1c+ DC to CD141+ DC metacluster frequencies across tissue (n=18).
(D) CD3 and DC-LAMP MICSSS showing a TLS at the tumor margin in a representative patient.
(E) Heatmap showing the relative differences in metacluster frequency between nLung and blood across 16 patients, grouped by stage (top) and between tumor and blood across 18 patients, grouped by stage (bottom).
(F) Bar plots showing the stratification of various metacluster frequencies by stage (*p<0.05, by unpaired t-test).
(G, H) Bar plots showing the normalized expression of checkpoint molecules across indicated metacluster stratified by stage for PD-L1 (F) or PD-1 (G). (*p<0.05, by unpaired t-test).
Bar plots show mean ± SEM. n.s., not significant.
viSNE plots showing relative expression of the indicated markers, from maximum (red) to minimum (blue), across tumor, non-involved normal lung tissue, and peripheral blood mononuclear cells (PBMC) in a representative patient.
(A) Representative flow cytometry gating for the CD8+ and CD8- bulk sorting (top) and post-sort confirmation gatings are also displayed (bottom).
(B) Representative flow cytometry gating for the MARS-Seq single-cell sorting. CD45+ non-T cell, non-B cells were sorted from nLung and tumor tissue.
(C) viSNEs of tumor cells colored by 28 indicated Panel 3 markers with cell populations indicated, related to Fig. 4F, 5F, S4F, S5F from a representative patient.
Table S1. Lung Adenocarcinoma Patient Clinical Characteristics, Related to Figure 1.
Table S2. CyTOF Antibody Panels, Related to Figures 1A-D, 2A-E, 2G, 3A-E, 3G, 4B-G, 5A, 5C-F, 6C, 6F-G, S1A-C, S1F-H, S2A-D, S2F-H, SI, S3A-D, S4B-G, S5A-C, S5E-F, S6A, S6C and S6E-H. Yellow denotes intracellular stain.
Table S3. Table S3: Single Cell Genes, Related to Figures 4A, 4E-F, 5B, 5F, 6A, 6B, 6E, S4A, S4F. S5F and S6B. Mean expression, normalized by cluster.