



Abstract
Objective
Abnormal local and long-range brain connectivity have been widely reported in autism spectrum disorder (ASD), yet the nature of these abnormalities and their functional relevance at distinct cortical rhythms remains unknown. Investigations of intrinsic connectivity networks (ICNs) and their coherence across whole brain networks hold promise for determining whether patterns of functional connectivity abnormalities vary across frequencies and networks in ASD. In the present study, we aimed to probe atypical intrinsic brain connectivity networks in ASD from resting-state electroencephalography (EEG) data via characterizing the whole brain network.
Approach
Connectivity within individual ICNs (measured by spectral power) and between ICNs (measured by coherence) were examined at four canonical frequency bands via a time-frequency independent component analysis on high-density EEG, which were recorded from 20 ASD and 20 typical developing (TD) subjects during an eyes-closed resting state.
Main results
Among twelve identified electrophysiological ICNs, individuals with ASD showed hyper-connectivity in individual ICNs and hypo-connectivity between ICNs. Functional connectivity alterations in ASD were more severe in the frontal lobe and the default mode network (DMN) and at low frequency bands. These functional connectivity measures also showed abnormal age-related associations in ICNs related to frontal, temporal and motor regions in ASD.
Significance
Our findings suggest that ASD is characterized by the opposite directions of abnormalities (i.e., hypo- and hyper-connectivity) in the hierarchical structure of the whole brain network, with more impairments in the frontal lobe and the DMN at low frequency bands, which are critical for top-down control of sensory systems, as well as for both cognition and social skills.
Keywords: Autism, intrinsic connectivity networks, EEG, resting state, functional domain specificity
1. Introduction
Disrupted functional connectivity has been reported in autism spectrum disorder (ASD) (Vissers et al., 2012; Wass, 2011) in functional magnetic resonance imaging (fMRI) (Muller et al., 2011; Rane et al., 2015), electroencephalography (EEG) (Boutros et al., 2015; Wang et al., 2013), and magnetoencephalography (MEG) data (Lajiness-O’ Neill et al., 2014). However, the nature of these disruptions, e.g., increased or decreased connectivity and their specificity in functional domains, remains elusive. Inherent heterogeneity of ASD (Betancur, 2011; Di Martino et al., 2014), maturational processes (Uddin et al., 2013b), task demands (Muller et al., 2011), and data analysis methods (Nair et al., 2014), are all believed to impact indices of functional connectivity and their measurement in ASD. While no consensus has been reached, a mixed profile of long-range hypo-connectivity and local hyper-connectivity has been frequently reported in the literature (Coben et al., 2014; Courchesne and Pierce, 2005; Kitzbichler et al., 2015; Murias et al., 2007; Vissers et al., 2012; Wass, 2011), indicating impaired functional integration and segregation of distributed neural networks in ASD (Rudie et al., 2012).
Functional connectivity during resting state, which is independent of task confounds and performance variations (Fox and Raichle, 2007), has been increasingly investigated to characterize brain network activity in ASD using resting-state fMRI (rs-fMRI) (Muller et al., 2011; Rane et al., 2015; Vissers et al., 2012; Wass, 2011). Most of these studies focused on either global network efficiency (e.g., the whole brain network) or functional connectivity of specific networks of interest. Studies of the whole brain network using graph theory (Di Martino et al., 2013; Keown et al., 2013), regional homogeneity analysis (Di Martino et al., 2014), or other analytic techniques (Anderson et al., 2011; Chen et al., 2015; Supekar et al., 2013), mostly found enhanced local connectivity over multiple brain regions in ASD (Rudie and Dapretto, 2013), especially in the frontal lobe (Courchesne and Pierce, 2005). In contrast to global network patterns, recent studies on networks of interest indicated region-specific reduced long-range connectivity (Muller et al., 2011; Vissers et al., 2012), mainly on networks that may underlie behavioral abnormalities in ASD, e.g., default mode network (DMN) (Abbott et al., 2015; Assaf et al., 2010; Lynch et al., 2013; Washington et al., 2014), salience network (SN) (Uddin et al., 2013a), and executive control network (ECN) (Abbott et al., 2015). Accumulating data support the mixed long-range hypo-connectivity and local hyper-connectivity in rs-fMRI data from ASD in general, and these changes are not uniform for different brain regions and networks (Rane et al., 2015; Wass, 2011).
This pattern of resting-state functional connectivity changes in ASD is also supported by observations of atypical cortical oscillations from EEG/MEG data (Lajiness-O’ Neill et al., 2014; Wang et al., 2013). EEG/MEG signals, in a range of frequencies, are a putative hallmark of different local and large-scale network interactions (Siegel et al., 2012; Uhlhaas et al., 2010), and provide new insights into circuit mechanisms underlying atypical functional organization of brain networks in ASD (e.g., oscillatory frequency-band specific effects), which cannot be revealed by fMRI (Logothetis, 2008). Studies of band-specific resting-state functional connectivity in ASD using EEG/MEG have shown reduced long-range connectivity in low-frequency bands (e.g., delta and theta) (Barttfeld et al., 2011; Coben et al., 2008; Ghanbari et al., 2015; Murias et al., 2007) and increased short-range connectivity in high-frequency bands (e.g., gamma) (Kitzbichler et al., 2015). While the range of connectivity patterns has been mostly claimed in terms of inter-channel distances on the scalp (Lajiness-O’ Neill et al., 2014; Wang et al., 2013), two recent MEG studies have further examined the resting-state whole brain network in ASD using cortical source imaging techniques (Kitzbichler et al., 2015; Ye et al., 2014). Graphic metrics calculated among anatomically defined cortical regions, i.e., 90 (Ye et al., 2014) and 148 (Kitzbichler et al., 2015), also demonstrated the mixed pattern of hyper- and hypo-connectivity at different frequency bands. However, the functional domain specificity of these resting-state network abnormalities and their functional relevance remain largely unknown, especially in the studies of the whole brain network.
In the present study, we investigated abnormal functional connectivity in ASD by characterizing the whole brain network defined on intrinsic functional connectivity networks (not anatomically defined regions) at distinct cortical rhythms from high-density resting-state EEG (rs-EEG) data, using our newly developed data-driven independent component analysis (ICA) method (Shou et al., 2012). Compared to brain network analyses based on anatomically defined regions (Kitzbichler et al., 2015; Ye et al., 2014), the characterization of the whole brain network based on intrinsic functional connectivity networks, which are identified directly from functional data, could avoid pre-assumptions in defining network nodes and allow the difference between anatomical wiring and effective functional connections (Nomi and Uddin, 2015). Moreover, compared to single focal anatomic regions that are used to define network nodes, intrinsic functional connectivity networks could be formulated with multiple distributed but strongly synchronized anatomical regions, which allows the investigation of the whole brain network as a hierarchy structure (Onton et al., 2006). Our previous studies on simultaneously recorded EEG and fMRI data have demonstrated that rs-EEG component signals represent electrophysiological underpinning of rs-fMRI-derived intrinsic connectivity networks, as they were significantly correlated in both temporal (Yuan et al., 2012) and spatial domains (Yuan et al., 2016). We hypothesized that electrophysiological intrinsic connectivity networks can provide functional domain specific characterization of mixed hypo- and hyper-connectivity patterns due to their spatio-spectral resolution. We expected that network-based categorization of hypo- and hyper-connectivity would be consistent, to a certain degree, with the distance-based categorization in ASD in literatures. We further hypothesized that frontal and DMN networks would show more changes given their known involvement in social and cognitive abilities.
2. Materials and methods
2.1. Participants
Twenty participants with ASD (14 males and 6 females) and 20 typical developing healthy controls (TD, 13 males and 7 females) matched on age (range: 4–25 years), Full-Scale IQ and gender participated the study (Table 1). IQ testing for individuals older than 6 years was performed using the Wechsler Abbreviated Scale of Intelligence (Wechsler, 2011) (n = 19 ASD; 19 TD); individuals younger than 6 years completed the Wechsler Preschool and Primary Scale of Intelligence - Fourth Edition (Elliott, 2007) (n = 1 ASD; 1 TD).
Table 1.
Participant characteristics
| ASD (n=20)
|
TD (n=20)
|
Group comparison | |||||
|---|---|---|---|---|---|---|---|
| mean | s.d. | range | mean | s.d. | range | ||
|
|
|||||||
| Age | 10.5 | 4.1 | 4–20 | 12.3 | 6.2 | 4–25 | t=−1.08; p=.29 |
| Sex (male:female) | 6:14 | 7:13 | |||||
| Full scale IQ | 96.9 | 20.4 | 69–131 | 102.9 | 11.5 | 80–123 | t=−1.15; p=.26 |
| Verbal IQ | 92.2 | 23.6 | 58–131 | 105.9 | 14.2 | 82–140 | t=.62; p=.03 |
| Performance IQ ADOS subscale | 102.4 | 18.7 | 71–132 | 99.3 | 12.8 | 80–124 | t=−2.24; p=.54 |
| Communicationa | 6.4 | 2.5 | 1–9 | ||||
| Social | 10.6 | 3.9 | 5–19 | ||||
ADOS communication scores were not available for two ASD participants
At the time of testing, five participants with ASD were taking stimulant medications (Concerta, Adderall, Vyvanse, or Focalin). Of these participants, one was also taking a selective serotonin reuptake inhibitor (SSRI; Zoloft), one was taking an alpha agonist (Tenex), and one was taking a low-dose benzodiazepine (0.5 mg Klonipin taken 36 hours prior to testing). According to our structured interviews, each participant with ASD had or currently was receiving some forms of behavioral or educational intervention, though the types of therapies reported were diverse (e.g., applied behavioral analysis, educational supports), and the majority were not able to precisely describe the timing or frequency of different interventions.
Individuals with a DSM-V ASD diagnosis (American Psychiatric Association, 2013) and controls were recruited through community advertisements. Diagnoses of ASD were confirmed using the Autism Diagnostic Inventory-Revised (Lord et al., 1994), the Autism Diagnostic Observation Schedule - Second Edition (ADOS) (Lord et al., 2000) and expert clinical opinion. Participants with ASD were excluded if they had a known genetic or metabolic disorder associated with ASD (e.g., Fragile X syndrome). All controls had a score ≤ 8 on the Social Communication Questionnaire (Rutter et al., 2003), and no known history of psychiatric or neurological disorders, family history of ASD in first-, second- or third-degree relatives, or a history in first-degree relatives of a developmental or learning disorder, psychosis, or obsessive compulsive disorder. Participants taking antipsychotic or anticonvulsant medications were not included. No participant had a history of significant head injury, birth injury or seizure disorder. Written informed consent was obtained according to the Declaration of Helsinki for each adult participant and informed parental consent was obtained for individuals less than 18 years of age. Minors provided written assent. Study procedures were approved by the local Institutional Review Board.
2.2. EEG recordings
EEG were recorded with a Biosemi ActiveTwo 128-channel 24-bit resolution system, with active electrodes, sampled at 512 Hz and low-passed, i.e., DC-1/5th of the sample rate (-3dB), with a 5th order digital sync anti-aliasing filter. Five minutes of EEG were recorded during an eyes-closed resting state while participants sat on a reclining chair in a sound attenuated room with a dim light. During the experiment, participants and EEG signals were monitored to ensure that individuals maintained vigilance and did not fall asleep.
2.3. EEG preprocessing
Preprocessing was performed separately on EEG data from individuals (See all steps in Fig. 1(A)). Firstly, EEG was filtered offline with a band-pass filter of 0.5 Hz to 100 Hz and a notch filter of 60 Hz (from 58 Hz to 62 Hz). Secondly, the FASTER toolbox (Nolan et al., 2010) was used to remove artifacts by interpolating bad channels, removing bad epochs (of one second without overlap segmented from continuous EEG data), and removing bad independent components (ICs) following an independent component analysis (ICA) using the infomax algorithm (Lee et al., 1999) into 64 ICs. All thresholds of individual metrics in these steps were set at z-score > 3 in the FASTER toolbox. Thirdly, visual inspection was performed on remaining ICs from the previous step to remove additional artefactual ones related to ocular, cardiac and muscular activities (Jung et al., 2000). Finally, EEG data was re-referenced to an arithmetically derived common average. In summary, 4.2±3.3 (mean±std) bad channels, 35.8±18.6 bad segments, and 7.6±3.6 bad ICs were identified and processed, leaving 191.6±16.2 1-s epochs for subsequent analysis (ASD: 187.8±17 vs. TD: 195.4±14.6 TD, t = 1.5, p = 0.13).
Figure 1.

A diagram of all steps involved in EEG preprocessing and quantification of ICN-based functional connectivity abnormalities in ASD: (A) preprocessing steps for individual’s EEG data to remove artifacts, (B) steps of group-level tfICA method to identify functional ICNs, (C) steps of quantifying ICN-based functional connectivity abnormalities in ASD.
2.4. Identifying functional intrinsic connectivity networks (ICNs)
To extract functional ICNs, a group-level time-frequency independent component analysis (tfICA) method was applied to disentangle EEG data into different component signals (i.e., ICs) (Ding et al., 2014; Shou et al., 2012), which represent concurrent electrical activities generated from strongly synchronized and spatially organized brain regions (Onton et al., 2006). All steps were shown in Fig. 1(B). Firstly, preprocessed data from individuals was normalized to z values (to account for inter-subject variations) and temporally concatenated across all subjects, which has been widely used in ICA to identify networked brain activity in group analysis (Chen et al., 2013; Ding et al., 2014; Nugent et al., 2015; Ponomarev et al., 2014; Ramkumar et al., 2014; Yuan et al., 2012), assuming spatial similarity across subjects. Secondly, power spectra in the range of 2 Hz to 30 Hz at a 1 Hz resolution were calculated via a short-time Fourier transform (STFT) on individual 1-s EEG epochs, and then obtained time-frequency EEG (epochs × power spectra) data were decomposed into 32 ICs using tfICA (Bingham and Hyvarinen, 2000; Shou et al., 2012)1, after an initial data reduction using principal component analysis (PCA). Finally, rhythmic EEG components were characterized jointly with their spatial patterns on the electrode domain (i.e., the mixing matrix directly obtained from tfICA), and their spectral and temporal patterns (obtained by projecting individual time-frequency data before normalization onto the demixing matrix from tfICA). Thereafter, components that represent distinct networked brain activity with distinguished spectral and spatial patterns (Shou and Ding, 2015), were selected as electrophysiological functional ICNs of interest (see the Functional ICNs section). For further details about tfICA, please see Ding et al. (2014) and Shou et al. (2012).
2.5. Quantifying ICN-based functional connectivity abnormalities in ASD
After obtaining the ICNs, two metrics were used to quantify functional connectivity associated with identified ICNs and their abnormalities in ASD (Fig. 1(C)). Spectral powers of ICs were examined as a metric to evaluate the degree of synchronization of neural activity in individual ICNs (i.e., functional connectivity within indiviudal ICNs). Coherence (Srinivasan et al., 1998) between paired ICs was examined as a metric to evaluate functional connectivity across ICNs (see appendix for the equations to compute coherence). Both metrics were subject to a linear mixed model analysis to examine the difference between ASD and TD groups, and multiple regression analysis for their association with symptom severity/age/IQ.
For functional connectivity within individual ICNs, group differences in spectral powers at four frequency bands, i.e., delta (2–3 Hz), theta (4–7 Hz), alpha (8–12 Hz), and beta (13–30 Hz), were compared in a linear mixed model analysis (Cornew et al., 2012). Fixed effects were frequency (4 bands), ICN (12 ICNs), and group (ASD and TD), and subject was treated as a random effect. To account for the effect of age (Cornew et al., 2012; Kitzbichler et al., 2015; Nomi and Uddin, 2015), it was entered as a covariate. Custom models were created by including all group-related interactions (i.e., group×ICN, group×frequency, and group×ICN×frequency) and the main effect of group (Cornew et al., 2012).
For functional connectivity across ICNs, statistical analyses with two steps were performed. Firstly, a permutation test was performed on coherence data from each ICN pair at each frequency band in each group separately. Permuted data were built by shuffling the sequence of epoch data in one ICN of the paired two ICNs but keeping the sequence of the other one unchanged for 20,000 times. Significance level was p < 0.05 with Bonferroni correction. Secondly, a similar linear mixed model analysis as for within-ICN connectivity was performed to compare group differences of coherence values (after Fisher’s Z transform) between ASD and TD. Here, the fixed effect of ICN was replaced with ICN pair (66 ICN pairs). The significant group difference was claimed at an ICN pair when the group comparison had p<0.05 and the permutation test had p<0.05 (corrected) in at least one group.
3. Results
3.1. Functional ICNs
Twelve ICs (Fig. 2) were selected as functional ICNs of interest, given that they best represented previously identified ICs from rs-EEG signals in terms of spatial and spectral patterns (Chen et al., 2013; Ding et al., 2014; Ponomarev et al., 2014; Yuan et al., 2012). Based on their distinct scalp potential maps (Fig. 2(A)), these ICNs were named by the brain region covered (frontal (F), temporal (T), motor (M), central (C), parietal (P), or occipital (O)) followed by the dominant laterality (left (L), right (R), midline (M), or bilateral (B)), e.g., IC with left frontal coverage labeled as FL. Among these ICNs, four pairs show symmetric distributions (i.e., FL and FR, TL and TR, ML and MR, and OL and OR ICNs). Four of the ICNs (i.e., FL, FR, PB and CM ICNs) reflect oscillations across multiple distributed brain areas, whereas the remaining eight ICNs indicate oscillations in more localized regions. Moreover, five ICNs resemble key areas of the DMN as they have been reported in literatures (Assaf et al., 2010; Washington et al., 2014; Yuan et al., 2012), i.e., FM linked to the medial prefrontal cortex, PM to the posterior cingulate cortex, TL and TR to the bilateral medial temporal gyrus, PB to the bilateral inferior parietal lobule. Other ICNs also potentially correspond to well-characterized ICNs in rs-fMRI (Damoiseaux et al., 2006; van den Heuvel and Pol, 2010), i.e., FR and FL to bilateral executive control network (ECN), MR and ML to bilateral motor network, OL and OR to bilateral visual networks. In spectral patterns (Fig. 2(B)), all ICNs show frequency peaks in the alpha band, except that three frontal ICNs indicate peaks in the theta band, which are consistent with the regional specificity of dominant spectral powers over different brain regions (Klimesch, 1999).
Figure 2.

Spatial maps (A) and power spectrum densities (B) of selected independent components reflecting neuronal activities. Components related to nuisance processes are not displayed. FL frontal left, FM frontal midline, FR frontal right, TL temporal left, ML motor left, CM central midline, MR motor right, TR temporal right, PM parietal midline, PB parietal bilateral, OL occipital left, OR occipital right.
3.2. Within-ICN functional connectivity changes in ASD
The linear mixed model analysis reveals significant group by frequency (F(6,1692) = 126.18, p<0.0001) and group by ICN (F(22,1692) = 3.03, p<0.0001) interactions, showing greater power in the ASD than TD group in the delta band at TL (F(1,36) = 9.70, p<0.005), ML (F(1,36) = 5.41, p = 0.026), MR (F(1,36) = 4.19, p = 0.048), TR (F(1,36) = 5.42, p = 0.026), FL (F(1,36) = 6.55, p = 0.015), and FM (F(1,36) = 4.22, p = 0.047) ICNs, as well as in the theta band at TL (F(1,36) = 7.95, p < 0.01), and FL (F(1,36) = 4.47, p = 0.041) ICNs (see Fig. 3). There are no significant differences in the alpha and beta bands, or at FR, PM, PB, OL, and OR ICNs. Altogether, hyper-connectivity in ASD was observed in within-ICN functional connectivity covering frontal, temporal and motor regions, at the low frequency bands.
Figure 3.

Significant within-ICN connectivity (i.e., spectral power) differences between ASD and TD. * p<0.05, ** p<0.01, *** p<0.005.
3.3. Between-ICN functional connectivity changes in ASD
Pairs of ICNs with significant functional connectivity (p < 0.05, corrected) were observed at four frequency bands in both groups (Fig. 4) indicating significant connectivity in almost all ICN pairs in both groups. Among four frequency bands, the delta band showed the fewest number of ICN pairs with significant functional connectivity. The delta band also showed the largest difference in number of significantly connected ICN pairs between ASD and TD groups (i.e., 33 (ASD) vs. 45 (TD)), while the alpha band showed fewer differences and the theta and beta bands showed almost no group differences. In the delta band, the ICN pairs with significant functional connections only detected in the TD group are mainly between the central area (i.e., TR, TL, MR, ML and CM ICNs) and the parietal (i.e., PB and PM ICNs), central, and frontal areas (i.e., FR, FM and FL ICNs). In the alpha band, such ICN pairs in the TD group mainly existed between the frontal and the parietal/occipital areas (i.e., PB, PM, OL and OR ICNs).
Figure 4.
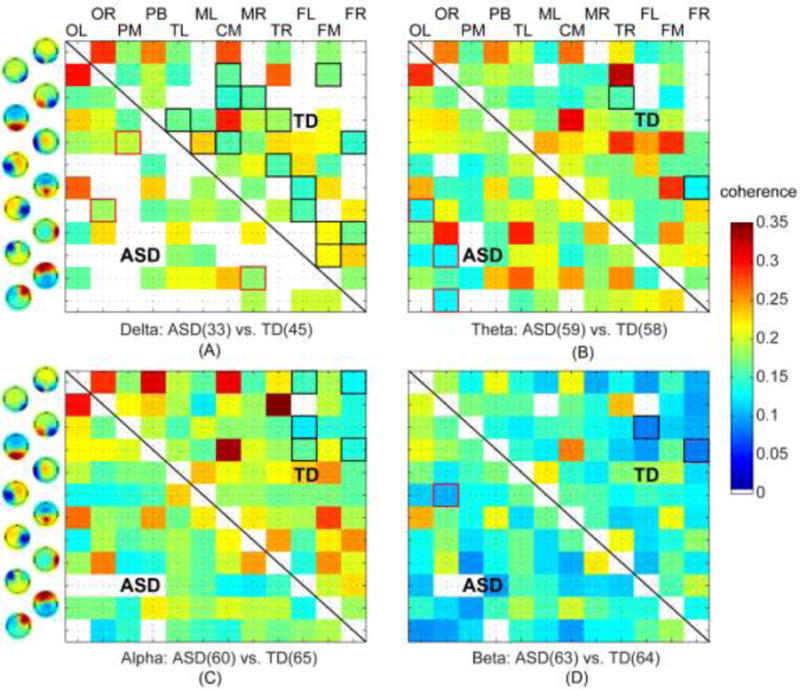
Significant between-ICN connectivity in the ASD or TD group at four frequency bands: (A) delta, (B) theta, (C) alpha, and (D) beta. The number of significant connectivity in each group was shown in each panel (i.e., the number in parentheses). Squares outlined in red reflect significantly connected ICN pairs for the ASD group, while squares outlined in black denote significantly connected ICN pairs for the TD group.
The linear mixed model analysis reveals significant group by frequency (F(6,9468) = 10.44, p < 0.00001) and group by ICN pair (F(130,9468) = 3.03, p < 0.00001) interactions, showing reduced coherence in the ASD relative to the TD group in the delta band at the pairs of OL and FM (F(1,36) = 5.94, p = 0.02), TL and FR (F(1,36) = 4.64, p = 0.038), MR and FR ICNs (F(1,36) = 4.57, p = 0.039), in the theta band at the pairs of OL and PB (F(1,36) = 6.28, p = 0.017), TR and FM ICNs (F(1,36) = 7.24, p = 0.011), as well as in the beta band at the pair of TL and FM ICNs (F(1,36) = 4.80, p = 0.035) (see Fig. 5). Among these differences, five of six are detected in the low frequency bands, i.e., delta and theta bands, and five of six involved at least one frontal ICN (FM or FR ICN). While the delta band pair between FR and TL ICNs only showed significant connection in the control, other pairs showed significant connections in both groups. Altogether, hypo-connectivity in ASD was detected in several between-ICN functional connectivity, mostly involving the frontal region and the low frequency bands.
Figure 5.

Significant between-ICN coherence differences between ASD and TD at the delta, theta and beta bands.
3.4. Associations with symptom severity/age/IQ
The associations of functional connectivity with ADOS total score, full scale IQ, and age were examined using a multiple regression analysis for each group. The regression analyses reveal that only six within-ICN connectivity and one between-ICN connectivity had significant age-association in at least one group (Table 2). Among six ICNs that have significantly decreased functional connectivity as a function of age, three are detected in the ASD group (i.e., the delta band power of TL and FL ICNs, and the theta band power of TL ICN) and the other three in the TD group (i.e., the delta band power of MR, ML and TR ICNs). For the between-ICN connectivity, the ICN pair has significantly increased connectivity with age in the ASD group at the delta band, but not in the TD group. Moreover, these different age effects between ASD and TD groups were also revealed in the linear mixed model analysis, i.e., significant or tendency towards significant group × age interaction in these ICN or ICN pairs (TL: F = 5.7, p < .05; ML, F = 4.33, p < .05; MR, F = 3.52, p = 0.069; TR, F = 5.19, p < .05; FL, F = 4.01, p = .053; TL, F = 5.95, p < .05; TL-FR, F = 5.17, p < .05). For other regressors (i.e., ADOS or IQ scores), no significant associations survived Bonferroni correction.
Table 2.
Summary of the ICNs and between-ICN pairs that had significant beta coefficient for age in at least one group. Bold fond denotes significant regressor of age (p < 0.05 with Bonferroni correction).
| Frequency | ASD (n=20) | TD (n=20) | |||||||
|---|---|---|---|---|---|---|---|---|---|
|
| |||||||||
| R2 | beta | t | p | R2 | beta | t | p | ||
| Within-ICN | |||||||||
| TL | Delta | .53 | −.81 | 3.80 | .0020 | .34 | −.58 | 2.96 | .009 |
| ML | Delta | .43 | −.74 | 3.16 | .007 | .46 | −.67 | 3.72 | .0017 |
| MR | Delta | .37 | −.63 | 2.59 | .02 | .52 | −.70 | 4.17 | .0006 |
| TR | Delta | .50 | −.77 | 3.51 | .0034 | .51 | −.71 | 4.18 | .0006 |
| FL | Delta | .50 | −.81 | 3.68 | .0025 | .35 | −.59 | 3.00 | .008 |
| TL | Theta | .56 | −.80 | 3.89 | .0017 | .38 | −.61 | 3.18 | .006 |
|
| |||||||||
| Between-ICN | |||||||||
| TL-FR | Delta | .46 | .78 | 3.44 | .0040 | .02 | −.143 | .597 | .56 |
4. Discussion
The aim of this study was to characterize electrophysiological ICNs and frequency band-specific functional connectivity abnormalities in individuals with ASD. Our findings are consistent with prior resting-state fMRI studies of ASD showing a mixed profile of local hyper-connectivity and hypo-connectivity between distal brain regions. These findings are novel in that they provide the first evidence for patterns of hyper- and hypo-connectivity in terms of electrophysiological ICNs with functional specificity. Moreover, our results indicate hyper-connectivity within functionally specific ICNs and hypo-connectivity among ICNs across different functional domains, which suggests that patterns of functional connectivity disturbances vary across distinct brain networks and in the hierarchical structure of the whole brain network (Rane et al., 2015; Vissers et al., 2012; Wass, 2011). Meanwhile, the findings also indicate that functional connectivity at the frontal lobe and the DMN (spatially), and at low frequency bands (spectrally), is more severely impaired in individuals with ASD. Lastly, as compared with typical developing individuals, individuals with ASD show different age-related effects on functional connectivity related to frontal, temporal and motor brain regions suggesting that ASD is characterized by abnormal developmental trajectory in several function-specific ICNs.
Investigation of brain networks at the level of ICNs and connectivity among them in ASD holds promise in bridging the gap of spatial scales between previous studies focusing on particular networks of interests and others focused only on the whole brain network. It addresses the functional domain specificity issue of global hypo-/hyper-connectivity phenomenon at the resolution of function-specific brain networks. Since resting-state fMRI is able to reveal multiple ICNs of functional specificity (e.g., visual, motor, auditory, DMN, SN, and ECN) consistently in healthy populations (Damoiseaux et al., 2006; van den Heuvel and Pol, 2010), fMRI ICNs have been investigated in ASD as well (Rane et al., 2015; Vissers et al., 2012). Results there, in general, suggest a pattern of local hyper-connectivity and long-range hypo-connectivity, as suggested by other fMRI analyses of brain networks defined anatomically (Assaf et al., 2010; Di Martino et al., 2014; Uddin et al., 2013a; Washington et al., 2014). However, inconsistent patterns, such as hyper-connectivity over large spatial distance (Lynch et al., 2013; Monk et al., 2009) and local hypo-connectivity (Keown et al., 2013; Kitzbichler et al., 2015; Ye et al., 2014), were also reported. While two recent rs-fMRI studies of ASD suggest the possible network-based categorization of hypo-/hyper-connectivity (Bos et al., 2014; Nomi and Uddin, 2015), hyper-connectivity between ICNs has also been indicated (Abbott et al., 2015). These inconsistences might be attributed to the fact that BOLD signal in fMRI is an indirect measurement of neural activations, secondary to electrical signals (Logothetis, 2008). It has been demonstrated that incoherent brain electrical signals become highly coherent after convolving with slow hemodynamic response functions (Yuan et al., 2012).
As frequency-specific network changes have been evidenced in EEG/MEG whole brain studies (Lajiness-O’ Neill et al., 2014; Wang et al., 2013), direct characterization of spatial patterns of ICNs from EEG/MEG data is thus better able to probe atypical functional connectivity in ASD with both precise spatial (i.e., electrophysiological ICNs) and spectral resolutions (i.e., cortical oscillations). Our results are consistent with a mixed profile of between network hypoconnectivity and local hyper-connectivity in ASD (Bos et al., 2014; Nomi and Uddin, 2015), but also suggest that these patterns vary across distinct functional networks and in the hierarchical structure of the whole brain network. Network-based results suggest cross-hemisphere (e.g., FL and FR ICNs in Fig. 2) and fronto-parietal hyper-connectivity (e.g., FM and PB ICNs), and hypoconnectivity between several networks that are anatomically proximal but largely distinct in terms of the functional domains that they support (e.g., FR-MR and PB-OL ICN pairs in Fig. 5). Therefore, our results suggest that patterns of hypo- and hyper- connectivity in ASD varies across networks, partially explaining inconsistencies across prior studies, and that these differences across networks are driven more by functional properties rather than anatomical connections or distance. In terms of region specificity, similar to rs-fMRI studies, our results indicate that the altered ICNs related to the frontal lobe (i.e., FL, FM, and FR ICNs) (Bos et al., 2014; Kitzbichler et al., 2015; Murias et al., 2007; Scott-Van Zeeland et al., 2010) and the DMN (i.e., FM, TL, TR, and PB ICNs) (Assaf et al., 2010; Monk et al., 2009; Nomi and Uddin, 2015; Rane et al., 2015; von dem Hagen et al., 2013; Washington et al., 2014) are most compromised in ASD. The finding of frontal dysfunction is supported by evidence of anomalies in neuronal integrity (Murphy et al., 2002), malformation of minicolumn microcircuitry (Courchesne and Pierce, 2005), and frontal lobe enlargement (Carper and Courchesne, 2005) in ASD, while dysregulated DMN might indicate abnormalities in self-referential mental representation and other high-order social cognitive processes in ASD (Broyd et al., 2009).
Our results further suggest that dominant band-specific functional connectivity abnormalities in ASD are in low-frequency bands (i.e., the delta and theta bands) for both within- and between-ICN connectivity (Figs. 3–5). Low-frequency oscillations are thought to mediate long-range cortico-cortical connections (Siegel et al., 2012; Uhlhaas et al., 2010) and lack of such capabilities may prevent the integration of different sources of information necessary for coherent behavioral and cognitive states in ASD (Geschwind and Levitt, 2007). It is in agreement with spatial data of hypo-connectivity phenomena in between-ICN connectivity (Figs. 4–5) and previous resting-state EEG/MEG studies (Barttfeld et al., 2011; Coben et al., 2008; Cornew et al., 2012; Ghanbari et al., 2015; Murias et al., 2007), as well as the major finding in fMRI studies that ASD is mainly characterized by reduced long-range connectivity (Muller et al., 2011; Rane et al., 2015). Meanwhile, abnormal high power of low-frequency oscillations (Murias et al., 2007), observed in the theta band of TL and FL ICNs (Fig. 3), might also reflect increases in short-range association fibers (Herbert et al., 2004), which could bias cortical connections toward local rather than global information processing in these regions (Courchesne and Pierce, 2005). Increased power in both delta and theta bands in individual ICNs aligns well with the U-shaped profile of EEG power in ASD (Wang et al., 2013). The role of elevated delta oscillation in ASD might reflect neurological dysfunction with imbalanced homeostatic processes in these ICNs due to its close association with autonomic and metabolic processes (Knyazev, 2012). The pattern of betaband fronto-temporal hypo-connectivity may indicate impaired top-down feedback processing in ASD (Miller and Buschman, 2013), given that neurobehavioral studies have identified failures in top-down cognitive control in ASD (Mosconi et al., 2009). Altogether, the present study revealed the vulnerability of low frequency oscillations in individuals with ASD.
Several studies have examined age-related functional connectivity changes in ASD but with complex findings (Abbott et al., 2015; Kitzbichler et al., 2015; Nomi and Uddin, 2015; Uddin et al., 2013b). In the present study, we found two atypical age-related effects in the ASD group (Table 2). Firstly, for within-ICN connectivity, the decreased power with increased age in healthy controls are consistent with the development-related reductions in delta/theta powers (Clarke et al., 2001; Knyazev, 2012). The absence of significant correlations in ML, MR and TR ICNs in ASD indicate delayed network segregation in these circuits (Kitzbichler et al., 2015). Secondly, between-ICN connectivity increase with age is observed between TL and FR ICNs in ASD, but not in healthy controls. Since they are likely related to the DMN and the frontal lobe, this phenomenon may suggest delayed maturation of these areas in ASD, by extending into adolescence and adulthood (Luna et al., 2004), which affect the network integration among them and the development of complex executive and social-communication processes (Rudie et al., 2012). The whole pattern of age effect indicates a highly heterogeneous profile of functional connectivity development abnormalities in ASD across the lifespan, which are consistent with existing evidences that fewer group differences have been observed in adults than children or adolescents (Nomi and Uddin, 2015). Furthermore, hyper-connectivity within individual functional domains might well account for the normal intelligence scores in the present cohort of ASD participants via a form of functional compensation. Hypo-connectivity across functional domains could account for some impairments in communication and higher cognitive skills in ASD, since these capacities involve functional integration across distal and segregated networks.
Several limitations of the present study must be noted as precautions in the interpretation of our data. Firstly, neural substrates behind ICNs and their relationship to fMRI ICNs were not quantitatively examined. To unveil them, simultaneous EEG-fMRI (Yuan et al., 2016; Yuan et al., 2012) and cortical source imaging techniques (Kitzbichler et al., 2015; Ye et al., 2014) can be used to precisely localize electrophysiological signatures of abnormal ICNs. Secondly, the group sizes were not large, while similar to several recent resting-state EEG/MEG studies of ASD (Kitzbichler et al., 2015; Murias et al., 2007; Ye et al., 2014). Nevertheless, most of the findings are in agreement with prior studies with larger group sizes (Nomi and Uddin, 2015; Washington et al., 2014). Thirdly, the present study examines subjects from a broad age range, covering childhood, adolescence and adulthood. ASD is a neurodevelopmental disorder and different functional connectivity abnormalities in the disorder have been indicated in different age cohorts (Nomi and Uddin, 2015). Therefore, the present study could not answer the question of how these functional connectivity abnormalities emerge over the course of development, which would be an interesting topic for future research. Nonetheless, although our study is not a longitudinal one to track brain maturation, our findings of age effects on functional connectivity abnormalities are generally consistent with atypical brain maturation in ASD (Abbott et al., 2015; Kitzbichler et al., 2015; Nomi and Uddin, 2015; Uddin et al., 2013b).
While these limitations, the reported technology here opens the opportunity to investigate more related problems based on the capacity of assessing ICNs and the whole brain network based on ICNs. With better control on clinical parameters, such as age, the same technology will be used to validate the present findings and evaluate ICN changes in the context of diagnosis, early detection of illness, prediction of treatment responses, and evolution of abnormalities over the cause of brain development in ASD. Meanwhile, the technology will be further advanced via integrating cortical source imaging techniques (Ding, 2009; Liao et al., 2012; Zhu et al., 2014; Yuan et al., 2016), to elucidate electrophysiological signatures of atypical ICNs in ASD with more spatial specificity.
Acknowledgments
We gratefully acknowledge the financial support from NSF CAREER ECCS-0955260 (LD), NSF RII Track-2 FEC 1539068 (LD), U54HD082008 (JS, MM, JW, LE), National Institute of Mental Health Grant 092696 (MM). JS previously consulted to Takeda, Roche and Lilly unrelated to this project. The authors report no other potential conflicts of interest.
Appendix
Coherence was calculated on spectral dynamics between two ICs. For IC pair (u, v), the cross-spectrum Guv(fn) at frequency fn across all K epochs is calculated from the complex-valued Fourier coefficients Fuk(fn) and Fvk(fn) as
where * is the conjugate transpose. Then coherence C2uv(fn) at frequency fn is the normalized cross-spectrum calculated as
Footnotes
The tfICA with real-valued mixing matrix model was performed on a code download from https://www.cs.helsinki.fi/group/neuroinf/code/fourierica/html/fourierica.html
References
- Abbott AE, Nair A, Keown CL, Datko M, Jahedi A, Fishman I, Muller RA. Patterns of Atypical Functional Connectivity and Behavioral Links in Autism Differ Between Default, Salience, and Executive Networks. Cerebral Cortex. 2015:1–12. doi: 10.1093/cercor/bhv191. [DOI] [PMC free article] [PubMed] [Google Scholar]
- American Psychiatric Association. Diagnostic and statistical manual of mental disorders. (5th) 2013 [Google Scholar]
- Anderson JS, Nielsen JA, Froehlich AL, DuBray MB, Druzgal TJ, Cariello AN, Cooperrider JR, Zielinski BA, Ravichandran C, Fletcher PT, Alexander AL, Bigler ED, Lange N, Lainhart JE. Functional connectivity magnetic resonance imaging classification of autism. Brain. 2011;134:3739–3751. doi: 10.1093/brain/awr263. [DOI] [PMC free article] [PubMed] [Google Scholar]
- Assaf M, Jagannathan K, Calhoun VD, Miller L, Stevens MC, Sahl R, O’Boyle JG, Schultz RT, Pearlson GD. Abnormal functional connectivity of default mode subnetworks in autism spectrum disorder patients. Neuroimage. 2010;53(1):247–256. doi: 10.1016/j.neuroimage.2010.05.067. [DOI] [PMC free article] [PubMed] [Google Scholar]
- Barttfeld P, Wicker B, Cukier S, Navarta S, Lew S, Sigman M. A big-world network in ASD: Dynamical connectivity analysis reflects a deficit in long-range connections and an excess of short-range connections. Neuropsychologia. 2011;49(2):254–263. doi: 10.1016/j.neuropsychologia.2010.11.024. [DOI] [PubMed] [Google Scholar]
- Betancur C. Etiological heterogeneity in autism spectrum disorders: More than 100 genetic and genomic disorders and still counting. Brain Research. 2011;1380:42–77. doi: 10.1016/j.brainres.2010.11.078. [DOI] [PubMed] [Google Scholar]
- Bingham E, Hyvarinen A. A fast fixed-point algorithm for independent component analysis of complex valued signals. Int J Neural Syst. 2000;10(1):1–8. doi: 10.1142/S0129065700000028. [DOI] [PubMed] [Google Scholar]
- Bos DJ, van Raalten TR, Oranje B, Smits AR, Kobussen NA, Belle J, Rombouts SA, Durston S. Developmental differences in higher-order resting-state networks in Autism Spectrum Disorder. Neuroimage Clin. 2014;4:820–827. doi: 10.1016/j.nicl.2014.05.007. [DOI] [PMC free article] [PubMed] [Google Scholar]
- Boutros NN, Lajiness-O’ Neill R, Zillgitt A, Richard AE, Bowyer SM. EEG changes associated with autistic spectrum disorders. Neuropsychiatric Electrophysiology. 2015;1:3. [Google Scholar]
- Broyd SJ, Demanuele C, Debener S, Helps SK, James CJ, Sonuga-Barke EJS. Default-mode brain dysfunction in mental disorders: A systematic review. Neuroscience and Biobehavioral Reviews. 2009;33(3):279–296. doi: 10.1016/j.neubiorev.2008.09.002. [DOI] [PubMed] [Google Scholar]
- Carper RA, Courchesne E. Localized enlargement of the frontal cortex in early autism. Biological Psychiatry. 2005;57(2):126–133. doi: 10.1016/j.biopsych.2004.11.005. [DOI] [PubMed] [Google Scholar]
- Chen CP, Keown CL, Jahedi A, Nair A, Pflieger ME, Bailey BA, Muller RA. Diagnostic classification of intrinsic functional connectivity highlights somatosensory, default mode, and visual regions in autism. Neuroimage Clin. 2015;8:238–245. doi: 10.1016/j.nicl.2015.04.002. [DOI] [PMC free article] [PubMed] [Google Scholar]
- Chen JL, Ros T, Gruzelier JH. Dynamic changes of ICA-derived EEG functional connectivity in the resting state. Human Brain Mapping. 2013;34(4):852–868. doi: 10.1002/hbm.21475. [DOI] [PMC free article] [PubMed] [Google Scholar]
- Clarke AR, Barry RJ, McCarthy R, Selikowitz M. Age and sex effects in the EEG: development of the normal child. Clinical Neurophysiology. 2001;112(5):806–814. doi: 10.1016/s1388-2457(01)00488-6. [DOI] [PubMed] [Google Scholar]
- Coben R, Clarke AR, Hudspeth W, Barry RJ. EEG power and coherence in autistic spectrum disorder. Clinical Neurophysiology. 2008;119(5):1002–1009. doi: 10.1016/j.clinph.2008.01.013. [DOI] [PubMed] [Google Scholar]
- Coben R, Mohammad-Rezazadeh I, Cannon RL. Using quantitative and analytic EEG methods in the understanding of connectivity in autism spectrum disorders: a theory of mixed over- and under-connectivity. Frontiers in Human Neuroscience. 2014;8 doi: 10.3389/fnhum.2014.00045. [DOI] [PMC free article] [PubMed] [Google Scholar]
- Cornew L, Roberts TPL, Blaskey L, Edgar JC. Resting-State Oscillatory Activity in Autism Spectrum Disorders. Journal of Autism and Developmental Disorders. 2012;42(9):1884–1894. doi: 10.1007/s10803-011-1431-6. [DOI] [PMC free article] [PubMed] [Google Scholar]
- Courchesne E, Pierce K. Why the frontal cortex in autism might be talking only to itself: local over-connectivity but long-distance disconnection. Current Opinion in Neurobiology. 2005;15(2):225–230. doi: 10.1016/j.conb.2005.03.001. [DOI] [PubMed] [Google Scholar]
- Damoiseaux JS, Rombouts SARB, Barkhof F, Scheltens P, Stam CJ, Smith SM, Beckmann CF. Consistent resting-state networks across healthy subjects. Proceedings of the National Academy of Sciences of the United States of America. 2006;103(37):13848–13853. doi: 10.1073/pnas.0601417103. [DOI] [PMC free article] [PubMed] [Google Scholar]
- Di Martino A, Yan CG, Li Q, Denio E, Castellanos FX, Alaerts K, Anderson JS, Assaf M, Bookheimer SY, Dapretto M, Deen B, Delmonte S, Dinstein I, Ertl-Wagner B, Fair DA, Gallagher L, Kennedy DP, Keown CL, Keysers C, Lainhart JE, Lord C, Luna B, Menon V, Minshew NJ, Monk CS, Mueller S, Muller RA, Nebel MB, Nigg JT, O’Hearn K, Pelphrey KA, Peltier SJ, Rudie JD, Sunaert S, Thioux M, Tyszka JM, Uddin LQ, Verhoeven JS, Wenderoth N, Wiggins JL, Mostofsky SH, Milham MP. The autism brain imaging data exchange: towards a large-scale evaluation of the intrinsic brain architecture in autism. Molecular Psychiatry. 2014;19(6):659–667. doi: 10.1038/mp.2013.78. [DOI] [PMC free article] [PubMed] [Google Scholar]
- Di Martino A, Zuo XN, Kelly C, Grzadzinski R, Mennes M, Schvarcz A, Rodman J, Lord C, Castellanos FX, Milham MP. Shared and Distinct Intrinsic Functional Network Centrality in Autism and Attention-Deficit/Hyperactivity Disorder. Biological Psychiatry. 2013;74(8):623–632. doi: 10.1016/j.biopsych.2013.02.011. [DOI] [PMC free article] [PubMed] [Google Scholar]
- Ding L, Shou GF, Yuan H, Urbano D, Cha YH. Lasting Modulation Effects of rTMS on Neural Activity and Connectivity as Revealed by Resting-State EEG. IEEE Transactions on Biomedical Engineering. 2014;61(7):2070–2080. doi: 10.1109/TBME.2014.2313575. [DOI] [PMC free article] [PubMed] [Google Scholar]
- Ding L. Reconstructing Cortical Current Density by Exploring Sparseness in the Transform Domain. Physics in Medicine and Biology. 2009;54:2683–2697. doi: 10.1088/0031-9155/54/9/006. [DOI] [PubMed] [Google Scholar]
- Elliott CD. Differential Ability Scales-II (DAS-II) Harcourt Assessment Inc.; San Antonio, TX: 2007. [Google Scholar]
- Fox MD, Raichle ME. Spontaneous fluctuations in brain activity observed with functional magnetic resonance imaging. Nature Reviews Neuroscience. 2007;8(9):700–711. doi: 10.1038/nrn2201. [DOI] [PubMed] [Google Scholar]
- Geschwind DH, Levitt P. Autism spectrum disorders: developmental disconnection syndromes. Current Opinion in Neurobiology. 2007;17(1):103–111. doi: 10.1016/j.conb.2007.01.009. [DOI] [PubMed] [Google Scholar]
- Ghanbari Y, Bloy L, Edgar JC, Blaskey L, Verma R, Roberts TPL. Joint Analysis of Band-Specific Functional Connectivity and Signal Complexity in Autism. Journal of Autism and Developmental Disorders. 2015;45(2):444–460. doi: 10.1007/s10803-013-1915-7. [DOI] [PMC free article] [PubMed] [Google Scholar]
- Herbert MR, Ziegler DA, Makris N, Filipek PA, Kemper TL, Normandin JJ, Sanders HA, Kennedy DN, Caviness VS. Localization of white matter volume increase in autism and developmental language disorder. Annals of Neurology. 2004;55(4):530–540. doi: 10.1002/ana.20032. [DOI] [PubMed] [Google Scholar]
- Jung TP, Makeig S, Humphries C, Lee TW, McKeown MJ, Iragui V, Sejnowski TJ. Removing electroencephalographic artifacts by blind source separation. Psychophysiology. 2000;37(2):163–178. [PubMed] [Google Scholar]
- Keown CL, Shih P, Nair A, Peterson N, Mulvey ME, Muller RA. Local Functional Overconnectivity in Posterior Brain Regions Is Associated with Symptom Severity in Autism Spectrum Disorders. Cell Reports. 2013;5(3):567–572. doi: 10.1016/j.celrep.2013.10.003. [DOI] [PMC free article] [PubMed] [Google Scholar]
- Kitzbichler MG, Khan S, Ganesan S, Vangel MG, Herbert MR, Hamalainen MS, Kenet T. Altered Development and Multifaceted Band-Specific Abnormalities of Resting State Networks in Autism. Biological Psychiatry. 2015;77(9):794–804. doi: 10.1016/j.biopsych.2014.05.012. [DOI] [PMC free article] [PubMed] [Google Scholar]
- Klimesch W. EEG alpha and theta oscillations reflect cognitive and memory performance: a review and analysis. Brain Research Reviews. 1999;29(2–3):169–195. doi: 10.1016/s0165-0173(98)00056-3. [DOI] [PubMed] [Google Scholar]
- Knyazev GG. EEG delta oscillations as a correlate of basic homeostatic and motivational processes. Neuroscience and Biobehavioral Reviews. 2012;36(1):677–695. doi: 10.1016/j.neubiorev.2011.10.002. [DOI] [PubMed] [Google Scholar]
- Lajiness-O’ Neill R, Bowyer SM, Moran JE, Zillgitt A, Richard AE, Boutros NN. Neurophysiological findings from magnetoencephalography in autism spectrum disorder: a comprehensive review. Future Neurology. 2014;9(3):355–384. [Google Scholar]
- Lee TW, Girolami M, Sejnowski TJ. Independent component analysis using an extended infomax algorithm for mixed subgaussian and supergaussian sources. Neural Computation. 1999;11(2):417–441. doi: 10.1162/089976699300016719. [DOI] [PubMed] [Google Scholar]
- Liao K, Zhu M, Ding L, Valette S, Zhang WB, Dickens D. Sparse Imaging of cortical electrical current densities via wavelet transforms. Physics in Medicine and Biology. 2012;57:6881–6901. doi: 10.1088/0031-9155/57/21/6881. [DOI] [PubMed] [Google Scholar]
- Logothetis NK. What we can do and what we cannot do with fMRI. Nature. 2008;453(7197):869–878. doi: 10.1038/nature06976. [DOI] [PubMed] [Google Scholar]
- Lord C, Risi S, Lambrecht L, Cook EH, Jr, Leventhal BL, DiLavore PC, Pickles A, Rutter M. The autism diagnostic observation schedule-generic: a standard measure of social and communication deficits associated with the spectrum of autism. J Autism Dev Disord. 2000;30(3):205–223. [PubMed] [Google Scholar]
- Lord C, Rutter M, Le Couteur A. Autism Diagnostic Interview-Revised: a revised version of a diagnostic interview for caregivers of individuals with possible pervasive developmental disorders. J Autism Dev Disord. 1994;24(5):659–685. doi: 10.1007/BF02172145. [DOI] [PubMed] [Google Scholar]
- Luna B, Garver KE, Urban TA, Lazar NA, Sweeney JA. Maturation of cognitive processes from late childhood to adulthood. Child Development. 2004;75(5):1357–1372. doi: 10.1111/j.1467-8624.2004.00745.x. [DOI] [PubMed] [Google Scholar]
- Lynch CJ, Uddin LQ, Supekar K, Khouzam A, Phillips J, Menon V. Default Mode Network in Childhood Autism: Posteromedial Cortex Heterogeneity and Relationship with Social Deficits. Biological Psychiatry. 2013;74(3):212–219. doi: 10.1016/j.biopsych.2012.12.013. [DOI] [PMC free article] [PubMed] [Google Scholar]
- Miller EK, Buschman TJ. Cortical circuits for the control of attention. Current Opinion in Neurobiology. 2013;23(2):216–222. doi: 10.1016/j.conb.2012.11.011. [DOI] [PMC free article] [PubMed] [Google Scholar]
- Monk CS, Peltier SJ, Wiggins JL, Weng SJ, Carrasco M, Risi S, Lord C. Abnormalities of intrinsic functional connectivity in autism spectrum disorders. Neuroimage. 2009;47(2):764–772. doi: 10.1016/j.neuroimage.2009.04.069. [DOI] [PMC free article] [PubMed] [Google Scholar]
- Mosconi MW, Kay M, D’Cruz AM, Seidenfeld A, Guter S, Stanford LD, Sweeney JA. Impaired inhibitory control is associated with higher-order repetitive behaviors in autism spectrum disorders. Psychological Medicine. 2009;39(9):1559–1566. doi: 10.1017/S0033291708004984. [DOI] [PMC free article] [PubMed] [Google Scholar]
- Muller RA, Shih P, Keehn B, Deyoe JR, Leyden KM, Shukla DK. Underconnected, but How? A Survey of Functional Connectivity MRI Studies in Autism Spectrum Disorders. Cerebral Cortex. 2011;21(10):2233–2243. doi: 10.1093/cercor/bhq296. [DOI] [PMC free article] [PubMed] [Google Scholar]
- Murias M, Webb SJ, Greenson J, Dawson G. Resting state cortical connectivity reflected in EEG coherence in individuals with autism. Biological Psychiatry. 2007;62(3):270–273. doi: 10.1016/j.biopsych.2006.11.012. [DOI] [PMC free article] [PubMed] [Google Scholar]
- Murphy DG, Critchley HD, Schmitz N, McAlonan G, Van Amelsvoort T, Robertson D, Daly E, Rowe A, Russell A, Simmons A, Murphy KC, Howlin P. Asperger syndrome: a proton magnetic resonance spectroscopy study of brain. Arch Gen Psychiatry. 2002;59(10):885–891. doi: 10.1001/archpsyc.59.10.885. [DOI] [PubMed] [Google Scholar]
- Nair A, Keown CL, Datko M, Shih P, Keehn B, Muller RA. Impact of Methodological Variables on Functional Connectivity Findings in Autism Spectrum Disorders. Human Brain Mapping. 2014;35(8):4035–4048. doi: 10.1002/hbm.22456. [DOI] [PMC free article] [PubMed] [Google Scholar]
- Nolan H, Whelan R, Reilly RB. FASTER: Fully Automated Statistical Thresholding for EEG artifact Rejection. Journal of Neuroscience Methods. 2010;192(1):152–162. doi: 10.1016/j.jneumeth.2010.07.015. [DOI] [PubMed] [Google Scholar]
- Nomi JS, Uddin LQ. Developmental changes in large-scale network connectivity in autism. Neuroimage Clin. 2015;7:732–741. doi: 10.1016/j.nicl.2015.02.024. [DOI] [PMC free article] [PubMed] [Google Scholar]
- Nugent AC, Robinson SE, Coppola R, Furey ML, Zarate CA., Jr Group differences in MEG-ICA derived resting state networks: Application to major depressive disorder. Neuroimage. 2015;118:1–12. doi: 10.1016/j.neuroimage.2015.05.051. [DOI] [PMC free article] [PubMed] [Google Scholar]
- Onton J, Westerfield M, Townsend J, Makeig S. Imaging human EEG dynamics using independent component analysis. Neuroscience and Biobehavioral Reviews. 2006;30(6):808–822. doi: 10.1016/j.neubiorev.2006.06.007. [DOI] [PubMed] [Google Scholar]
- Ponomarev VA, Mueller A, Candrian G, Grin-Yatsenko VA, Kropotov JD. Group Independent Component Analysis (gICA) and Current Source Density (CSD) in the study of EEG in ADHD adults. Clin Neurophysiol. 2014;125(1):83–97. doi: 10.1016/j.clinph.2013.06.015. [DOI] [PubMed] [Google Scholar]
- Ramkumar P, Parkkonen L, Hyvarinen A. Group-level spatial independent component analysis of Fourier envelopes of resting-state MEG data. Neuroimage. 2014;86:480–491. doi: 10.1016/j.neuroimage.2013.10.032. [DOI] [PubMed] [Google Scholar]
- Rane P, Cochran D, Hodge SM, Haselgrove C, Kennedy DN, Frazier JA. Connectivity in Autism: A Review of MRI Connectivity Studies. Harvard Review of Psychiatry. 2015;23(4):223–244. doi: 10.1097/HRP.0000000000000072. [DOI] [PMC free article] [PubMed] [Google Scholar]
- Rudie JD, Dapretto M. Convergent Evidence of Brain Overconnectivity in Children with Autism? Cell Reports. 2013;5(3):565–566. doi: 10.1016/j.celrep.2013.10.043. [DOI] [PMC free article] [PubMed] [Google Scholar]
- Rudie JD, Shehzad Z, Hernandez LM, Colich NL, Bookheimer SY, Iacoboni M, Dapretto M. Reduced Functional Integration and Segregation of Distributed Neural Systems Underlying Social and Emotional Information Processing in Autism Spectrum Disorders. Cerebral Cortex. 2012;22(5):1025–1037. doi: 10.1093/cercor/bhr171. [DOI] [PMC free article] [PubMed] [Google Scholar]
- Rutter M, Bailey A, Lord C. Social Communication Questionnaire (SCQ) Western Psychological Services, Los Angeles, CA 2003 [Google Scholar]
- Scott-Van Zeeland AA, Abrahams BS, Alvarez-Retuerto AI, Sonnenblick LI, Rudie JD, Ghahremani D, Mumford JA, Poldrack RA, Dapretto M, Geschwind DH, Bookheimer SY. Altered Functional Connectivity in Frontal Lobe Circuits Is Associated with Variation in the Autism Risk Gene CNTNAP2. Science Translational Medicine. 2010;2(56) doi: 10.1126/scitranslmed.3001344. [DOI] [PMC free article] [PubMed] [Google Scholar]
- Shou G, Ding L. Detection of EEG Spatial-Spectral-Temporal Signatures of Errors: A Comparative Study of ICA-Based and Channel-Based Methods. Brain Topography. 2015;28(1):47–61. doi: 10.1007/s10548-014-0397-z. [DOI] [PubMed] [Google Scholar]
- Shou GF, Ding L, Dasari D. Probing neural activations from continuous EEG in a real-world task: Time-frequency independent component analysis. J Neurosci Methods. 2012;209(1):22–34. doi: 10.1016/j.jneumeth.2012.05.022. [DOI] [PubMed] [Google Scholar]
- Siegel M, Donner TH, Engel AK. Spectral fingerprints of large-scale neuronal interactions. Nature Reviews Neuroscience. 2012;13(2):121–134. doi: 10.1038/nrn3137. [DOI] [PubMed] [Google Scholar]
- Srinivasan R, Nunez PL, Silberstein RB. Spatial filtering and neocortical dynamics: estimates of EEG coherence. IEEE Trans Biomed Eng. 1998;45(7):814–826. doi: 10.1109/10.686789. [DOI] [PubMed] [Google Scholar]
- Supekar K, Uddin LQ, Khouzam A, Phillips J, Gaillard WD, Kenworthy LE, Yerys BE, Vaidya CJ, Menon V. Brain Hyperconnectivity in Children with Autism and its Links to Social Deficits. Cell Reports. 2013;5(3):738–747. doi: 10.1016/j.celrep.2013.10.001. [DOI] [PMC free article] [PubMed] [Google Scholar]
- Uddin LQ, Supekar K, Lynch CJ, Khouzam A, Phillips J, Feinstein C, Ryali S, Menon V. Salience Network-Based Classification and Prediction of Symptom Severity in Children With Autism. Jama Psychiatry. 2013a;70(8):869–879. doi: 10.1001/jamapsychiatry.2013.104. [DOI] [PMC free article] [PubMed] [Google Scholar]
- Uddin LQ, Supekar K, Menon V. Reconceptualizing functional brain connectivity in autism from a developmental perspective. Frontiers in Human Neuroscience. 2013b;7 doi: 10.3389/fnhum.2013.00458. [DOI] [PMC free article] [PubMed] [Google Scholar]
- Uhlhaas PJ, Roux F, Rodriguez E, Rotarska-Jagiela A, Singer W. Neural synchrony and the development of cortical networks. Trends in Cognitive Sciences. 2010;14(2):72–80. doi: 10.1016/j.tics.2009.12.002. [DOI] [PubMed] [Google Scholar]
- van den Heuvel MP, Pol HEH. Exploring the brain network: A review on resting-state fMRI functional connectivity. European Neuropsychopharmacology. 2010;20(8):519–534. doi: 10.1016/j.euroneuro.2010.03.008. [DOI] [PubMed] [Google Scholar]
- Vissers ME, Cohen MX, Geurts HM. Brain connectivity and high functioning autism: A promising path of research that needs refined models, methodological convergence, and stronger behavioral links. Neuroscience and Biobehavioral Reviews. 2012;36(1):604–625. doi: 10.1016/j.neubiorev.2011.09.003. [DOI] [PubMed] [Google Scholar]
- von dem Hagen EAH, Stoyanova RS, Baron-Cohen S, Calder AJ. Reduced functional connectivity within and between ‘social’ resting state networks in autism spectrum conditions. Social Cognitive and Affective Neuroscience. 2013;8(6):694–701. doi: 10.1093/scan/nss053. [DOI] [PMC free article] [PubMed] [Google Scholar]
- Wang J, Barstein J, Ethridge LE, Mosconi MW, Takarae Y, Sweeney JA. Resting state EEG abnormalities in autism spectrum disorders. Journal of Neurodevelopmental Disorders. 2013;5 doi: 10.1186/1866-1955-5-24. [DOI] [PMC free article] [PubMed] [Google Scholar]
- Washington SD, Gordon EM, Brar J, Warburton S, Sawyer AT, Wolfe A, Mease-Ference ER, Girton L, Hailu A, Mbwana J, Gaillard WD, Kalbfleisch ML, VanMeter JW. Dysmaturation of the Default Mode Network in Autism. Human Brain Mapping. 2014;35(4):1284–1296. doi: 10.1002/hbm.22252. [DOI] [PMC free article] [PubMed] [Google Scholar]
- Wass S. Distortions and disconnections: Disrupted brain connectivity in autism. Brain and Cognition. 2011;75(1):18–28. doi: 10.1016/j.bandc.2010.10.005. [DOI] [PubMed] [Google Scholar]
- Wechsler D. Wechsler Abbreviated Scale of Intelligence- Second Edition (WASI-II) Pearson Education Inc.; San Antonio, TX: 2011. [Google Scholar]
- Ye AX, Leung RC, Schafer CB, Taylor MJ, Doesburg SM. Atypical Resting Synchrony in Autism Spectrum Disorder. Human Brain Mapping. 2014;35(12):6049–6066. doi: 10.1002/hbm.22604. [DOI] [PMC free article] [PubMed] [Google Scholar]
- Yuan H, Ding L, Zhu M, Zotev V, Phillips R, Bodurka J. Reconstructing Large-Scale Brain Resting-State Networks from High-Resolution EEG: Spatial and Temporal Comparisons with fMRI. Brain Connect. 2016;6(2):122–135. doi: 10.1089/brain.2014.0336. [DOI] [PubMed] [Google Scholar]
- Yuan H, Zotev V, Phillips R, Drevets WC, Bodurka J. Spatiotemporal dynamics of the brain at rest - Exploring EEG microstates as electrophysiological signatures of BOLD resting state networks. Neuroimage. 2012;60(4):2062–2072. doi: 10.1016/j.neuroimage.2012.02.031. [DOI] [PubMed] [Google Scholar]
- Zhu M, Zhang WB, Dickens D, Ding L. Reconstructing Spatially Extended Brain Sources via Enforcing Multiple Transform Sparseness. NeuroImage. 2014;86:280–293. doi: 10.1016/j.neuroimage.2013.09.070. [DOI] [PubMed] [Google Scholar]