

Abstract
The uncoupling protein (UCP) belongs to a family of energy-dissipating proteins in mitochondria. Increasing evidences have indicated that UCPs have immense impact on glucose homeostasis and are key proteins in metabolic syndrome. For applying the findings to clinical practice, we designed a study to explore the association between serum UCPs 1–3 and insulin resistance. This investigation prospectively recorded demographical parameter and collected blood samples of 1071 participants from 4 districts in Northeastern Taiwan during the period from August 2013 to July 2014. Propensity score matching by age and sex in patients with top and bottom third homeostasis model assessment of insulin resistance (HOMA-IR) levels was performed, and 326 subjects were enrolled for further studies. The mean age of the patients was 59.4 years and the majority of them (65.5%) were females. The prevalence of metabolic syndrome was 35.5%. Our results demonstrated that serum UCPs 1–3 were significantly associated with differences in HOMA-IR levels. Multiple logistic regression analysis indicated that low UCP 1 and features of metabolic syndrome, namely hypertension, diabetes, body mass index, and high-density lipoprotein, were independent determinants for high HOMA-IR levels. We thus determined that low serum UCP 1 is a predictor for high resistance to insulin.
Keywords: insulin resistance, metabolic syndrome, uncoupling protein
1. Introduction
The uncoupling proteins (UCPs) are mitochondrial inner membrane proteins that, by virtue of causing proton leakage, uncouple adenosine triphosphate (ATP) production from mitochondrial respiration.[1,2] UCPs, owing to their tendency to regulate energy expenditure, have been identified as key proteins in metabolic syndrome. Moreover, these proteins have been mapped to the human chromosome 11q13 and mouse chromosome 7, in which regions linked to obesity and hyperinsulinemia.[3] Five different uncoupling proteins, namely UCPs 1–5, with different roles and tissue distribution, have been identified thus far.[4–6] Considering evolutionarily important processes such as foraging and energy conservation, it is least likely for an organism to possess dedicated mechanisms to enhance energy wastage.[7,8] The present study focuses on the current knowledge about the role of these proteins in energy metabolism, with special emphasis on UCPs 1–3.
The original UCP, UCP 1, is primarily expressed in brown adipose tissues. Besides, UCP 1 mRNA and/or protein expression have also been reported in white adipose tissues, mammalian pancreatic islets, human skeletal muscle, and rat and mouse thymocytes.[9] UCP1 has several functions, such as thermogenesis, regulation of energy expenditure, and reduction of oxidative stress, which are related to the pathogenesis of metabolic syndrome.[10–12] Notably, some studies have demonstrated a synergistic relationship between UCP 1 polymorphisms and factors involved in regulation of body weight, including increased weight gain tendency, lowering of resting metabolic rate (RMR), and resistance to weight loss.[13]
UCP 2 is expressed in a number of tissues, including adipose tissues, the immune system, and pancreatic islets.[14,15] Several studies indicated an important role of UCP 2 in insulin/glucose homeostasis, and also demonstrated the regulation of insulin secretion by UCP 2, which possibly correlates with obesity, β-cell dysfunction, and type 2 diabetes.[16,17] UCP 3 expression is tissue-specific and is mostly confined to skeletal muscles, cardiac muscles, and fat tissues. UCP 3 expression leads to improved fatty-acid oxidation and mitochondrial Ca2+ uptake.[18,19]
To date, increasing evidence suggests that UCPs have an immense impact on glucose homeostasis.[12] However, tissue levels of UCPs are difficult to be detected in the current clinical setting. The purpose of this investigation was to determine the association between the serum levels of the 3 uncoupling proteins, UCPs 1–3, and insulin resistance in a longitudinal, community-based cohort study.
2. Materials and methods
2.1. Ethics statement
This study was conducted in compliance with the ethical principles mentioned in the Declaration of Helsinki and was consistent with Good Clinical Practice guidelines and local regulatory requirements. The subjects were invited to participate in this study on the day of their health screen. Trained physicians evaluated their mental status during the screening and informed them about the consent procedure. A written informed consent was obtained from all mentally competent subjects prior to their participation. This study was approved by the Institutional Review Board of the Chang-Gung Memorial Hospital (IRB No:100-2243A3).
2.2. Patient information and data collection
From August 2013 to January 2014, the longitudinal, community-based cohort study was conducted in 4 districts of Northeastern Taiwan, namely Wanli, Anle, Ruifang, and Gongliao. The community outreach health screen, including physical examination, blood and urine laboratory tests, along with a questionnaire survey, was performed to recruit the subjects. All the participants agreed to sign the informed consent forms. The cohort consisted of 1071 subjects, aged 30 years and older. The cases with systemic disorders, such as hypertension, hyperlipidemia, and chronic kidney disease were recorded. A standardized questionnaire was provided to all the participants by a trained team of interviewers, seeking information on their drinking, smoking, betel nut chewing habits, exercise regimes, medication history (oral hypoglycemic agents, insulin injections, statins, herbs and hormones), family history, and physical and mental health status (Short Form health survey, sleeping quality survey, depression survey and health knowledge). The participants were considered to have diabetes mellitus (DM) in the following 3 conditions: if they reported being told by a doctor that they have diabetes, upon consumption of oral hypoglycemic agents, and/or if their fasting plasma glucose levels were ≥126 mg/dL and hemoglobin A1c (HbA1c) levels were ≥6.5%.[20] The follow-up examinations were conducted after 1 year, and the physical parameters, blood and urine laboratory test results, along with the survey, were recorded again.
2.3. Metabolic syndrome
According to NCEP ATP III criteria, a race-specific waist circumference threshold was applied to prevent the discrepancy in metabolic syndrome prevalence. The cut-off values of normal waist circumference in men and women were 90 cm and 80 cm, respectively, for Asian people. As per ATP III criteria, metabolic syndrome is defined as the presence of at least 3 of the following 5 traits: abdominal obesity, defined as a waist circumference of ≥90 cm (35 in) and ≥80 cm (31.5 in) in men and women, respectively, serum triglyceride (TG) level ≥150 mg/dL (1.7 mmol/L) or drug treatment for elevated TG level, serum high-density lipoprotein (HDL) cholesterol level <40 mg/dL (1 mmol/L) in men and <50 mg/dL (1.3 mmol/L) in women or drug treatment for low HDL cholesterol level, blood pressure ≥130/85 mm Hg or drug treatment for elevated blood pressure, fasting plasma glucose (FPG) level ≥100 mg/dL (5.6 mmol/L) or drug treatment for elevated blood glucose.[21]
Serum insulin and fasting blood sugar levels were used for the analysis of IR (HOMA-IR) in the present study. The analysis of homeostasis model assessment of insulin resistance (HOMA-IR) was not suitable for patients with DM or those under medication for blood sugar control.[22] Although patients with drug treatment for elevated blood sugar were classified as having MS, as per the NICE ATPIII criteria, patients treated with oral hypoglycemic agents or insulin injections were excluded from our analysis.
2.4. HOMA-IR
The insulin resistance index HOMA-IR was calculated using the following formula: fasting plasma insulin (mU/L) × fasting plasma glucose (mg/dL) /405.[23,24]
An increased HOMA-IR score denotes decreased insulin sensitivity.[25] Since there is no standard range of HOMA-IR, the high HOMA-IR score was defined as the levels higher than the mean value of HOMA-IR score of all participants in this study, whereas the low HOMA-IR score was defined as the HOMA-IR levels lower than the mean value.
2.5. Sample preparation
Blood samples were collected from the participants after overnight fasting and immediately delivered (within 4 hours postharvest) to the laboratory for biochemical analyses, complete blood count, and antibody titers. Another fraction of samples was transferred to a chilled tube and centrifuged at 3000×g for 10 minutes at 4°C, then obtain the serum. Lipemic or hemolyzed serum was discarded. Other serum was aliquoted and stored at –80°C until analysis.
2.6. Measurement of UCPs by ELISA
The concentrations of UCPs were measured by the enzyme-linked immunosorbent assay (MyBioSource, San Diego, CA), as per the manufacturer's instructions. Briefly, serum samples (40 μL) were added to UCP antibodies (10 μL) to make the sample mixture. The sample mixture and diluted standards were added to appropriate wells of the antibody pre-coated plates. Thereafter, streptavidin-horseradish peroxidase (HRP) was added to each well, and the plates were sealed with a membrane, followed by incubation at 37°C for 1 hour. After the washing steps, 50 μL chromogen solution A&B was added to each well and the plates were incubated at 37°C for 10 minutes in dark for color development. The chromogenic substrate reaction was stopped by the addition of the stop solution. This was followed by measurement of absorbance at 450 nm. The protein concentrations were calculated using a standard curve.
2.7. Statistical analysis
Values are expressed as means and standard deviations for continuous data. Categorical data are expressed as percentages. Continuous variables were tested for normal distribution by the Kolmogorov–Smirnov test. Student's t test was performed to compare the means of continuous variables and normally distributed data. In other cases, the Mann–Whitney U-test was performed. Categorical variables were tested by the chi-square test. All statistical analyses were 2-tailed and a value of P < .05 was considered statistically significant. Correlation between paired-group variables was assessed by linear regression and Pearson analyses. The risk factors were assessed by univariate analysis. The statistically significant (P < .05) variables identified by univariate analysis were included in the multivariate analysis. A multiple logistic regression analysis with forward elimination of data was performed to obtain variables independently correlating with high HOMA-IR levels. Discrimination was examined using the area under the receiver operating characteristic (AUROC) curve. An AUROC close to 0.5 indicates that the model performance approximates that of flipping a coin. However, the model nears 100% sensitivity and specificity despite any cut-off point as the area nears 1.0. AUROC analysis was also performed to calculate the sensitivity, specificity, and overall correctness of UCPs 1–3, adiponectin, leptin, and tumor necrosis factor-α (TNF-α). Finally, cut-off points were calculated by obtaining the best Youden index (sensitivity + specificity – 1). Data were analyzed with the Statistical Package for the Social Sciences software (SPSS, Inc., Chicago, IL) version 19.0 for Windows and R Statistical Software version 3.1.2 (R Foundation for Statistical Computing, Vienna, Austria).
3. Results
3.1. Patient characteristics
Among the 1071 subjects, whose mean age was 59.4 ± 12.6 years, 65.5% were female, 22.0% were smokers, 23.9% were alcohol consumers, and 35.5% were diagnosed with metabolic syndrome (Table 1). The participants were equally divided into 3 groups, according to their HOMA-IR levels at baseline. The cut-off value for the top one-third of the population was 2.1, whereas that for the bottom one-third was 1.1 (Fig. 1).
Table 1.
Baseline characteristics of total participants in the WARG cohort study.

Figure 1.
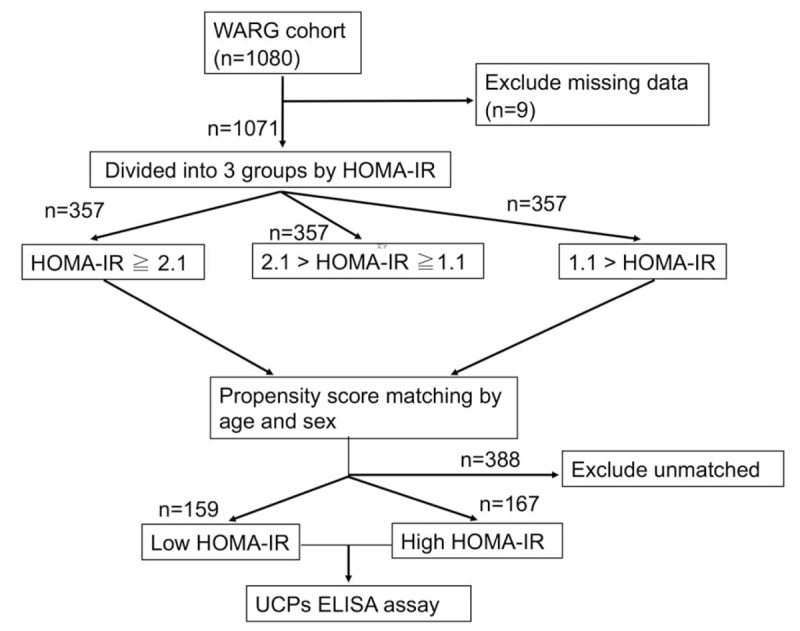
Flow chart of study enrollment. From August 2013 to January 2014, a total of 1071 subjects aged 30 years and older were enrolled in the WARG cohort study. The subjects were divided into 3 groups according to the HOMA-IR level. After matching by age and sex in patients with the top and bottom third HOMA-IR levels, 326 of the 1071 subjects were identified and further classified into 2 groups: low HOMA-IR (n = 159) and high HOMA-IR (n = 167), according to the deviation of their HOMA-IR levels from the mean value (2.1). The expressions of serum UCP 1–3 of the 326 participants were further determined by the enzyme-linked immunosorbent assay. HOMA-IR = homeostasis model assessment of insulin resistance, UCP = uncoupling protein, WARG = Wanli, Anle, Ruifang, and Gongliao.
3.2. Comparison of matched samples
After matching by age and sex in patients with the top and bottom third HOMA-IR, 326 of the 1071 subjects were identified and further classified into 2 groups: low HOMA-IR and high HOMA-IR, according to the deviation of their HOMA-IR levels from the mean value (2.1). The baseline characteristics of participants belonging to high- and low-HOMA-IR groups were compared (Table 2). Out of these 326 participants, 167 belonged to the low-HOMA-IR group, whereas 159 participants belonged to the high-HOMA-IR group (Fig. 1). The mean age of participants in the low- and high-HOMA-IR groups was 59.2 ± 10.4 years and 60.9 ± 11.0 years, respectively. A remarkable difference in the incidence of metabolic syndrome was observed in the low-HOMA-IR group, with only 8.8% participants being diagnosed with metabolic syndrome, as compared to that in the high-HOMA-IR group, about 61.1% participants were diagnosed with metabolic syndrome. No significant difference was observed in the prevalence of females among different HOMA-IR levels, with 81.6% females in the low- HOMA-IR group and 73.7% in the high-HOMA-IR group. The prevalence of smoking and drinking individuals was also similar in the 2 HOMA-IR groups. The average levels of mean arterial pressure (MAP), body mass index (BMI), fasting glucose, insulin, TG, and leptin were significantly higher in the high-HOMA-IR group, whereas the average levels of HDL, adiponectin, UCP 1, UCP 2, and UCP3 were significantly lower in this group. No significant differences, however, were observed in the average levels of total cholesterol, high-sensitivity C-reactive protein, estimated glomerular filtration rate, and TNF-α among the HOMA-IR groups.
Table 2.
Baseline characteristics of the matching participants in the WARG cohort study.

3.3. Risk factors for high insulin resistance
Univariate analysis showed that 12 out of 22 variables were good prognostic indicators (Tables 2 and 3). Upon multivariate analysis, it was identified that hypertension (Odds ratio [OR] = 3.586; confidence interval [CI] = 1.222–10.526), diabetes (OR = 6.630; CI = 1.408–31.213), BMI (OR = 1.419; CI = 1.187–1.695), HDL (OR = 0.949; CI = 0.914–0.986), and UCP 1 (OR = 0.984; CI = 0.972–0.996) have independent prognostic significance in risk assessment for high HOMA-IR levels. Similar results were also noted when 54 diabetic patients were excluded from this analysis (Table 3). Regression coefficients of these variables were used to calculate the odds of each patient by the following formula: logarithm of odds of death = –6.089 + 1.277 × hypertension + 1.892 × diabetes + 0.350 × BMI – 0.052 × HDL – 0.016 × UCP1.
Table 3.
Risk factors for development of high HOMA-IR.

3.4. Correlation between UCPs 1–3 and metabolic syndrome factors
The correlation between UCP 1 and the features associated with metabolic syndrome, including BMI, fasting sugar, MAP, HDL, low density lipoprotein (LDL), and TG in high/low HOMA-IR patients is shown in Fig. 2. Even though the differences were not statistically significant, the overall trend of correlation between UCP 1 and features of metabolic syndrome displayed variations between low- and high-HOMA-IR patients. The correlation analysis between the UCP 1, UCP 2, UCP 3, leptin, adiponectin, and TNF-α levels of these patients was also performed (Table 4). It was observed that the levels of UCPs 1–3 were strongly correlated (P < .01).
Figure 2.
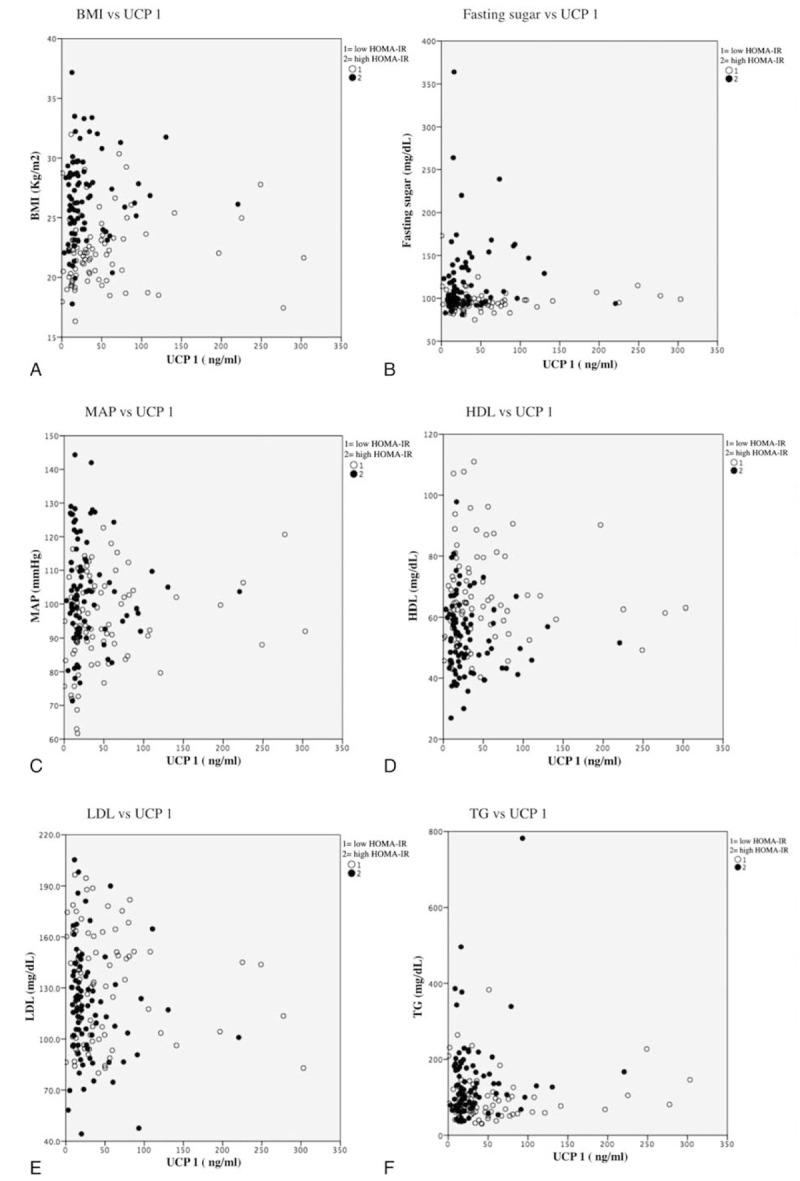
The correlation between serum UCP 1 and the features associated with metabolic syndromes. The overall trend of correlation between serum UCP 1 and features of metabolic syndrome, including (A) BMI, (B) fasting sugar, (C) MAP, (D) HDL, (E) LDL, and (F) TG displayed differences between low- and high-HOMA-IR patients. BMI = body mass index, HDL = high-density liproprotein, HOMA-IR = homeostasis model assessment of insulin resistance, LDL = low-density liproprotein, MAP = mean artery pressure, UCP = uncoupling protein.
Table 4.
Correlation between the factors (Spearman rank correlation coefficients: r).

3.5. Predictive accuracy of the variables for having high/low insulin resistance at 1 year later
The accuracies of UCPs 1–3, adiponectin, leptin, and TNF-α in predicting HOMA-IR levels are shown in Table 5. Based on AUROC curve analysis, it was found that UCP1 was the best marker for prediction of having low HOMA-IR levels at 1 year later, whereas leptin was the optimum marker for prediction of having high HOMA-IR levels at 1 year later. To assess the validity of these variables, the sensitivity, specificity, and overall correctness of prediction were tested, using cut-off points that provided the best Youden index (Table 6). UCP 1 had the best Youden index and the highest overall correctness of prediction for having HOMA-IR levels after a period of 1 year.
Table 5.
Discrimination for the factors in predicting the value of HOMA-IR at 1 year later.

Table 6.
Prediction performance for the value of HOMA-IR at 1 year later.

4. Discussion
The present study, by means of a community-based cohort study in Northeastern Taiwan, provides evidences that serum levels of UCPs 1–3 are associated with insulin sensitivity. Upon adjustment of age and sex, the decreased expression of UCPs 1–3 was observed with increase in HOMA-IR levels. This study also identified UCP1 as a negative independent predictor for high HOMA-IR levels. UCP 1 exhibited a better discriminatory ability than UCPs 2 and 3, adiponectin, and TNF-α, for prediction of HOMA-IR value after a period of 1 year. Moreover, UCP 1 had the best Youden index and overall correctness for prediction.
Several studies have demonstrated the role of UCP 1 in insulin resistance and metabolic syndrome. The expression of UCP 1 increased in thiazolidinedione-treated human preadipocytes, which was accompanied with adipogenesis of brown fat. Since brown adipocytes are involved in the enhancement of energy expenditure, it was implied that the expression of UCP 1 may be correlated with the beneficial effects of thiazolidinedione on insulin resistance.[26] An investigation also reported that aldosterone administration inhibited UCP 1 expression, thereby enhancing insulin resistance and the pro-inflammatory response.[27] In an animal study, the upregulation of UCP 1 was demonstrated to cause an increase in energy expenditure and also confer anti-obesity effects.[28] Results obtained in the present study were consistent with these findings and signified that serum UCP 1 could serve as a protective factor for insulin resistance. It was observed that serum UCP 1 and the features of metabolic syndrome, including hypertension, diabetes, BMI, and HDL, were independent predictors of insulin resistance.
The pathophysiological role of UCP 2 in metabolic syndrome is largely unknown.[29–31] Previous studies have reported that upregulation of UCP 2 influences the function of β-cells of pancreatic islets and leads to loss of glucose responsiveness.[32,33] Some other studies have reported that UCP 2 plays a regulatory role in the reduction of reactive oxygen species (ROS) production.[34] Decreased expression of UCP 2 was also associated with obesity, low adiponectin, and high HOMA-IR levels in animals and patients with type 2 diabetes.[35,36] Several studies performed on high-fat-diet-fed UCP 3−/− transgenic mice demonstrated variable, age-dependent effects on insulin sensitivity.[37,38] This effect was observed in mice fed with a standard, as well as high-fat diet.[38,39] The correlation between UCP 3 and insulin resistance in patients with type 2 diabetes was also been reported.[40] In the present study, it was observed that despite a significant correlation of serum UCP 1 levels with insulin resistance, both UCP 2 and UCP 3 levels were not correlated with HOMA-IR levels. The predictive abilities of UCP 2 and 3 for HOMA-IR after 1 year were also lower than that of UCP 1, adiponectin, or leptin.
In spite of the encouraging results observed in our study, several potential limitations in the study should also be considered. First, UCPs are mainly localized in the mitochondrial inner membrane. In this study, the expression of UCPs was measured in serum samples, and the advantages of this examination are easily performed and clinically applicable at a reasonable cost with short turnaround times. However, the correlation between serum and tissue levels of UCPs was not examined in this study. To our knowledge this is the first study to demonstrate the strong association between low serum levels of UCP 1 and increased risk of high insulin resistance. Our study results provide a plausible basis for the development of such a clinically useful biomarker to identify individuals at risk for the development of metabolic syndrome, as well as for an increased understanding of the pathogenesis of this clinical syndrome. Second, the goal of propensity scores is to balance observed covariates between subjects. Because the sample size was not large enough, the analysis was performed based on age- and sex-matched participants with the top and bottom third HOMA-IR. This way is insufficient to mimic randomized control trial and might affect the study results. Third, there is still the possibility of unmeasured confounding factors. Finally, this study also could not address the causal effects between UCPs and HOMA-IR.
5. Conclusion
To summarize, this study provided clinical evidence revealing the association of serum levels of uncoupling proteins with insulin sensitivity. The analytical data showed that UCP 1, but not UCP 2 or UCP 3, was a negative independent predictor for high insulin resistance. On the basis of the results obtained, it can be concluded that the subjects with low serum UCP 1 levels could be at increased risk of high insulin resistance.
Acknowledgments
The authors thank the staff of the Community Medicine Research Center of Keelung CGMH.
Footnotes
Abbreviations: ATP = adenosine triphosphate, ATP = adenosine triphosphate, AUROC = area under the receiver operating characteristic, BMI = body mass index, CI = confidence interval, DM = diabetes mellitus, FPG = fasting plasma glucose, HbA1C = hemoglobin A1c, HDL = high-density lipoprotein, HOMA-IR = homeostasis model assessment of insulin resistance, HRP = horseradish peroxidase, LDL = low-density lipoprotein, MAP = mean arterial pressure, OR = odds ratio, RMR = resting metabolic rate, TG = triglyceride, TNF-α = tumor necrosis factor-α, UCP = uncoupling protein.
This work was supported by the Chang Gung Memorial Hospital Research Program (CMRP2B0163 and CMRPG2B0143).
The authors have no conflicts of interest to disclose.
References
- [1].Ricquier D, Bouillaud F. The uncoupling protein homologues: UCP1, UCP2, UCP3, StUCP and AtUCP. Biochem J 2000;345(pt 2):161–79. [PMC free article] [PubMed] [Google Scholar]
- [2].Echtay KS, Brand MD. 4-hydroxy-2-nonenal and uncoupling proteins: an approach for regulation of mitochondrial ROS production. Redox Rep 2013;12:26–9. [DOI] [PubMed] [Google Scholar]
- [3].Mahadik SR, Lele RD, Saranath D, et al. Uncoupling protein-2 (UCP2) gene expression in subcutaneous and omental adipose tissue of Asian Indians: relationship to adiponectin and parameters of metabolic syndrome. Adipocyte 2012;1:101–7. [DOI] [PMC free article] [PubMed] [Google Scholar]
- [4].Boss O, Hagen T, Lowell BB. Uncoupling proteins 2 and 3: potential regulators of mitochondrial energy metabolism. Diabetes 2000;49:143–56. [DOI] [PubMed] [Google Scholar]
- [5].Erlanson-Albertsson C. The role of uncoupling proteins in the regulation of metabolism. Acta Physiol Scand 2003;178:405–12. [DOI] [PubMed] [Google Scholar]
- [6].Alán L, Smolková K, Kronusová E, et al. Absolute levels of transcripts for mitochondrial uncoupling proteins UCP2, UCP3, UCP4, and UCP5 show different patterns in rat and mice tissues. J Bioenerg Biomembr 2009;41:71–8. [DOI] [PubMed] [Google Scholar]
- [7].Bo H, Jiang N, Ma G, et al. Regulation of mitochondrial uncoupling respiration during exercise in rat heart: role of reactive oxygen species (ROS) and uncoupling protein 2. Free Radic Biol Med 2008;44:1373–81. [DOI] [PubMed] [Google Scholar]
- [8].Wu Z, Zhang J, Zhao B. Superoxide anion regulates the mitochondrial free Ca2+ through uncoupling proteins. Antioxid Redox Signal 2009;11:1805–18. [DOI] [PubMed] [Google Scholar]
- [9].Cao W, Medvedev AV, Daniel KW, et al. beta-Adrenergic activation of p38 MAP kinase in adipocytes cAMP induction of the uncoupling protein 1 (UCP1) gene requires p38 map kinase. J Biol Chem 2001;276:27077–82. [DOI] [PubMed] [Google Scholar]
- [10].Cao W, Daniel KW, Robidoux J, et al. p38 mitogen-activated protein kinase is the central regulator of cyclic AMP-dependent transcription of the brown fat uncoupling protein 1 gene. Mol Cell Biol 2004;24:3057–67. [DOI] [PMC free article] [PubMed] [Google Scholar]
- [11].Inokuma K, Okamatsu-Ogura Y, Omachi A, et al. Indispensable role of mitochondrial UCP1 for antiobesity effect of beta3-adrenergic stimulation. Am J Physioly Endocrinol Metab 2006;290:E1014–21. [DOI] [PubMed] [Google Scholar]
- [12].Sidossis L, Kajimura S. Brown and beige fat in humans: thermogenic adipocytes that control energy and glucose homeostasis. J Clin Invest 2015;125:478–86. [DOI] [PMC free article] [PubMed] [Google Scholar]
- [13].Cheng Y, Meng Q, Wang C, et al. Leucine deprivation decreases fat mass by stimulation of lipolysis in white adipose tissue and upregulation of uncoupling protein 1 (UCP1) in brown adipose tissue. Diabetes 2010;59:17–25. [DOI] [PMC free article] [PubMed] [Google Scholar]
- [14].Pecqueur C, Bui T, Gelly C, et al. Uncoupling protein-2 controls proliferation by promoting fatty acid oxidation and limiting glycolysis-derived pyruvate utilization. FASEB J 2008;22:9–18. [DOI] [PubMed] [Google Scholar]
- [15].El-Khoury TG, Bahr GM, Echtay KS. Muramyl-dipeptide-induced mitochondrial proton leak in macrophages is associated with upregulation of uncoupling protein 2 and the production of reactive oxygen and reactive nitrogen species. FEBS J 2011;278:3054–64. [DOI] [PubMed] [Google Scholar]
- [16].Krauss S, Zhang C-Y, Lowell BB. The mitochondrial uncoupling-protein homologues. Nat Rev Mol Cell Biol 2005;6:248–61. [DOI] [PubMed] [Google Scholar]
- [17].Pi J, Collins S. Reactive oxygen species and uncoupling protein 2 in pancreatic β-cell function. Diabetes Obes Metab 2010;12:141–8. [DOI] [PubMed] [Google Scholar]
- [18].Trenker M, Malli R, Fertschai I, et al. Uncoupling proteins 2 and 3 are fundamental for mitochondrial Ca2+ uniport. Nat Cell Biol 2007;9:445–52. [DOI] [PMC free article] [PubMed] [Google Scholar]
- [19].Waldeck-Weiermair M, Malli R, Naghdi S, et al. The contribution of UCP2 and UCP3 to mitochondrial Ca2+ uptake is differentially determined by the source of supplied Ca2+. Cell Calcium 2010;47:433–40. [DOI] [PubMed] [Google Scholar]
- [20].Lachin JM, Genuth S, Nathan DM, et al. Effect of glycemic exposure on the risk of microvascular complications in the diabetes control and complications trial-revisited. Diabetes 2008;57:995–1001. [DOI] [PubMed] [Google Scholar]
- [21].Ramachandran A, Snehalatha C, Satyavani K, et al. Metabolic syndrome in urban Asian Indian adults—a population study using modified ATP III criteria. Diabetes Res Clin Pract 2003;60:199–204. [DOI] [PubMed] [Google Scholar]
- [22].Emoto M, Nishizawa Y, Maekawa K, et al. Homeostasis model assessment as a clinical index of insulin resistance in type 2 diabetic patients treated with sulfonylureas. Diabetes Care 1999;22:818–22. [DOI] [PubMed] [Google Scholar]
- [23].Wallace TM, Levy JC, Matthews DR. Use and abuse of HOMA modeling. Diabetes Care 2004;27:1487–95. [DOI] [PubMed] [Google Scholar]
- [24].Keskin M, Kurtoglu S, Kendirci M, et al. Homeostasis model assessment is more reliable than the fasting glucose/insulin ratio and quantitative insulin sensitivity check index for assessing insulin resistance among obese children and adolescents. Pediatrics 2005;115:e500–3. [DOI] [PubMed] [Google Scholar]
- [25].Muniyappa R, Lee S, Chen H, et al. Current approaches for assessing insulin sensitivity and resistance in vivo: advantages, limitations, and appropriate usage. Am J Physiol Endocrinol Metab 2008;294:E15–26. [DOI] [PubMed] [Google Scholar]
- [26].Digby JE, Montague CT, Sewter CP, et al. Thiazolidinedione exposure increases the expression of uncoupling protein 1 in cultured human preadipocytes. Diabetes 1998;47:138–41. [DOI] [PubMed] [Google Scholar]
- [27].Kraus D, Jäger J, Meier B, et al. Aldosterone inhibits uncoupling protein-1, induces insulin resistance, and stimulates proinflammatory adipokines in adipocytes. Hormone Metab Res 2005;37:455–9. [DOI] [PubMed] [Google Scholar]
- [28].Sugimoto S, Nakajima H, Kodo K, et al. Miglitol increases energy expenditure by upregulating uncoupling protein 1 of brown adipose tissue and reduces obesity in dietary-induced obese mice. Nutr Metab 2014;11:1. [DOI] [PMC free article] [PubMed] [Google Scholar]
- [29].Kong D, Vong L, Parton LE, et al. Glucose stimulation of hypothalamic MCH neurons involves K ATP channels, is modulated by UCP2, and regulates peripheral glucose homeostasis. Cell Metab 2010;12:545–52. [DOI] [PMC free article] [PubMed] [Google Scholar]
- [30].Lim K-I, Shin Y-A. Impact of UCP2 polymorphism on long-term exercise-mediated changes in adipocytokines and markers of metabolic syndrome. Aging Clin Exp Res 2014;26:491–6. [DOI] [PubMed] [Google Scholar]
- [31].Huriyati E, Luglio HF, Ratrikaningtyas PD, et al. Dyslipidemia, insulin resistance and dietary fat intake in obese and normal weight adolescents: the role of uncoupling protein 2-866G/A gene polymorphism. Int J Mol Epidemiol Genet 2016;7:67. [PMC free article] [PubMed] [Google Scholar]
- [32].Chan CB, De Leo D, Joseph JW, et al. Increased uncoupling protein-2 levels in beta-cells are associated with impaired glucose-stimulated insulin secretion mechanism of action. Diabetes 2001;50:1302–10. [DOI] [PubMed] [Google Scholar]
- [33].Ji Q, Ikegami H, Fujisawa T, et al. A common polymorphism of uncoupling protein 2 gene is associated with hypertension. J Hypertens 2004;22:97–102. [DOI] [PubMed] [Google Scholar]
- [34].Andrews ZB, Liu Z-W, Walllingford N, et al. UCP2 mediates ghrelin's action on NPY/AgRP neurons by lowering free radicals. Nature 2008;454:846–51. [DOI] [PMC free article] [PubMed] [Google Scholar]
- [35].Castro MC, Massa ML, Del Zotto H, et al. Rat liver uncoupling protein 2: changes induced by a fructose-rich diet. Life Sci 2011;89:609–14. [DOI] [PubMed] [Google Scholar]
- [36].Barbieri M, Boccardi V, Esposito A, et al. A/ASP/VAL allele combination of IGF1R, IRS2, and UCP2 genes is associated with better metabolic profile, preserved energy expenditure parameters, and low mortality rate in longevity. Age 2012;34:235–45. [DOI] [PMC free article] [PubMed] [Google Scholar]
- [37].Costford SR, Chaudhry SN, Crawford SA, et al. Long-term high-fat feeding induces greater fat storage in mice lacking UCP3. Am J Physiol Endocrinol Metab 2008;295:E1018–24. [DOI] [PubMed] [Google Scholar]
- [38].Senese R, Valli V, Moreno M, et al. Uncoupling protein 3 expression levels influence insulin sensitivity, fatty acid oxidation, and related signaling pathways. Pflügers Archiv 2011;461:153–64. [DOI] [PubMed] [Google Scholar]
- [39].Busiello RA, Savarese S, Lombardi A. Mitochondrial uncoupling proteins and energy metabolism. Front Physiol 2015;6:36. [DOI] [PMC free article] [PubMed] [Google Scholar]
- [40].Fritz T, Krämer DK, Karlsson HK, et al. Low-intensity exercise increases skeletal muscle protein expression of PPAR ( and UCP3 in type 2 diabetic patients. Diabetes Metab Res Rev 2006;22:492–8. [DOI] [PubMed] [Google Scholar]