

Abstract
In shotgun proteomics analysis, user-specified parameters are critical to database search performance and therefore to the yield of confident peptide-spectrum matches (PSMs). Two of the most important parameters are related to the accuracy of the mass spectrometer. Precursor mass tolerance defines the peptide candidates considered for each spectrum. Fragment mass tolerance or bin size determines how close observed and theoretical fragments must be in order to be considered a match. For either of these two parameters, too wide a setting yields randomly high-scoring false PSMs, whereas too narrow a setting erroneously excludes true PSMs., in either case lowering the yield of peptides detected at a given false discovery rate. We describe a strategy for inferring optimal search parameters by assembling and analyzing pairs of spectra that are likely to have been generated by the same peptide ion in order to infer precursor and fragment mass error. This strategy does not rely on a database search, making it usable in a wide variety of settings. In our experiments, this strategy yields more high confidence PSMs than using settings based on instrument defaults or determined by experts. Param-Medic is open source and cross-platform. It is available as a standalone tool (http://noble.gs.washington.edu/proj/param-medic/) and has been integrated into the Crux proteomics toolkit (http://crux.ms), providing automatic parameter selection for the Comet and Tide search engines.
Keywords: database search, mass accuracy, tandem mass spectrometry
1 Introduction
Database search algorithms such as Sequest1 serve as the core of many shotgun analysis pipelines. Most search engines require a long list of user-supplied parameters, including cleavage enzyme, number of missed cleavages to allow, static and variable peptide modifications, and tolerances to use in matching observed precursor and fragment masses to their theoretical counterparts. Appropriate values for these parameters depend on the instrument used, the instrument settings used for a particular analysis, instrument performance at the time of acquisition, and other factors.
In this work, we focus on two of the most important search algorithm parameters. Precursor mass tolerance defines the peptide candidates considered for each spectrum. A narrower setting reduces the running time of the search algorithm by requiring it to perform fewer comparisons between peptides and spectra, but a too-narrow setting can exclude true matches. Too wide a setting can reduce sensitivity in a different way: as more candidates are considered for each spectrum, the chance of a false match randomly generating a higher score than a true match increases.2 Similarly, fragment mass tolerance or bin size determines how small the absolute value of the difference between a pair of observed and theoretical fragment masses must be in order to consider them a match. A tighter setting can exclude true matches between fragments, while a loose setting can lead to false matches between fragments, leading to more high-scoring false matches.
An important goal of many proteomics workflows is to achieve high statistical power for peptide detection. A commonly-used proxy for the peptide detection power of a database search is the number, or “yield,” of peptide-spectrum matches (PSMs)at a set false discovery rate (FDR) such as 0.01, as estimated by target-decoy procedure.3 We define the optimal value for precursor or fragment mass tolerance as the value that yields the most PSMs at FDR 0.01. The optimal value for either parameter may vary widely from experiment to experiment. This sensitivity to parameter settings has a real impact on experimental results, because the measurement of yield can vary greatly between the best and the worst parameter settings.
Researchers adopt different strategies to arrive at the settings they use for a given analysis. Some labs fine-tune the optimal settings for a particular instrument by performing searches on acquired data with many different settings. Because instrument performance can change over time to cause drift in both mass accuracy and calibration, researchers most concerned with using the proper settings will periodically perform measurements solely to reassess performance. On the other extreme, database searches are often performed by researchers other than those who ran the instrument, as when labs share data or when spectra are reanalyzed after being deposited in a public repository. In the absence of detailed information about how the instrument was run or how well it was performing at that time, researchers typically rely on instrument settings reported by the lab that ran the instrument or on the advertised capabilities of the instrument that was used,
Several tools have been developed to aid researchers in selecting optimal search parameter values. Many of these tools infer instrument calibration from experimental data by analyzing the observed m/z values of known ions: either spiked-in peptides or peaks confidently identified by database search.4–7 One such tool for the Windows platform, Preview,5 additionally assesses precursor and fragment mass error, nonspecific digestion, and sample modifications using a fast database search. However, neither Preview nor any of the other tools we surveyed provides a well-defined method for translating assessed m/z error into parameter settings for database search.
Here we describe Param-Medic: an open-source, cross-platform tool for assessing experimental m/z error and deriving parameters to search an LC-MS/MS experiment. We have trained Param-Medic to produce parameters appropriate for the Comet8 search engine, but the same strategy could be extended to work for any algorithm. At the heart of Param-Medic is a key assumption that despite the use of so-called “dynamic exclusion” rules, LC-MS/MS experiments typically make multiple observations of many individual peptide ions. Param-Medic exploits these repeated observations to enable estimation of m/z error. Specifically, the algorithm identifies pairs of spectra likely to represent the same peptide and then analyzes the distribution of differences between those pairs’ precursor and matched fragment ion m/z values. We trained Param-Medic on eight datasets from public repositories from a variety of organisms and instruments, and we evaluated its performance on three additional public datasets. Param-Medic is available as a standalone tool and as a part of the Crux proteomics toolkit, providing an open, integrated platform for parameter inference and database search.
2 Methods
2.1 Mass-to-charge error estimation
Param-Medic infers both precursor and fragment m/z search parameters in a four-step procedure (Figure 1). First, it pairs closely-eluting MS/MS spectra that have similar precursor and fragment m/z values. Then, it calculates the mass differences of both the paired precursors and the paired fragments. Next, it fits a separate mixed Gaussian-Uniform distribution to the error values for precursors and for fragments. Finally, it maps the standard deviation of each estimated Gaussian distribution to a value usable as a precursor tolerance or fragment bin size for database search.
Figure 1. Param-Medic workflow.
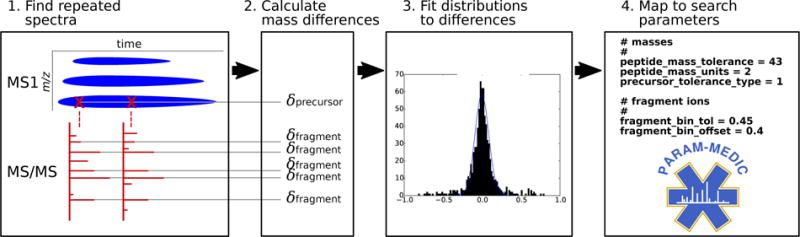
Param-Medic collects pairs of closely-eluting MS/MS spectra and assembles their pairwise precursor and most-intense five fragment mass differences. Precursor and fragment error are inferred by fitting a mixed Gaussian/uniform distribution to pairwise differences. Search parameter values are chosen by multiplying estimated error standard deviation by a multiplier associated with highest mean PSM yield in training datasets.
Param-Medic begins by assembling pairs of measurements from spectra with an inferred charge of 2 that appear to represent the same precursor ion or fragment ion (Figure 1). Precursor and fragment masses are calculated from their observed m/z values and are each binned coarsely with bin size 1.0005079, corresponding to the distance between the centers of two adjacent peptide mass clusters.9 One list of paired measurements is initialized for precursor values, and another for fragments.
As Param-Medic processes each sequential MS/MS scan, the algorithm identifies a previous MS/MS scan whose precursor falls in the same bin (if any). It then checks whether the associated precursor m/z is within 50 parts per million (ppm) of the precursor m/z of the new scan and whether at least 20 of the 40 most-intense binned fragments are unambiguously shared between the two spectra. If both conditions are met, then the two spectra are considered to represent the same peptide ion. In this case, the two precursor m/z values and the paired values for the five most-intense pairs of fragment m/z values are added to their respective lists. No single spectrum is included in more than one such pair. If Param-Medic detects fewer than 200 such pairs, then the program will terminate without estimating parameter settings.
In the second step, the ppm differences in measurement pairs are calculated from the pairs of measurements. This step and the following steps are performed separately but identically for precursor pairs and for fragment pairs. The output of this step is an empirical list of ppm differences in paired peak measurements. In practice, this list represents a mixture of differences between two correctly-paired measurements of the same peak and differences between two incorrectly-paired measurements of peaks that represent different ions. Below, we refer to these as “true” and “false” pairs, respectively.
In the third step, Param-Medic fits a theoretical distribution to the empirical distribution of errors from step two. Param-Medic assumes that ppm measurement error for true pairs is normally distributed. Therefore, the difference between two values drawn from the distribution of ppm measurement error is also normally distributed, with variance twice that of the measurement error. Param-Medic also assumes that differences between false pairs are uniformly distributed over the range considered. Accordingly, it models the distribution of measurement differences as a mixed Gaussian( for observed differences y) and uniform distribution. Expectation-maximization (EM) is used to estimate three parameters: the mean and standard deviation of the Gaussian distribution component( and ), and the probability of membership in the Gaussian distribution (pG). EM maximizes the log-likelihood of the observed data:
| (1) |
The algorithm alternates between an E step, which estimates expectation of the log-likelihood using the current parameter estimates, and an M step, which computes new parameter values maximizing the expected log-likelihood. Once is estimated, the standard deviation of the measurement error, , is estimated as .
In the final step, having estimated the standard deviation of the ppm error distributions, Param-Medic applies a scaling factor to to calculate the estimated optimal search parameter (either precursor tolerance or fragment bin size). This scaling factor is empirically estimated on an analysis of data from a wide variety of mass spectrometry experiments, as described in the following sections.
Many of Param-Medic’s parameters are adjustable. The values mentioned above for the charge state (2), wide ppm tolerance (50 ppm), number of peaks that must be shared between spectrum pairs (20 of the most-intense 40), number of fragments per pair used for estimation (5), and number of difference measurements required for estimation (200) are defaults that should be widely applicable but may be adjusted for unusual datasets. For example, a user may wish to choose a higher charge state when analyzing an experiment on tryptic peptides known to contain a very high proportion of missed tryptic cleavages.
2.2 Search of public datasets with different parameter values
For use in learning the scaling factors mapping to search parameter values, we collected eight training and three test datasets from the PRIDE10 and Chorus Project (http://chorusproject.org) proteomics data repositories, representing a variety of organisms and instruments (Table 1). All database searches were performed using Comet8 version 2015.01 rev. 2. Samples were searched against the appropriate UniProt databases for single organisms, Human Microbiome Project stool database for gut microbiome,11 or a site-specific sequencing-derived database for ocean microbiome.12 We used a concatenated decoy database in which peptide sequences were reversed but C-terminal amino acids left in place. Search parameters included a static modification for cysteine carbamidomethylation (57.021464) and a variable modification for methionine oxidation (15.9949). Enzyme specificity was trypsin with proline cleavage suppression, with one missed cleavage allowed. Parent ion mass tolerance was defined around five isotopic peaks. False discovery rate (FDR) was calculated by target-decoy competition using Percolator,13 and PSMs were accepted at FDR 0.01.
Table 1.
Experiments used in the training and testing of Param-Medic and their associated search parameters as adapted from their publications.
| Experiment | Instrument | Organism | Precursor tolerance (ppm) | Fragment bin size (Th) |
|---|---|---|---|---|
| Training Datasets | ||||
|
| ||||
| 2014kim-kidney14 | Orbitrap Velos | human | 10 | 0.05 |
| 2014kim-lung14 | Orbitrap Elite | human | 10 | 0.05 |
| 2015clark-redefining15 | LTQ Orbitrap | human | 50 | 1 |
| 2015radoshevich-isg1516 | QExactive | human | 4.5 | 0.02 |
| 2015tanca-impact17 | Orbitrap Velos | human gut microbiome | 10 | 0.02 |
| 2015uszkoreit-intuitive18 | Orbitrap Elite | mouse | 5 | 0.4 |
| 2016mann-unpublished | QExactive | human | 10 | 0.02 |
| 2016schittmayer-cleaning19 | Orbitrap Velos | yeast | 10 | 0.8 |
|
| ||||
| Test Datasets | ||||
|
| ||||
| 2016may-metapeptides12 | Qexactive | ocean microbiome | 10 | 0.02 |
| 2016audain-in-depth20 | LTQ Orbitrap | yeast | 25 | 0.5 |
| 2016zhong-quantitative21 | Orbitrap Velos | human | 20 | 0.5 |
The most basic method of choosing parameters is to use settings associated with the typical performance of the instrument. This method is often used when the experimental details related to a dataset are unknown. We defined “instrument default” settings for precursor ppm error and fragment bin tolerance for each instrument represented by the training and test datasets (Table 2), based on advertised instrument capabilities and literature search. We then held fragment bin tolerance for each experiment at the instrument default and performed ten separate searches, with settings for precursor ppm error varying uniformly over the range 5–50 ppm. Similarly, we held precursor ppm error at the instrument default and performed ten additional searches with settings for fragment bin tolerance varying uniformly over the range 0.02–1.0005 Da. A related parameter, fragment bin offset, should be set to roughly 0.4 when fragment bin size is near 1.0005 to ensure that the highest proportion possible of peaks associated with the same nominal mass are included in the same bin, but has little effect for other bin size values. This parameter was set to 0.4 in all searches. PSM yield for each search was defined as the number of PSMs at FDR 0.01.
Table 2.
Settings used in “instrument default” searches.
| Instrument | precursor (ppm) | fragment bin (Th) |
|---|---|---|
| LTQ Orbitrap | 50 | 1.005 |
| Orbitrap Velos | 50 | 0.05 |
| Orbitrap Elite | 50 | 0.02 |
| QExactive | 10 | 0.02 |
2.3 Mapping estimated error to search parameter values
The final outputs of Param-Medic are precursor and fragment m/z tolerance values for use in a database search. To produce these estimates, we used the search results from our eight training data sets over a wide range of parameter settings, along with the empirical error standard deviations , to estimate a multiplier that converts values into database search parameters that maximize PSM yield for a wide range of datasets. To this end, we normalized for differences in measurement error across the eight training datasets as follows. Separately for each parameter (precursor m/z tolerance and fragment bin size), we divided each parameter value vrawi by the corresponding measurement error standard deviation for that sample and then calculated a normalized value as the natural log of the result:
| (2) |
We then normalized the PSM yield associated with the search of an experiment e with the ith value for the parameter, by dividing by the highest PSM yield observed for experiment e under any parmeter setting:
| (3) |
For each experiment, this process yielded a different set of normalized parameter setting values, each associated with a different normalized PSM yield. In order to estimate the value associated with the highest mean normalized PSM yield over all experiments, we segmented the range from the minimum to the maximum values of the normalized parameter setting into 200 bins. We defined the yield of experiment e in bin b, , as the normalized PSM yield in that experiment associated with that bin, interpolating linearly between adjacent observed measurements and using the yields for the bins with highest and lowest normalized parameter values for each dataset to stand in for all higher-value or lower-value bins not searched for that dataset (Figure 3). We then chose the bin b′ associated with the highest mean normalized yield over the n experiments:
| (4) |
The center of bin b′, , is the natural log of Param-Medic’s estimate of the optimal multiplier relating one of the two values to its corresponding search parameter value. Therefore, to calculate the optimal precursor tolerance or fragment bin size, Param-Medic multiplies the appropriate estimate by its associated .
Figure 3. PSM yield vs. parameter settings in training datasets.
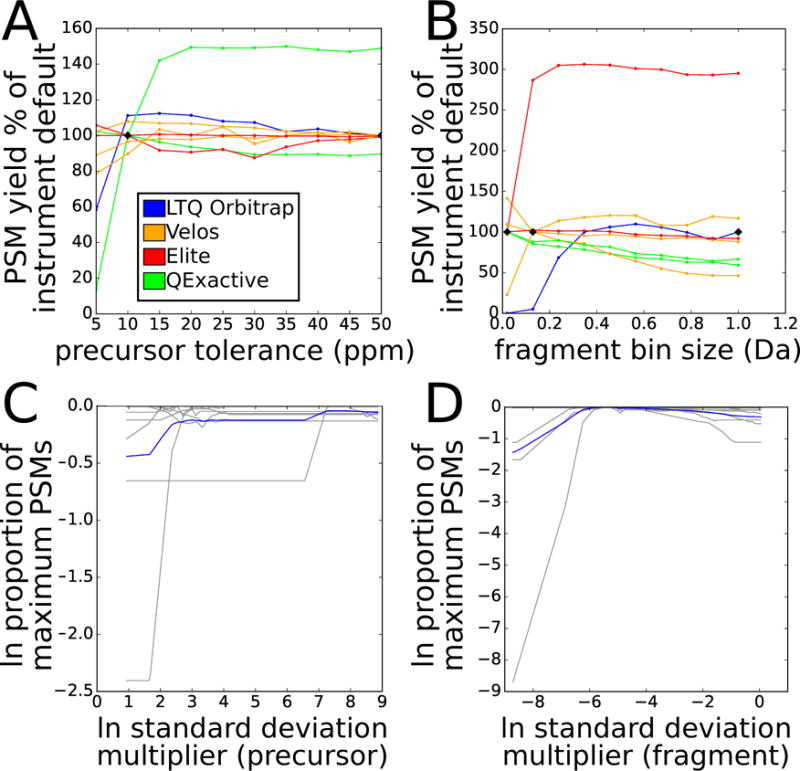
Panels A and B show PSM yield at FDR 0.01 as a function of the percentage of the PSM yield for that dataset when searched with instrument default settings. Each line represents a different training dataset, colored by instrument type. Black diamonds indicate instrument default settings. A: varying precursor tolerance from 5 ppm to 50 ppm. B: varying fragment bin size from 0.02 Da to 1.005 Da. Panels C and D show normalized PSM yield as a function of normalized error. Vertical axis measures PSM yield at FDR 0.01 as the natural log of the proportion of the maximum for that experiment. Horizontal axis measures parameter setting as the natural log of a multiple of the estimated standard deviation of measurement error. Gray lines represent individual experiments; blue line represents mean across all experiments. C: varying precursor tolerance. D: varying fragment bin size.
Param-Medic will refuse to estimate precursor error or fragment bin tolerance if there are fewer than 200 pairs of values that make up the mixed distribution. It will also fail if, as was the case in one of our training datasets, at least half of the values in the mixed distribution are exactly 0. This situation occurs when the values are rounded, and it is incompatible with the Param-Medic approach.
2.4 Alternative parameter-setting strategies
We compared search PSM yield from settings determined by Param-Medic with PSM yield from searches using other means of determining search parameters. In addition to the instrument defaults described above, we also derived parameter settings from the publications describing the datasets (or, in the case of one as-yet-unpublished training dataset, from the experimental metadata provided in the PRIDE repository for project ID PXD002854). Because the datasets were originally searched with a variety of search algorithms, the published parameter values may not map directly to Comet precursor tolerance and fragment bin size; ours is a good faith effort to represent the original searches as accurately as possible within the Comet/Percolator framework. We also used Preview to assess precursor and fragment median m/z error. To map these Preview-estimated error values to Comet search parameters, we used five times the median error, which is the the “rule of thumb” suggested in the Preview user manual.
3 Results
3.1 Param-Medic’s performance
We evaluated Param-Medic’s performance in terms of PSM yield, comparing it with the settings used in the original papers describing our datasets, with instrument default settings, and with Preview. On seven training datasets (Figure 2), Param-Medic parameter settings yielded 96% to 153% as many PSMs as settings as the original papers (median: 105%), and 99% to 296% as many as defaults based on instrument type (median: 120%). Param-Medic failed to find a sufficient number of repeated ions for parameter estimation on one training dataset because of a large proportion of exactly identical sequential values for precursor m/z, which we speculate was due to rounding of the precursor m/z values. Preview failed on the same training dataset as Param-Medic due to insufficient search results for error estimation. On the remaining seven datasets, Param-Medic yielded 99% to 139% as many PSMs as Preview (median: 101%).
Figure 2. Comparing Param-Medic with other methods.
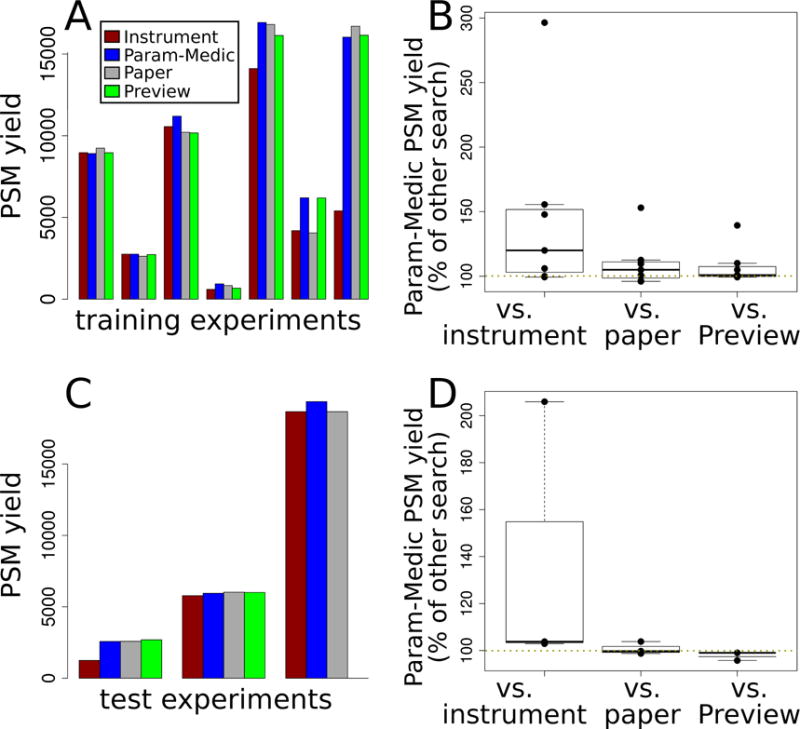
A. PSM yield at FDR 0.01 using parameters determined by four different methods: instrument defaults, Param-Medic, original paper settings, or Preview. Each cluster of bars represents one of the seven training experiments for which Param-Medic and Preview returned error estimates. Results are reported for the seven training data sets. B. Box plots showing the distribution PSM yield of searches with Param-Medic parameters as a percentage of the PSM yield using instrument defaults, original paper settings, and Preview, over the same seven training experiments. C and D. As A and B, but showing data from the three test experiments.
On three test datasets, Param-Medic parameter settings yielded 99–104% as many PSMs as settings from the original papers describing the experiments (median: 100%), and 103% to 206% as many PSMs as defaults based on instrument type (median: 104%). Preview failed on one test dataset due to insufficient search results for error estimation. On the other two, Param-Medic yielded 96% and 99% as many PSMs as Preview (Figure 2).
Any method for automatically estimating m/z search parameters should be fast as well as effective at optimizing PSM yield. On a 3.0GHz Intel Core Duo processor, Param-Medic ran in a few seconds to just over a minute on all training and test datasets, while Preview ran in a few minutes to nearly an hour and a half (Table 3). Param-Medic’s running time scaled with the number of spectra per experiment, while Preview’s scaled with both both the number of spectra and the size of the database. Preview took 88 minutes to run on the human gut microbiome sample, which it searched against a large gut microbiome database, even though that sample had just 10% more spectra than a human sample on which Preview ran in 14 minutes. The Preview running times are dominated by the database search, but also include some time spent performing activities not required for inferring mass error (e.g., inferring peptide digestion and variable modifications).
Table 3.
Wall-clock running times for Preview and Param-Medic on each experiment, in minutes. “N/A” indicates that a tool did not run successfully on a given experiment.
| Experiment | Organism | Spectra | Preview | Param-Medic |
|---|---|---|---|---|
| Training Datasets | ||||
|
| ||||
| 2014kim-kidney14 | human | 9,072 | 2 | 0.07 |
| 2014kim-lung14 | human | 17,612 | 3 | 0.13 |
| 2015clark-redefining15 | human | 38,570 | N/A | N/A |
| 2015radoshevich-isg1516 | human | 63,185 | 14 | 1.03 |
| 2015tanca-impact17 | human gut microbiome | 69,685 | 88 | 0.48 |
| 2015uszkoreit-intuitive18 | mouse | 26,992 | 6 | 0.67 |
| 2016mann-unpublished | human | 41,157 | 7 | 0.12 |
| 2016schittmayer-cleaning19 | yeast | 9,297 | 1 | 0.19 |
|
| ||||
| Test Datasets | ||||
|
| ||||
| 2016may-metapeptides12 | ocean microbiome | 98,317 | N/A | 0.68 |
| 2016audain-in-depth20 | yeast | 18,175 | 2 | 0.35 |
| 2016zhong-quantitative21 | human | 14,962 | 3 | 0.27 |
3.2 PSM yield variation between parameter settings
Some of our training experiments were much more sensitive to parameter settings than others. The extremes in difference in PSM yield between optimal and suboptimal settings for either parameter were quite high, with the worst and best parameter settings for precursor error yielding between 15% and 152% as many peptides as the instrument default settings, and for fragment bin size yielding between 13% and 334% (Figure 3A and 3B). The relationship between parameter settings and PSM yield was not consistent within an instrument type, with, for instance, the two QExactive experiments having opposite trends in yield as a function of precursor error tolerance. These results further demonstrate that the values specified for precursor and fragment tolerances can have a sizeable impact on PSM yield, and that knowledge of instrument type alone is not sufficient to set those parameters optimally.
For fragment bin size, there was very close agreement between the experiments as to the optimal multiple of estimated error standard deviation (0.005). For precursor tolerance, the agreement was not as complete, with two experiments holding the most influence over the derived optimal multiple (37.40) due to their high sensitivity to changes in this parameter (Figure 3C and 3D). The lower level of agreement for precursor tolerance may reflect differences in the density of candidate precursor matches in the target and databases being searched against.
4 Discussion
We have demonstrated that Param-Medic optimizes precursor error and fragment bin size parameter settings for LC-MS/MS search based on characteristics of the dataset being searched. Param-Medic assumes that LC-MS/MS experiments are likely to make multiple observations of many peptide ions. Ironically, this phenomenon is often perceived as a chronic problem plaguing data-dependent acquisition proteomics: high-abundance peptides, in particular, will tend to trigger multiple MS/MS scans, leading to fewer acquisitions of other peptides. Accordingly, instrument makers and researchers often adjust a dynamic exclusion window to minimize these repeated measurements, but such measurements are nonetheless a constant feature of most proteomics experiments. Param-Medic exploits these repeated measurements to provide valuable information about the m/z tolerance characteristics of the experiment.
On several of our training and test datasets, Param-Medic increased PSM yield greatly over parameter settings chosen based on instrument type. Many researchers will spend time iteratively fine-tuning their search settings for a particular instrument over multiple experiments in order to maximize yield, a process that Param-Medic can assist with. In other circumstances, instrument-based parameter settings are used often, as when searching experimental data provided by collaborators or downloaded from a public repository, with minimal description. Param-Medic showed particular improvement over instrument defaults for one of the QExactive training datasets. Like other instruments, the QExactive can be run in high- or low-resolution fragment mode; our instrument default settings naively assumed high-resolution fragments. Although this setting was not discussed in the paper describing the dataset, the Param-Medic error estimate and the much higher PSM yield with low-resolution fragments strongly suggest that the QExactive was run in low-resolution fragment mode when generating this dataset.
In our training and test datasets, Param-Medic settings yielded modestly more PSMs than settings chosen by experts for searching their own data for publication (and 47% more in one training dataset). We do not know what criteria these authors used to choose the settings, and the settings may have behaved quite differently in their hands, using different search engines or values for parameters other than the two considered here. However, the consistency of the trend indicates that many labs may benefit from an approach to parameter-setting that is based on the characteristics of the individual experiment being searched.
In terms of PSM yield, Param-Medic performs very similarly to Preview on most datasets evaluated, with a large advantage in PSM yield in a single training experiment and nearly identical performance in our test experiments (Supplementary Figure 1 compares the parameter estimates derived from Param-Medic and Preview on the training and test datasets). Param-Medic and Preview each fail to assess error in different circumstances: Preview when its database search fails, Param-Medic when there are insufficient or suspicious differences in measurements available for error estimation. In our training and test datasets, Param-Medic refused to estimate error once, whereas Preview refused to estimate error on that same experiment and on one other experiment. In addition to error estimation, Preview also infers instrument calibration and sample modifications. Preview is proprietary software and runs only on Windows. Param-Medic is implemented in Python as a standalone tool and is also integrated into the Crux toolkit for streamlined parameter estimation and search with Comet and Tide search engines. In both incarnations, Param-Medic is open source and can be run on Windows, Linux and Mac. Furthermore, the Param-Medic running time is much shorter than that of Preview. Preview’s running time scales with both the number of MS/MS spectra and the database size, whereas Param-Medic’s running time scales only with the number of spectra. In practice, neither tool’s running time likely to be onerous, except possibly for Preview when the search database is large. This occurs often, for instance, in a metaproteomics context.
Param-Medic has been implemented as a standalone Python 2.7 tool which may be downloaded (including source code) at https://github.com/dhmay/param-medic or simply added to a Python installation with the ‘pip’ tool. It has also been incorporated into version 3.1 of the Crux Toolkit, available at http://crux.ms. Within Crux, Param-Medic is available as a standalone tool and is also integrated into the Tide and Comet search algorithms for automatic detection of optimal parameter settings. All proteomics datasets described here, and links to all software, may be found at http://noble.gs.washington.edu/proj/param-medic/.
Supplementary Material
Acknowledgments
Research reported in this publication was supported by the National Defense Science and Engineering Graduate Fellowship (NDSEG) Program and by National Institutes of Health award P41 GM103533.
References
- 1.Eng JK, Mccormack AL, Yates JR. American society for Mass Spectrometry. 1994;5:976–989. doi: 10.1016/1044-0305(94)80016-2. [DOI] [PubMed] [Google Scholar]
- 2.Nesvizhskii AI. Journal of Proteomics. 2010;73:2092–2123. doi: 10.1016/j.jprot.2010.08.009. [DOI] [PMC free article] [PubMed] [Google Scholar]
- 3.Elias JE, Gygi SP. Nature Methods. 2007;4:207–214. doi: 10.1038/nmeth1019. [DOI] [PubMed] [Google Scholar]
- 4.Mortensen P, Gouw JW, Olsen JV, Ong S-e, Rigbolt KTG, Bunkenborg J, Foster LJ, Heck AJR, Blagoev B, Andersen JS, Mann M. Journal of proteome research. 2010;9:393–403. doi: 10.1021/pr900721e. [DOI] [PubMed] [Google Scholar]
- 5.Kil YJ, Becker C, Sandoval W, Goldberg D, Bern M. Analytical Chemistry. 2011;83:5259–5267. doi: 10.1021/ac200609a. [DOI] [PMC free article] [PubMed] [Google Scholar]
- 6.Petyuk Va, Mayampurath AM, Monroe ME, Polpitiya AD, Purvine S, Anderson Ga, Camp DG, Smith RD. Molecular & cellular proteomics: MCP. 2010;9:486–96. doi: 10.1074/mcp.M900217-MCP200. [DOI] [PMC free article] [PubMed] [Google Scholar]
- 7.Matthijnssens J, Ciarlet M, Rahman M, Attoui H, Estes MK, Gentsch JR, Iturrizagómara M, Kirkwood C, Mertens PPC, Nakagomi O, Patton JT, Franco M. Analytical Chemistry. 2009;153:1621–1629. [Google Scholar]
- 8.Eng JK, Jahan TA, Hoopmann MR. Proteomics. 2012;13:22–24. doi: 10.1002/pmic.201200439. [DOI] [PubMed] [Google Scholar]
- 9.Wolski WE, Farrow M, Emde AK, Lehrach H, Lalowski M, Reinert K. Proteome science. 2006;4:18. doi: 10.1186/1477-5956-4-18. [DOI] [PMC free article] [PubMed] [Google Scholar]
- 10.Vizcaino JA, Côté R, Reisinger F, Foster JM, Mueller M, Rameseder J, Hermjakob H, Martens L. Proteomics. 2009;9:4276–4283. doi: 10.1002/pmic.200900402. [DOI] [PMC free article] [PubMed] [Google Scholar]
- 11.Huttenhower C, et al. Nature. 2012;486:207–214. doi: 10.1038/nature11234. [DOI] [PMC free article] [PubMed] [Google Scholar]
- 12.May DH, Timmins-Schiffman E, Mikan MP, Harvey HR, Borenstein E, Nunn BL, Noble WS. Journal of Proteome Research. 2016 doi: 10.1021/acs.jproteome.6b00239. acs.jproteome.6b00239. [DOI] [PMC free article] [PubMed] [Google Scholar]
- 13.Käll L, Canterbury JD, Weston J, Noble WS, MacCoss MJ. Nature methods. 2007;4:923–925. doi: 10.1038/nmeth1113. [DOI] [PubMed] [Google Scholar]
- 14.Kim MS, et al. Nature. 2014;509:575–581. doi: 10.1038/nature13302. [DOI] [PMC free article] [PubMed] [Google Scholar]
- 15.Clark DJ, Fondrie WE, Liao Z, Hanson PI, Fulton A, Mao L, Yang AJ. Analytical Chemistry. 2015;87:10462–10469. doi: 10.1021/acs.analchem.5b02586. [DOI] [PMC free article] [PubMed] [Google Scholar]
- 16.Radoshevich L, Impens F, Ribet D, Quereda JJ, Tham TN, Nahori MA, Bierne H, Dussurget O, Pizarro-Cerda J, Knobeloch KP, Cossart P. eLife. 2015;4:1–23. doi: 10.7554/eLife.06848. [DOI] [PMC free article] [PubMed] [Google Scholar]
- 17.Tanca A, Palomba A, Pisanu S, Addis MF, Uzzau S. Data in Brief. 2015;4:559–562. doi: 10.1016/j.dib.2015.07.014. [DOI] [PMC free article] [PubMed] [Google Scholar]
- 18.Uszkoreit J, Maerkens A, Perez-Riverol Y, Meyer HE, Marcus K, Stephan C, Kohlbacher O, Eisenacher M. Journal of Proteome Research. 2015;14:2988–2997. doi: 10.1021/acs.jproteome.5b00121. [DOI] [PubMed] [Google Scholar]
- 19.Schittmayer M, Fritz K, Liesinger L, Griss J, Birner-Gruenberger R. Journal of Proteome Research. 2016;15:1222–1229. doi: 10.1021/acs.jproteome.5b01105. [DOI] [PMC free article] [PubMed] [Google Scholar]
- 20.Audain E, Uszkoreit J, Sachsenberg T, Pfeuffer J, Liang X, Hermjakob H, Sanchez A, Eisenacher M, Reinert K, Tabb DL, Kohlbacher O, Perez-Riverol Y. Journal of Proteomics. 2016 doi: 10.1016/j.jprot.2016.08.002. [DOI] [PubMed] [Google Scholar]
- 21.Zhong L, Zhou J, Chen X, Lou Y, Liu D, Zou X, Yang B, Yin Y, Pan Y. Scientific Reports. 2016;6:22635. doi: 10.1038/srep22635. [DOI] [PMC free article] [PubMed] [Google Scholar]
Associated Data
This section collects any data citations, data availability statements, or supplementary materials included in this article.